
 ?Mathematical formulae have been encoded as MathML and are displayed in this HTML version using MathJax in order to improve their display. Uncheck the box to turn MathJax off. This feature requires Javascript. Click on a formula to zoom.
Abstract
The present study examines simultaneous multiple response optimization using Derringer's desirability function for the development of an HPTLC method to detect Clonazepam and Paroxetine hydrochloride in pharmaceutical dosage form. Central composite design (CCD) was used to optimize the chromatographic conditions for HPTLC. The independent variables used for the optimization were the n-butanol content in the mobile phase, the chamber saturation time and the distance travelled. HPTLC separation was performed on aluminium plates pre-coated with silica gel 60 F254 as the stationary phase using n-butanol:glacial acetic acid:water (9:2:0.5% v/v/v) as the mobile phase. Quantification was achieved based on a densitometric analysis of Clonazepam and Paroxetine hydrochloride over the concentration range of 40–240 ng/band and 300–1800 ng/band, respectively, at 288 nm. The method yielded compact and well-resolved bands at R f of 0.77 ± 0.02 and 0.34 ± 0.02 for Clonazepam and Paroxetine hydrochloride, respectively. The linear regression analysis for the calibration plots produced r 2 = 0.9958 and r 2 = 0.9989 for Clonazepam and Paroxetine hydrochloride, respectively. The precision, accuracy, robustness, specificity, limit of detection and limit of quantitation of the method were validated according to the ICH guidelines. The factors evaluated in the robustness test were determined to have an insignificant effect on the selected responses. The results indicate that the method is suitable for the routine quality control testing of marketed tablet formulations.
1 Introduction
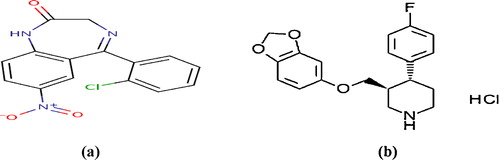
Clonazepam (CLO) [5-(2-chlorophenyl)-7-nitro-2,3-dihydro-1H-1,4-benzodiazepin-2-one] is a benzodiazepine drug that has anxiolytic, anticonvulsant, muscle relaxant, sedative, and hypnotic properties. This drug exerts its action via allosteric interactions between central benzodiazepine receptors and gamma-aminobutyric acid (GABA) receptors that potentiate the effects of GABA. This interaction results in the inhibition of synaptic transmission across the central nervous system [Citation1–Citation3]. Paroxetine hydrochloride (PH) [(−)-Trans-4R-(4′-fluorophenyl)-3S-[(3′,4′-methylenedioxyphenoxy)methyl] piperidine hydrochloride] is a selective serotonin (5-hydroxy-tryptamine, 5-HT) reuptake inhibitor (SSRI) and potentiates 5-HT in the CNS (). PH is indicated for the treatment of major depressive disorder, social anxiety disorder, obsessive-compulsive disorder, panic disorder, generalized anxiety disorder, and posttraumatic stress disorder [Citation1–Citation4].
Fig. 1 Chemical structure of (a) Clonazepam and (b) Paroxetine hydrochloride.
Depression and anxiety disorders are distinct illnesses that often coexist. Patients with comorbid depression and anxiety are more debilitated than patients with either condition alone. Mixed anxiety-depression is gaining recognition as a separate diagnosis and has been included in the 10th edition of the International Classification of Diseases and in the appendix of the 4th edition of the Diagnostic and Statistical Manual of Mental Disorders. Currently, a fixed dose combination of an anti-depressant, such as PH, and an anti-anxiety drug, such as CLO, is an available option for the treatment of co-morbid depression and anxiety [Citation4,Citation5].
According to the literature, CLO and PH are official in IP, USP and BP when used individually [Citation1,Citation6,Citation7], but the combination of CLO and PH is not official in any Pharmacopoeia. Various analytical methods, such as spectrophotometry [Citation8–Citation12], spectrofluorimetry [Citation13,Citation14], HPLC [Citation15–Citation25] and HPTLC [Citation26–Citation29], have been reported to detect CLO and PH alone and in combination with other drugs in pharmaceutical dosage forms. Spectrophotometric methods [Citation30,Citation31] and the stability-indicating HPLC method [Citation32,Citation33] have been reported for the simultaneous estimation of CLO and PH in combined pharmaceutical formulations. However, the development of a high-performance thin layer chromatographic (HPTLC) method for the simultaneous estimation of CLO and PH in a combined dosage form has not yet been reported.
Hence, this manuscript is the first to describe the development and validation of an HPTLC method per the ICH guidelines ICH Q2 (R1) for the simultaneous estimation of CLO and PH. A multivariate approach using an experimental design was used to study the effect of simultaneously varying several factors on the responses. The best experimental design approach for the purpose of modelling and optimization is response surface design. In the present study, a central composite design (CCD) was used to optimize the chromatographic conditions of the HPTLC method. CCD was selected due to its flexibility and applied to optimize the chromatographic conditions by gaining better understanding of the primary and interaction effects of factors [Citation34]. This study intended to develop a simple, rapid, precise and accurate HPTLC method using a DOE approach for the quantitative analysis of CLO and PH and to validate the method in accordance with ICH guidelines.
2 Materials and methods
2.1 Materials
Analytically pure CLO (Vital Formulation, India) and PH (Torrent Pharmaceutical, India) were received as gifts. Marketed tablet formulations of Pari-CR Plus, IPCA Laboratories, India (Label claim 0.5 mg of CLO and 12.5 mg of PH) were procured from the local market. All solvents and chemicals used were of analytical grade and purchased from Merck Specialities Pvt. Ltd., India.
2.2 Instrumentation
A Hamilton microlitre syringe (Linomat syringe 659.0014, Hamilton-Bonaduz Schweiz, Camag, Switzerland), precoated silica gel aluminium Plate 60 F254, (10 cm × 10 cm, 100 μm thickness; E. Merck, Darmstadt, Germany), Linomat 5 sample applicator (Camag, Switzerland), twin trough chamber (20 cm × 10 cm; Camag, Switzerland), UV chamber (Camag, Switzerland), and a TLC scanner 4 (Camag, Switzerland) operated by the winCATS software (version 1.4.6, Camag, Switzerland) were used in this study. All drugs and chemicals were weighed on an elctronic balance (AUW 220, Shimadzu Corp., Japan).
2.3 Preparation of standard solutions
Ten milligrams of standard CLO and PH were accurately weighed, transferred to two separate 10 ml volumetric flasks, dissolved in methanol and brought to volume with methanol to obtain a solution containing 1000 μg/ml of solute. Aliquots of the stock solutions were appropriately diluted with methanol to obtain working standards of 40 μg/ml CLO and 300 μg/ml PH.
2.4 Chromatographic procedure
Standard solutions of different concentrations were spotted with a micro-syringe in the form of bands having a band width of 6 mm on a pre-coated silica gel aluminium Plate 60 F254 using a Camag Linomat 5 sample applicator. Linear ascending development was carried out in a twin trough glass chamber. The mobile phase consisted of n-butanol: glacial acetic acid: water (9:2:0.5, %v/v/v). The optimized chamber saturation time before chromatographic development was 35 min at room temperature (25 ± 2 °C). The length of the chromatographic run was 8 cm. Subsequent to the development, HPTLC plates were dried in a current of air with the help of an air dryer. Densitometric scanning was performed using a Camag TLC scanner 4 with the winCATS software. All measurements were made in the reflectance–absorbance mode at 288 nm, with a slit dimension of 6.00 mm × 0.30 mm (micro), scanning speed of 20 mm/s, and data resolution of 100 μm/step. The source of radiation was a deuterium lamp emitting a continuous UV spectrum between 190 and 400 nm. The concentrations of both drugs were determined based on the intensities of diffusely reflected lights, and the data were evaluated using an ordinary linear regression analysis of peak areas.
2.5 Software aided method optimization
A central composite design (CCD) was used to optimize the compositional parameters and evaluate main effect, interaction effects and quadratic effects of the factors on the retardation factor (R f ) of both drugs. CCD is a useful aspect of the response surface methodology to explore quadratic response surfaces and construct second-order polynomial models without the need for a complete three-level factorial experiment [Citation34,Citation35].
The selection of critical factors and ranges examined for optimization was based on preliminary univariate studies of method development and chromatographic intuition. The composition of the mobile phase refers to the volume of n-butanol with respect to the total volume of the mobile phase. A total of fifteen experiments with five centre points were conducted by selecting three factors; the n-butanol content in the mobile phase (A), the chamber saturation time (B), the distance travelled (C) and the R f of CLO and PH were the responses selected for both drugs depicted in . The nominal value for all three factors, A, B and C, were 8 ml, 30 min, and 8 cm, respectively. Accordingly, the n-butanol content (A) was maintained between 6.59 and 9.41. Similarly, the minimum and maximum values of the chamber saturation time (B) were fixed at 22.93 min and 37.07 min, respectively. Likewise, the minimum and maximum values for the distance travelled (C) were fixed at 6.59 and 9.41, respectively. The coded value of α was 1.41. The data generated were analyzed using the trial version of the Design Expert (Version 9.0.0.1, Stat-Ease Inc., Minneapolis, MN, USA) statistical software. The significance of the relevant factors was calculated using Fisher's statistical test for the Analysis of Variance (ANOVA) model. All experiments were conducted in a randomized order to minimize the bias effects of uncontrolled variables. Replicates (n = 5) of the centre points were performed to estimate the experimental error.
Table 1 Central composite rotatable design arrangement and responses.
2.6 Method validation
The accuracy, precision, limit of detection (LOD), limit of quantitation (LOQ), specificity, and robustness of HPTLC method were validated in accordance with the ICH Q2 (R1) guideline [Citation36].
2.6.1 Linearity
Different volumes (1–6 μl) of standard solutions of both drugs were applied to the HPTLC plate to obtain a concentration range of 40–240 ng/band of CLO and 300–1800 ng/band for PH, and five replicate measurements were conducted. The measured peak areas versus the corresponding concentrations of both drugs were evaluated with an ordinary linear regression analysis. The homoscedasticity of the variances along the regression line of each drug was verified using Bartlett's test [Citation37].
2.6.2 Sensitivity
The limit of detection (LOD) and limit of quantitation (LOQ) of the developed method were calculated based on the standard deviation of the response and slope of the calibration curve of drugs using the formula set forth in the ICH guidelines:
where “σ” is the standard deviation of the y intercepts of the regression lines, and “S” is the slope of the calibration curve.
2.6.3 Precision
The precision of the developed method was evaluated by performing intra-day and inter-day precision studies. The intra-day precision was assessed based on three replicates of three different concentration (80, 160 and 240 ng/band for CLO; 600, 1200 and 1800 ng/band for PH) on same day, and the measured peak area is expressed in terms of the per cent relative standard deviation (% RSD). The inter-day precision study was performed on three different days using the aforementioned concentrations of both drugs in triplicate.
2.6.4 Accuracy
The accuracy of the method was ascertained in triplicate at three concentration levels of 50%, 100% and 150% by spiking the pre-quantified samples with a known amount of CLO and PH standard and calculating the recovery and % RSD for both drugs. The recovery studies were carried out by spiking the dosage form (40 ng/band and 600 ng/band) with three different amounts of CLO standard (20, 40, 60 ng/band) and PH standard (300, 600 and 900 ng/band), respectively, using a standard addition method [Citation38].
2.6.5 Specificity
The specificity of the method was ascertained by comparing the samples of tablet formulation with standard drugs. The bands for CLO and PH in sample were confirmed by comparing the R f and overlaying peak purity spectra with that of the standard. The peak purities of CLO and PH were assessed by comparing the spectra at three different levels, i.e., the peak start (S), peak apex (M) and peak end (E) positions of the band.
2.6.6 Robustness
The effect of small and deliberate variations in the method parameters, such as a change in the n-butanol content in the mobile phase by volume, saturation time, distance travelled or wavelength, was evaluated. The effect of these changes on both the R f values and peak areas was examined by calculating the % RSD for each parameter.
2.7 Analysis of marketed formulation
To determine the CLO and PH content of the tablet dosage form, twenty tablets were accurately weighed, and their mean weight was determined. These tablets were then finely powdered in a glass mortar. A powder equivalent to 0.4 mg of CLO and 10 mg PH was accurately weighed and transferred into a 10 ml volumetric flask with 5 ml methanol. The mixture was diluted to volume with methanol and sonicated for 15 min before being filtered through Whatman no. 42 filter paper wetted with methanol. The solutions were diluted to obtain a sample stock solution containing 40 μg/ml of CLO and 1000 μg/ml of PH. One microlitre of the filtered solution (40 ng/band of CLO and 1000 ng/band of PH) was applied to the HPTLC plate, followed by development and scanning. The analysis was repeated in triplicate.
3 Results and discussion
3.1 Selection of wavelength
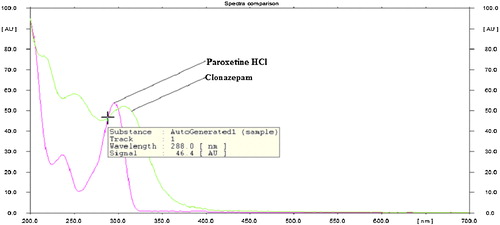
The sensitivity of the HPTLC method with ultraviolet detection depends on the use of an appropriate wavelength. The developed plate was subjected to densitometric measurements in scanning mode in the UV–vis region of 200–700 nm, and the overlain spectrum was recorded on a CAMAG TLC Scanner 4. Both drugs appreciably absorbed light at 288 nm, and this wavelength was selected as the detection wavelength ().
Fig. 2 Overlain absorption spectra of Clonazepam and Paroxetine hydrochloride at 288 nm.
3.2 Method optimization
The chromatographic conditions were optimized in order to develop an HPTLC method for the simultaneous measurement of CLO and PH in bulk and pharmaceutical dosage form.
3.2.1 Preliminary study
A HPTLC method for CLO and PH alone or combined with another drug had previously been reported. Specifically, the selected mobile phase consisted of n-butanol, glacial acetic acid and water [Citation27]. Hence, various combinations of these components at different proportions, such as n-butanol:acetic acid (6:4, v/v) or n-butanol:glacial acetic acid:water (6:4:0.5, 7:3:0.5, 8:1:1, 9:1:1, 8:2:0.5, v/v/v), were tested at a fixed chamber saturation time of 30 min and solvent migration distance of 80 mm. However, the drugs were not satisfactorily resolved with an acceptable R f value. Generally, the chamber saturation time and solvent migration distance are crucial to HPTLC chromatographic separation. Here, a chamber saturation time of less than 25 min and solvent migration distances greater than 80 mm resulted in the diffusion of the analyte band. A solvent consisting of n-butanol: glacial acetic acid: water (8:2:0.5, v/v/v) was found to be a satisfactory mobile phase that separated CLO and PH well. However, the R f value of CLO was close to 0.8 and also affected by the chamber saturation time. Therefore, further chromatographic conditions were optimized to obtain well-defined, compact bands of CLO and PH with acceptable R f values (<0.8) for both drugs using CCD.
3.2.2 Optimization of chromatographic conditions using CCD
CCD was selected due to its flexibility and applied to optimize the HPTLC separation by gaining a better understanding of the factor's main and interaction effects. A three-factorial, rotatable central composite statistical experimental design was employed using 15 experimental runs that included five centre points. The independent variables, such as the n-butanol content in the mobile phase (A), chamber saturation time (B) and distance travelled (C), and the responses for all 15 optimized trial experimental runs are summarized in . During model selection, the best-fitted models for the R f values of CLO and PH were a linear and quadratic model, respectively, based on the lowest PRESS value and adjusted R 2 value closer to 1.
The model was also validated with an analysis of variance (ANOVA) using the Design Expert software, and the results are presented in . Significant effects had a P value less than 0.05. An adequate precision, a measure of the signal (response) to noise ratio, greater than 4 is desirable, and the obtained ratio for both drugs indicated an adequate signal [Citation39]. A coefficient of variation (% CV), which measures the reproducibility of the model, was less than 10%, and the adjusted R-square values were high, indicating a good relationship between the experimental data and those of the fitted models. Here, the adjusted R 2 values were well within the acceptable limit of R 2 ≥ 0.80, which indicated that the experimental data fitted polynomial equations well [Citation40,Citation41]. The final equation, in terms of the actual components and factors, is shown in . A positive value represents an effect that favours optimization, whereas a negative value indicates an inverse relationship between the factor and the response.
Table 2 Predicted response models and statistical parameters obtained from the ANOVA for CCD.
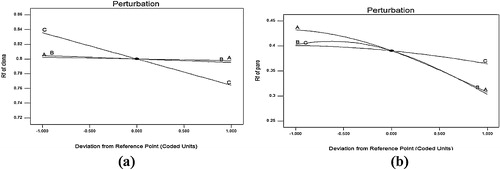
Three-dimensional response surface plots and perturbation plots were constructed to evaluate the effect of the factors on the retention factor of each drug. In , perturbation plots are presented for the predicted model to better understand the investigated procedure. This figure demonstrates how the response changes in response to perturbations in each factor from its defined reference value while all other factors are held constant at a reference point; the steepest slope or curvature indicates the sensitivity to a specific factor. (a) shows that the distance travelled (factor C) had the most significant effect on the R f value of CLO compared with other factors. Moreover, the n-butanol content (A) and chamber saturation time (B) had more significant effects on the R f value of PH, followed by the distance travelled (factor C) ((b)). (a) represents a variation in the R f value of CLO as a function of the chamber saturation time and distance travelled while the n-butanol concentration was constant. Specifically, the retention factor of CLO inversely correlated with the distance travelled. An analysis of the perturbation plots and response plots of the optimization model revealed that the n-butanol content (A) and chamber saturation time (B) more significantly affected the responses than factor C, i.e., the distance travelled.
Fig. 3 Perturbation graph showing the effect of each factor, A, B, and C, on the (a) Rf value of Clonazepam and (b) the Rf value of Paroxetine hydrochloride.
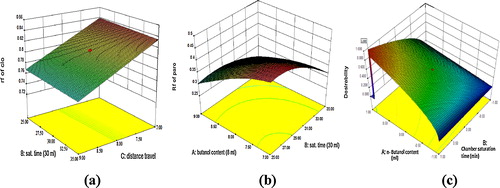
The optimum conditions of separation were estimated using Derringer's desirability function [Citation35]. During the numerical optimization, the targets of individual factors and responses were fixed. Of the 15 different solutions of the optimization provided by the software, two conditions that have a desirability near 1 were selected. The response surface obtained for the maximum Derringer's desirability function is presented in C. To investigate the predictability of the proposed model, the agreement between the experimental and predicted responses for both the predicted optimums, 1 and 2, are shown in . The percentage of the prediction error was calculated using the following formula: predicted error = experimental-predicted/predicted × 100.
Table 3 Comparison of experimental and predicted values of different experimental runs under optimum conditions.
Fig. 4 Three-dimensional plots of the RSM for both responses (a) variation in the Rf of Clonazepam (CLO) as a function of B and C for a fixed value of A; (b) variation in the Rf of Paroxetine hydrochloride (PH) as a function of A and B for a fixed value of C; (c) graphical representation of the maximum of Derringer's desirability function.
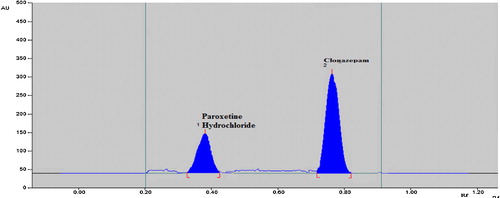
and the % predicted error identified a set of coordinates that produced a high desirability value (D = 1) at optimum condition 1. Thus, these coordinates were used to select an optimum experimental condition to analyze CLO and PH in combination. The selected optimized composition for the final HPTLC analysis was n-butanol:glacial acetic acid:water (9:2:0.5, v/v/v). Under the optimized conditions, the HPTLC densitogram showed an R f of 0.77 for CLO (40 ng/band) and 0.34 for PH (300 ng/band) and is depicted in .
Fig. 5 HPTLC densitogram under optimized conditions showing Rf values of 0.77 for Clonazepam (40 ng/band) and 0.34 for Paroxetine hydrochloride (300 ng/band).
3.3 Method validation
3.3.1 Linearity
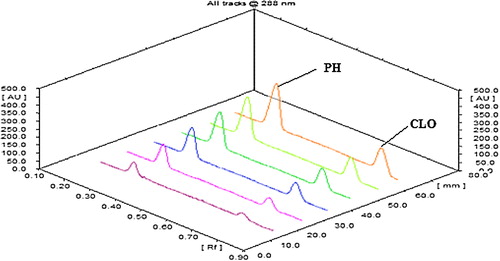
The linearity of an analytical method is its ability to provide results that are directly, or via a mathematical transformation, proportional to the concentration of the analyte within a given range. The CLO and PH showed a good correlation coefficient (r 2 = 0.9958 for CLO and r 2 = 0.9989 for PH) in the proposed concentration ranges of 40–240 ng/band for CLO and 300–1800 ng/band for PH (). The homoscedasticity of the variance was confirmed using Bartlett's test, and the responses of the peak area for both drugs exhibited homogenous variance, as indicated by a χ 2 value less than the tabulated value (). shows a three-dimensional overlay of the HPTLC densitograms for CLO and PH with calibration bands at 288 nm.
Table 4 Analytical validation parameters for CLO and PH using the HPTLC method.
Fig. 6 Three-dimensional densitogram for the linearity of Clonazepam and Paroxetine hydrochloride at 288 nm.
3.3.2 LOD and LOQ
The LOD and LOQ of the developed method were found to be 8.840 and 26.789 ng/band, respectively, for CLO and 63.416 and 195.260 ng/band, respectively, for PH, indicating the sensitivity of the proposed method ().
3.3.3 Precision
The experiment was repeated three times in one day (intra-day precision), and the average % RSD values of the results were calculated. Similarly, the experiment was repeated on three different days (inter-day precision), and the average % RSD values for the peak areas of CLO and PH were calculated. The intra-day and inter-day precision is expressed in terms of % RSD and was less than 2, confirming the precision of the method ().
3.3.4 Accuracy
When used to evaluate the recovery after spiking with three concentrations of standard, 50%, 100% and 150%, the proposed method showed percentage recovery rates between 101.46–101.54 for CLO and 101.21–101.87 for PH, which were within the acceptable range of 100 ± 2% [Citation38].
3.3.5 Specificity
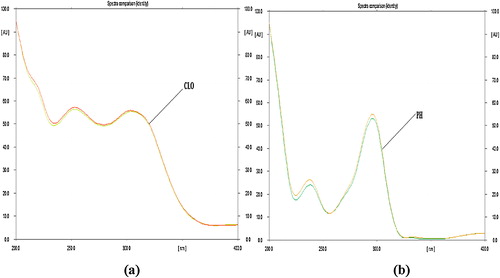
The chromatogram of the pharmaceutical formulation obtained using the developed method showed only two peaks at R f of 0.77 and 0.34 for CLO and PH, respectively, and was found to be at the same R f for both standard drugs. The peak purity of both drugs in pharmaceutical dosage form was confirmed by comparing the overlaid spectra at the peak start, peak apex and peak end positions of the band. The results shown in demonstrate that the purity exceeded 0.999 for all peaks, indicating the specificity of method in the presence of various excipients ().
Fig. 7 Overlain peak purity spectra of (a) Clonazepam (CLO) and (b) Paroxetine hydrochloride (PH) with the corresponding standard.
3.3.6 Robustness
A deliberate change in various parameters, such as the n-butanol content in the mobile phase, chamber saturation time, distance travelled and wavelength, produced %Relative standard deviations of the peak area of less than 2%, indicating the robustness of the method ().
Table 5 Robustness study of developed HPTLC method.
3.4 Analysis of marketed dosage form
The analysis of the tablet formulation containing 0.5 mg CLO and 12.5 mg PH showed good recovery. Specifically, the percentages were 99.926% for CLO and 100.980% for PH, indicating that the method can be used for routine quality control when testing the tablet dosage formulation. The %RSD value was found to be less than 2.
4 Conclusions
The CCD design and response surface methodology helps to obtain essential information on the sensitivity of the R f values of CLO and PH to various chromatographic variables. The n-butanol content, chamber saturation time and distance travelled were simultaneously optimized by applying a useful experimental design tool: response surface design and Derringer's desirability function. The obtained results indicated that the use of a CCD design and multi-criteria decision making approach is a flexible procedure that can reduce the number of necessary experiments for the development and optimization of an HPTLC method. Furthermore, it is an economic method that can be used to generate a maximum amount of information in less time with a small number of experiments. Methodological validation indicates that the established HPTLC method is simple, accurate\reliable and suitable for the rapid quantitative analysis of CLO and PH in routine tests. The proposed HPTLC method can be successfully utilized to simultaneously estimate the amounts of CLO and PH in pharmaceutical dosage form without interference and the need to first separate individual drugs.
Acknowledgements
We would like to express our gratitude to Vital Formulation, Vithal Udhyognagar, Anand and Torrent Pharmaceutical, Ahmedabad for providing the gifts of standard Clonazepam and Paroxetine hydrochloride.
Notes
Peer review under responsibility of Taibah University
References
- Indian PharmacopoeiaMinistry of Health and Family Welfarevol. 22014Indian Pharmacopoeial CommissionGhaziabad pp. 1434, 2439
- H.P.RangM.M.DaleJ.M.RitterR.J.FlowerRang and Dale's Pharmacology6th ed.2007Churchill Livingstone Elsevier536542
- J.H.BrownP.TaylorL.J.RobertJ.D.MarrowGoodman and Gilman's The Pharmacological Basis of Therapeutics2001McGraw-HillNew York280
- T.JagawatA comparative study to assess the efficacy and safety of combination capsules of paroxetine and clonazepam in comparison to paroxetine in patients suffering from co-morbid depression and anxietyDelhi Psychiatry J.142011106109
- American Psychiatry AssociationDiagnostic and Statistical Manual of Mental Disorders Ed (DSM-IV)1994APAWashington, DC
- United States Pharmacopeia 38National Formulary 33vol. 22015The United States Pharmacopeial ConventionRockville pp. 2888, 4765
- British PharmacopoeiaMedicines and Health Care Products Regulatory Agencyvols. 1 and 22014 London, pp. 506–508, 587–588
- A.OnalS.KepekciA.OztuncSpectrophotometric methods for the determination of the antidepressant drug paroxetine hydrochloride in tabletsJ. AOAC Int.882005490495
- R.B.KakdeD.D.SatoneSpectrophotometric method for simultaneous estimation of escitalopram oxalate and clonazepam in tablet dosage formIndian J. Pharm. Sci.712009702705
- M.R.SyedS.HasmiJ.B.NaikUV spectrophotometric method development and validation for determination of Paroxetine hydrochloride in pharmaceutical dosage formInt. J. Pharm. Pharm. Sci.220104345
- M.C.SharmaS.SharmaValidated simultaneous spectrophotometric estimation of paroxetine HCl bulk and tablet dosage form using ferric chlorideJ. Optoelectron. Biomed. Mater.22010185189
- V.B.PatelJ.B.DaveF.M.PatelC.N.PatelUV spectrophotometric method for identification and estimation of clonazepam in tablet dosage formInt. J. Pharm. Res. Bio-sci.120126270
- A.NavalA.SawsanS.MahaSpectroflourimetric determination of Paroxetine Hydrochloride in its formulation and human plasmaChem. Pharm. Bull.542006564566
- I.A.DarwishS.M.AmerH.AbdineL.I.Al-RayesNew spectrofluorimetric method with enhanced sensitivity for determination of paroxetine in dosage forms and plasmaAnal. Chem. Insights182008145155
- J.ChristopherT.S.JamesAnalysis of clonazepam in a tablet dosage form using small bore HPLCJ. Pharm. Biomed. Anal.181998453460
- J.LambropoulosG.A.SpanosN.V.LazaridisMethod development and validation for the HPLC assay (potency and related substances) for 20 mg paroxetine tabletsJ. Pharm. Biomed. Anal.191999793802
- S.V.GandhiN.D.DhavaleV.Y.JadhavS.S.SabnisSpectrophotometric and reversed-phase high-performance liquid chromatographic methods for simultaneous determination of escitalopram and clonazepam in combined tablet dosage formJ. AOAC Int.9120083338
- S.M.LakshmiG.KumaraswamyG.L.AshwiniA validated RP-HPLC method for the estimation of paroxetine hydrochloride in bulk and tablet dosage formJ. Pharm. Res.520121768
- D.MeghanaK.LahariK.ShanthaKumariK.PrakashDevelopment and validation of RP-HPLC method for simultaneous estimation of clonazepam and propranolol hydrochloride in bulk and pharmaceutical dosage formsInventi Rapid: Pharm. Anal. QA4201215
- N.B.ChusenaD.R.GarikapatiP.UshaDevelopment and validation of an RP-HPLC method for the simultaneous determination of Escitalopram Oxalate and Clonazepam in bulk and its pharmaceutical formulationsInt. Curr. Pharm. J.12012193198
- S.A.TanikellaS.SakinalaC.B.T.SundariJ.VaidyaDevelopment and validation of a RP-HPLC method for simultaneous estimation of propranolol HCl and clonazepam in bulk and pharmaceutical dosage formsInt. Res. J. Pharm.32012
- R.D.ChakoleM.S.ChardeN.BhavsarR.P.MaratheSimultaneous estimation of escitalopram and clonazepam by RP-HPLC in pharmaceutical formulationsInt. J. Phytopharm.220122529
- R.MallikarjunaN.K.AgarwalP.K.BichalaS.SomMethod development and validation for the simultaneous estimation of Desvenlafaxine and Clonazepam in bulk and tablet formulation by RP-HPLC methodIndian J. Res. Pharm. Biotechnol.12013525532
- R.B.KakdeD.D.SatoneK.K.GadapayaleM.G.KakdeStability-indicating RP-HPLC method for the simultaneous determination of escitalopram oxalate and ClonazepamJ. Chromatogr. Sci.512013490495
- N.AgrawalJ.Esteve-RomeroN.P.DubeyA.DurgbanshiD.BoseJ.Peris-VicenteS.Carda-BrochDetermination of paroxetine in pharmaceutical preparations using HPLC with electrochemical detectionOpen Anal. Chem. J.7201315
- R.SkibinskiG.MisztalM.KudrzyckiDetermination of fluoxetine and paroxetine in pharmaceutical formulations by densitometric and videodensitometric TLCJ. Planar Chromatogr. Mod. TLC1620031922
- A.VenkatachalamV.S.ChatterjeeStability-indicating high performance thin layer chromatography determination of Paroxetine hydrochloride in bulk drug and pharmaceutical formulationsAnal. Chim. Acta5982007312317
- N.DhavaleS.GandhiS.SabnisK.BotharaSimultaneous HPTLC determination of escitalopram and clonazepam in combined tabletsChromatographia672008487490
- R.KakdeD.SatoneN.BawaneHPTLC method for simultaneous analysis of escitalopram and clonazepam in pharmaceutical preparationJ. Planar Chromatogr.222009417420
- J.M.BodaH.A.BhalodiyaP.B.PatelUV spectroscopic method for simultaneous estimation of clonazepam and paroxetine hydrochloride hemihydrate in combined pharmaceutical formulationInventi Rapid: Pharm. Anal. QA2012
- V.K.SheejaA.S.SwapnaS.C.EapenP.KumarMethod development and validation for the simultaneous estimation of clonazepam and paroxetine in combined dosage form using colorimetryAsian J. Res. Chem.7201448
- G.YanamadalaP.P.Praveen SrikumarDevelopment and validation of a stability-indicating HPLC method for the simultaneous determination of paroxetine hydrochloride and clonazepam in pharmaceutical dosage formsInt. J. Pharm.42014448457
- G.Srinivas ReddyS.L.N.Prasad ReddyL.Shiva Kumar ReddyDevelopment and validation of a stability indicating liquid chromatographic method for the simultaneous estimation of paroxetine and clonazepam in bulk and its pharmaceutical formulationsInt. J. Pharm. Pharm. Sci.62014397402
- M.M.HendriksJ.H.De BoerA.K.SmildeD.A.DoornbosMulticriteria decision makingChemometr. Intell. Lab. Syst.161992175191
- T.SivakumarR.ManavalanK.ValliappanGlobal optimization using derringer's desirability function: enantioselective determination of ketoprofen in formulation and in biological matricesActa Chromatogr.1920072947
- International Conference on HarmonizationICH Q2 (R1): Validation of Analytical Procedures: Text and Methodology2005ICH SecretariatGeneva
- J.H.ZarBiostatical Analysis5th ed.2010Pearson Education Inc.New Jersey
- G.KleinschmidtJ.ErmerJ.H.M.MillerMethod Validation in Pharmaceutical Analysis. A Guide to Best Practice2005Wiley-VCH Verlag GmbH & Co. KGaAWeinheim
- T.B.SolankiP.A.ShahK.G.PatelCentral composite design for validation of HPTLC method for simultaneous estimation of olmesartan medoxomil, amlodipine besylate and hydrochlorothiazide in tabletsIndian J. Pharm. Sci.762014179187
- G.MustafaA.AhujaS.BabootaJ.AliBox-Behnken supported validation of stability-indicating high performance thin-layer chromatography (HPTLC) method: an application in degradation kinetic profiling of ropiniroleSaudi Pharm. J.21201393102
- V.Sree JanardhananR.ManavalanK.ValliappanChemometric technique for the optimization of chromatographic system: simultaneous HPLC determination of Rosuvastatin, Telmisartan, Ezetimibe and Atorvastatin used in combined cardiovascular therapyArab. J. Chem.2012110