
 ?Mathematical formulae have been encoded as MathML and are displayed in this HTML version using MathJax in order to improve their display. Uncheck the box to turn MathJax off. This feature requires Javascript. Click on a formula to zoom.
Abstract
The charge-transfer complexation (CTC) formed between olanzapine and chloranilic acid have been studied and used as a sensitive colorimetric method for the determination of olanzapine.
1 Introduction
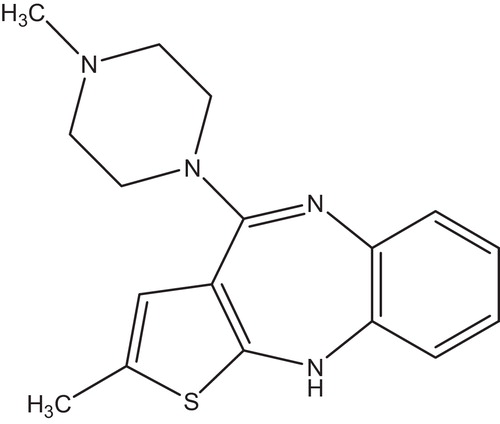
Olanzapine (OLP), with chemical name 2-methyl-4-(4-methyl-1-piperazynyl) 10H-thieno-[2,3-b][1,5]benzodiazepine is a thienobenzodiazepine derivative (). It was first synthesized by Eli-lilly, UK in 1982. The FDA, approved olanzapine sold by Eli-lilly under the trademark Zyprexa® in late 1996 [Citation1]. Olanzapine is used in the treatment of mental illness in adults and teenagers who are 13 years of age and older. The main purpose is to treat schizophrenia, a mental illness that causes unusual thinking, loss of interest in life, and strong emotional changes. It is also used to treat bipolar disorder. Olanzapine is referred to as “atypical antipsychotic” because it works by changing the activity of certain natural substances in the brain. Olanzapine molecule has a high affinity for two receptors in the brain. It binds to D2 dopamine receptors and 5H2 serotonin receptor which are important for maintaining chemical balance within the brain. When a patient has schizophrenia, these receptors start malfunctioning and thus creating chemical imbalances in the brain. Olanzapine's function is to prevent these receptors from further functioning by binding to them in such a way that they stop working. The polarity of olanzapine molecule allows it to bind strongly to the protein as it is a polar molecule.
Fig. 1 Structure of olanzapine.
The active substance olanzapine is pale yellow to yellow crystalline powder. Physico-chemical properties have been adequately described including solubility and polymorphism. Olanzapine can exist as five possible polymorphic forms (I, II, III, IV and V). The control of polymorphism has been achieved and was found to be stable during stability studies according to the European Medicine Agency report [Citation2].
Several methods have been reported for the quantitative estimation of OLP in pure drug, dosage form and in biological fluids and also when OLP is present in combination with other drugs. These methods include analysis in biological fluids and dosage forms using HPLC [Citation3–Citation7], gas chromatographic methods for assay of olanzapine in human plasma [Citation8] and in human tissue [Citation9] and titration in non-aqueous medium [Citation10].
Ranking highest among the methods that have been previously described are several spectrophotometric methods for the determination of olanzapine in bulk drug and in formulations. Chemically, olanzapine is easily oxidized, a potential property that has been adopted by several researchers for accurate estimation of OLP in dosage forms and bulk drugs. Many oxidizing agents have been used and sometimes in combination with chromogenic agents, like dyes to improve and provide accurate quantitation in the visible region and to avoid interference from other substances present in its matrix, which might be prominent if analyses are carried out in the ultraviolet region of the electromagnetic spectrum. Some of the reagents that have been reported include; potassium hexacyanoferrate(III) [Citation11], N-bromosuccinide and cerium (IV) sulphate in an acidic medium [Citation12], oxidation with potassium iodate in sulphuric acid medium [Citation13], iodine monochloride [Citation14], cerium(IV) sulphate as the oxidimetric agent and thiocyanate, tiron, and ferrocyanide as the colour forming complexing [Citation15], bromocresol purple and bromo thymol blue [Citation16]. A recent spectroscopic method for the determination of olanzapine includes simultaneous determination of olanzapine when present with fluoxetine HCl without separating from each other or the excipients. The developed method was based on simultaneous equations (Verodt's method) [Citation1]. Some procedures involving condensation reactions for the assay of olanzapine using 1,2-Naphtoquinone-4-sulphate [Citation17] and p-dimethylaminobenzaldehyde [Citation18] as a derivatizing reagents have also been recently described.
Although many of these reported methods are accurate and sensitive, some use sophisticated equipment and expensive reagents. Some are cumbersome in the sense that, they require prolonged sample pre-treatment, strict control of pH and longer reaction times. Each method however has its own merits but the desire to develop a readily available, simple and yet accurate method formed the primary motivation for this work. The sensitive, accurate and simple colorimetric determination of OLP following charge-transfer complexation with chloranilic acid is described in this report. To the best of our knowledge of available literature, this is the first charge-transfer complexation reaction for the determination of OLP using chloranilic acid.
2 Experimental
2.1 Materials and reagents
Olanzapine chemical reference substance was used for this study. Acetone, ethyl acetate, chloroform, acetonitrile, ammonium orthophosphate, orthophosphoric acid (all Analar reagent grade obtained from BDH Chemical Ltd, Poole England), chloranilic acid, methanol (HPLC grade) was obtained from Sigma-Aldrich; USA, precoated thin layer plates GF245 0.2 mm.
2.2 Equipment
A UV/VIS spectrophotometer (Unicam aurora, Pye Unicam, UK), Analytical balance H80 (Mettler, UK), Ultrasonic bath (Langford Electronics, UK), Vortex mixer (Gryphons and George Ltd; Great Britain) were used for this study.
2.3 Preparation of stock solutions
A 0.025 g quantity of chloranilic acid (CAA) powder was weighed into a clean 25 mL volumetric flask and 5 mL of acetonitrile was added to dissolve it. The solution was then made up to volume with acetonitrile to make 0.1% (w/v) chloranilic acid solution.
For the drug solution, a 0.025 g quantity of olanzapine (OLP) reference standard was weighed into a volumetric flask, 5 mL of acetonitrile was added to dissolve it and the solution was made up to volume with acetonitrile to make 0.1% (w/v) of olanzapine stock solution.
2.4 Evidence of complex formation
A 0.5 mL aliquot of CAA stock solution was added into two test tubes. 0.1 mL of OLP was added into one tube and the other tube was used as comparison standard. The immediate appearance of colour in the reaction tube was noted and then the respective colours were compared after 5 and 20 min reaction time.
Further evidence for complex formation was confirmed by thin layer chromatography using the reversed phase method. Three spots were developed, namely CAA, CAA-OLP complex and OLP alone in acetonitrile. The plates were developed in a tank using 2 solvents systems of acetonitrile/water (6:4) and methanol/water (6:4). The spotted plates were developed in a tank. The plates were then removed from the tank and viewed under UV light at 254 nm and 365 nm to view the spots generated from the development. The respective Rf (retardation factor) values were calculated.
2.5 Optimization of reaction conditions
The analytical wavelength was selected by overlaying the absorption spectra of OLP, CAA and CAA-OLP complex in acetonitrile and recording the spectra on a UV–VIS spectrophotometer from 200 to 700 nm. The appearance of a new peak in the visible region for the complex was noted by inspection and utilized for the subsequent monitoring of the complex.
The optimal temperature and time required for complex formation were determined using the method of steepest ascent [Citation19]. All the reactions were carried out using 0.5 mL CAA with 0.1 mL of OLP and the absorbance of the resulting solutions were determined at 520 nm using acetonitrile as diluting solvents. For the optimization of temperature; 30 °C, 50 °C, 60 °C and 80 °C were investigated at two time levels of 5 and 20 min. The temperature corresponding to the optimal absorbance was noted. For the optimization of time, the reaction mixtures were allowed to stand at 30 °C for 0, 2, 5, 10, 15, 20, 25 and 30 min, respectively. The reaction mixtures were made up to 5 mL with acetonitrile and the absorbance readings were determined at 520 nm using acetonitrile as the blank solvent.
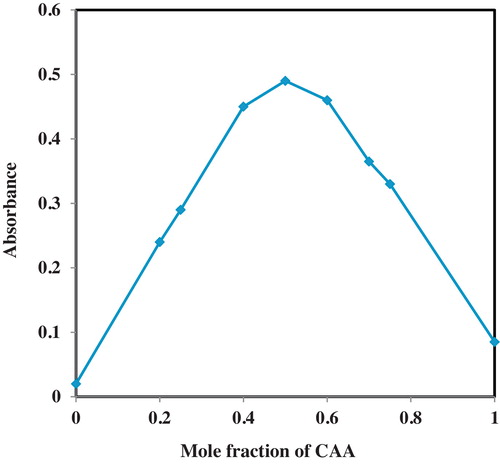
The stoichiometric ratio at which OLP combined with CAA was determined by using aliquots of 0.1% (w/v) stock solution of OLP (0, 0.25, 0.40, 0.50, 0.60, 0.75, 0.80 and 1.0 mL) representing different concentrations of (0, 50, 60, 80, 100, 120, 150, 160 and 200 μg/mL) were prepared in different test tubes and made to 1 mL with CAA solution. These mixtures represent the mole ratios of OLP and CAA of 0:1, 1:3, 2:3, 1:1, 3:2, 3:1, 4:1 and 1:0. The absorbance readings were recorded at 520 nm and the maximum absorbance was taken as the optimal stoichiometric ratio.
2.6 Validation studies
Using the optimized procedures, calibrations graphs were prepared using 0.5 mL of 0.1% (w/v) CAA solution and respective concentrations of 0, 2, 5, 10, 20, 30, 40 μg/mL of OLP. The mixture was vortex mixed and the reaction carried out at 30 °C for 10 min after which varying volumes of acetonitrile was added to make 5 mL of reaction mixture. The absorbance of each of the mixtures was then recorded at 520 nm. The calibration curves were prepared on three successive days using freshly prepared stock solution on each day. The average absorbance readings obtained from the determinations were used to generate the working calibration curve.
The accuracy and repeatability of the new charge-transfer procedure for OLP were carried out on three successive days according to current ICH guidelines [Citation20]. These were determined by using quadruplets of samples of different concentrations of OLP stock solution (0.05, 0.075 and 0.15 mL) corresponding to 10, 15 and 30 μg/mL which represents low, medium and high concentrations on the calibration curve. The reaction mixtures were processed as before and the absorbance of each of these reaction mixtures were then recorded at 520 nm using acetonitrile as the blank solvent.
2.7 Estimation of molar absorptivity and formation constants
The Benesi-Hildebrand plot [Citation21] was constructed from the calibration graphs to estimate the molar absorptivities and formation constants of the CT complexes formed between the CAA and OLP. The effects of temperature change on these parameters were studied by recording the absorbance of the CT band at elevated temperatures and calculating the molar absorptivities and formation constants from the Benesi-Hildebrand equation.
2.8 Assessment of physicochemical parameters of the charge-transfer complex
Some physicochemical properties of the charge-transfer bands were estimated such as molar transition energy, oscillator strength, transition dipole, resonance energy and the ionization potential of the donor species; in order to establish the stability or otherwise of the formed complex between OLP and CAA.
2.9 Thermodynamic studies
The free energy change, enthalpy of formation and the entropy associated with the formation of the new CT complex between CAA and OLP were estimated from the data obtained at different temperature levels of 30, 50, 60 and 80 °C.
2.10 Dosage form analysis
Three different brands of Olanzapine tablets dosage forms were analyzed. They were Olanza 10, Glenmark UK and Lanzep 10. The different brands of Olanzapine in tablet forms mentioned above were purchased from a reputable pharmacy store in Ibadan, Oyo state in Nigeria. Weight uniformity test was carried out on the different brands of tablets dosage forms and the assay of the active ingredients was then carried out based on the new method for each of the brands using the Indian Pharmacopoeial HPLC method as reference procedure [Citation22]. Weight uniformity tests were carried out on each brand of the tablets. An amount of the powdered tablets equivalent to 0.025 g of olanzapine was extracted into 25 mL of acetonitrile to make 0.1% (w/v) olanzapine stock solution.
A 0.1 mL of the stock solution equivalent to 20 μg/mL was then transferred into six test tubes for each brand. 0.5 mL of 0.1% (w/v) chloranilic acid was added to each of the test tubes. The reaction was allowed to proceed for 10 min at 30 °C after which acetonitrile was added to stop the reaction and also to make the reaction mixture up to 5 mL. The absorbance of the respective reaction mixture was recorded at 520 nm using acetonitrile as the blank solvent.
The official method of analysis utilized for olanzapine tablets was HPLC as stipulated in the 2007 edition of the Indian Pharmacopoeia [Citation22]. The test solution was prepared by adding 10 tablets of OLP into a volumetric flask, appropriate volume of acetonitrile was used to dissolve it. The mixture was then diluted with 0.01 M HCl to make a final concentration of 0.01% (w/v) OLP. A 10 mg quantity of olanzapine reference solution was dissolved in about 25 mL of acetonitrile and diluted to 100 mL with 0.01 M HCl in a volumetric flask. The content of olanzapine was calculated. Olanzapine tablets contain not less than 90.0 and not more than 110.0% of the stated amount of olanzapine.
3 Results and discussion
Olanzapine formed an immediate purple colour with chloranilic acid and the colour became more intense with time. This is an evidence of the formation of a charger-transfer (CT) complex. Chloranilic acid is a well known π-acceptor and the OLP containing amino functional groups serve as n-donors. Chloranilic acid has been used for the spectrophotometric determination of drugs containing n-electron donors such as nitrogen and oxygen. This molecular complex consists of constituents held together by weak secondary valence forces of the donor-acceptor type or hydrogen bonds. This secondary valence force is not a clearly defined bond but rather as an overall attraction between two aromatic molecules. Important factor in the formation of molecular complexes by this compound is presence of steric factors which hinders this process [Citation23]. These complexes (electron donor–acceptor complexes) may be formed when an electron donor group is adjacent to an electron acceptor group. In this situation, experimental evidences suggest that the donor may transfer a portion of its charge to the acceptor. Thus, one compound becomes partially positively charged with respect to the other and a weak electrostatic bond is formed. Bond formation between molecular pairs is brought about when filled orbitals or non-bonding orbitals in the donor molecule overlap with the depleted orbitals in the acceptor molecule.
Further evidence for the formation of a new molecular entity from the reaction between OLP and CAA (apart from the spot tests) is the TLC analysis of the reaction mixture compared with OLP and CAA alone. The results are presented in . Using reversed phase TLC mode, clearly defined spots were obtained for the three species. Using acetonitrile and methanol as the organic modifier, OLP–CAA molecular adduct had the least polarity compared to OLP and CAA alone. One other clear peculiarity observed for the reaction is the formation of single spot for the CT complex showing that one mole of the drug combined with a mole of CAA. The reversed phase TLC proved more effective at studying these reaction species because of the highly polar nature of OLP. On forming the complex with CAA the OLP–CAA adduct had the least polarity confirming the formation of a new molecular entity held together by weak secondary binding forces.
Table 1 Rf values for reversed phase thin layer chromatographic analysis.
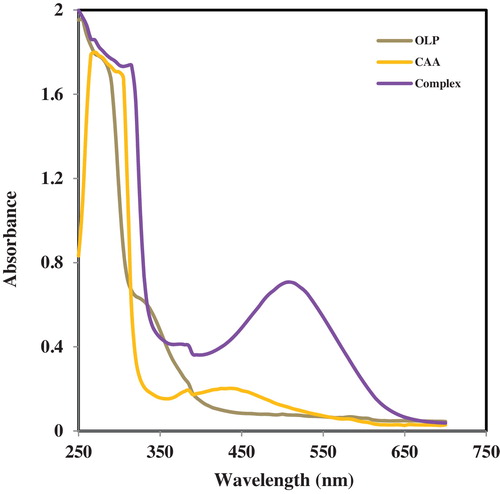
The absorption spectra of chloranilic acid and the charge-transfer complex produced with the OLP are presented overlaid with that of OLP in . The major absorption of olanzapine is around 250 nm (λmax) while CAA exhibits prominent peaks at 310 and 430 nm. However on reaction of CAA with OLP a new prominent low-energy absorption band was formed at 520 nm. This provides clear evidence for the formation of a new molecular entity. Therefore, 520 nm was selected as the working wavelength and affords the determination of the drug in the visible region to avoid non-specific absorption in the UV region. The reaction occurring leading to the formation of the new CT band is presented in . The formation of a radical anion in such molecular interactions has been established by electron-spin resonance measurements [Citation24]. The formation of a new absorption peak at 520 nm represents significant bathochromic shift relative to the absorption bands of both CAA and OLP. Olanzapine contains a secondary amine site in the diazepine ring and charge-transfer donors have been recognized to be predominantly primary or secondary amino groups in addition to oxygen derivatives. The avidity of formation of the new CT complex may be due to increased stabilization of the charge transfer by the extensive chromophoric systems in olanzapine.
Fig. 2 Absorption of spectra of the charge-transfer complexation between olanzapine and chloranilic acid overlaid on chloranilic acid.
3.1 Optimization studies
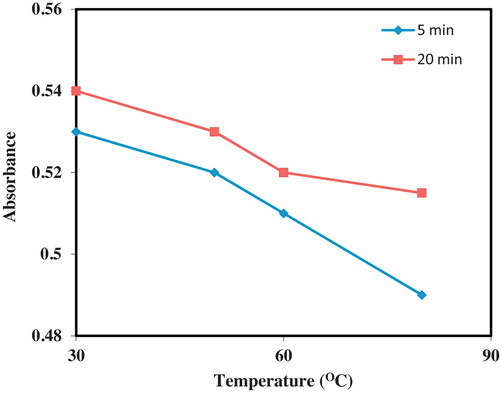
Two key factors that can affect the rate and extent of formation of the charge-transfer complex were identified as temperature and time. These two factors were studied and optimized. The optimization of temperature for the formation of the CT complex between CAA and OLP is presented in . Two time levels were studied at temperatures of 30, 50, 60 and 80 °C. Using 5 and 20 min reaction time periods; CAA was found to optimally combine with OLP at room temperature in both instances. There was a gradual decline in the absorptivity of the molecular complex as the temperature increased from 30 to 80 °C. This decrease was found to be more apparent at 20 min reaction time. This decrease in absorptivity was characterized by the gradual discharge of the purple colours produced with CAA at elevated temperatures with increasing incubation times. This dis-stabilization of molecular charge transfer is typical of most CT complexes as increase in temperature destroys the intermolecular binding forces of attraction between ion pairs. It is often observed that since weak intermolecular secondary binding forces are responsible for the formation of a CT band, then increase in temperature can lead to distortion of such binding interactions. Thus, 30 °C was selected as the optimum time required for the formation of the CT complex between CAA and OLP. In some of our previous utilization of CAA as charge-transfer acceptor, room temperature analyses have been afforded and elevated temperatures were observed to destroy the formed complexes [Citation25–Citation28].
Fig. 3 Optimization of temperature for the charge-transfer complexation between OLP and CAA.
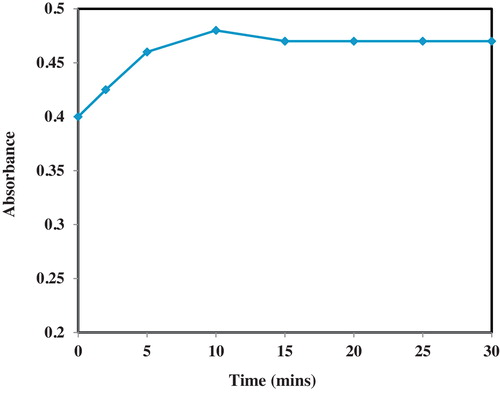
The effect of time allowed for reaction between OLP and CAA at 30 °C was monitored at time levels ranging from 0 to 30 min. The results are presented in . From the results obtained, the absorbance value for the complex increased steadily from 0 min to a peak at 10 min. Thereafter, further incubation beyond 10 min led to a gradual decline in the absorbance value. Thus, 30 °C and 10 min reaction conditions were selected as optimal conditions for the charge-transfer complexation reaction between OLP and CAA. A critical look at the effect of time presented in shows that only a slight reduction in the absorbance of the CT complex was obtained beyond 10 min (2.08% decrease). This thus suggests the suitability and stability of the analytical system for the assay of OLP by this CAA method.
Fig. 4 Effect of time of reaction on complex formation at 30 °C.
The concentration of CAA used as reagent in this study as well as the adoption of acetonitrile as diluting solvent stems from other previous experiences and applications with the utilization of CAA [Citation25–Citation28].
Following the optimization of the temperature and time required for the analysis of OLP by the CAA method, the stoichiometric ratio at which the two reactants were combining was investigated using Job's method of continuous variation [Citation29]. The results obtained for the stoichiometric ratio assessment is presented in . For interacting species at a constant total concentration, the complex (adduct) is at its greatest concentration at a point where the species are combined in the ratio in which they occur in the complex [Citation30]. The plot of absorbance against the mole fraction of the reagent exhibited a change of slope with a maximum absorbance at a mole fraction of 0.5 and decreasing absorbance as the value of the mole fraction deviates from 0.5. The implication of this observation is that combining equal volumes of equimolar concentrations of the reagent and drug stock solution will produce the highest possible absorbance reading. It also signifies that the OLP and CAA reagent react in a 1:1 stoichiometric ratio under the optimal conditions routinely used for the charge-transfer complexation reaction.
Fig. 5 Stoichiometric ratio determination for the reaction between CAA and OLP.
3.2 Validation studies
Calibration curves were prepared using the optimized procedures and the results of the analytical and validation parameters are presented in for the OLP–CAA molecular complex. Excellent calibration data were obtained for the average determinations of the calibration curves constructed on each of three successive days. The linear regression line equation is Y = 0.00514X + 0.05793 with a correlation coefficient of 0.9977. The slope and intercept of the calibration lines gave small 95% confidence limits thus adjudging the suitability of the procedure to detect small changes in the concentration of olanzapine. The Beer's law range is 2–40 μg mL−1 and a molar absorptivity of the range 2.302 ± 0.262 × 10³. The sensitivity of the procedure was assessed using Sandell's sensitivity and it was found to be 0.195 μg mL−1 per 0.001 absorbance unit.
Table 2 Analytical and validation parameters for the CT complexes of OLP with CAA.
The limit of detection (LOD) and limit of quantitation (LOQ) were estimated according to the current ICH guidelines using the expressions 3.3σ/S and 10σ/S, respectively where, σ is the standard deviation of the absorbance of blank (n = 6) and S is the slope of the calibration line. The LOD and LOQ were respectively found to be 1.57 and 4.77 μg mL−1. These low limits were found to compare favourably with previously reported methods for olanzapine.
Using the optimized systems and calibration curves, the recovery studies of OLP from quality control samples were carried out for accuracy and precision of a three-day assessment period. The results of the 3-day assessment are presented in . For the intra-day assessment, accuracy (estimated by % relative errors) were generally less than 1% for the three concentration levels of 5, 15 and 30 representing the low, mid and high concentration point on the calibration plot as recommended by the ICH. The intra-day precision using % relative standard deviation gave values also far less than 1%. From the assessment, it was discovered that both the precision and accuracy were better for higher concentrations than the lowest concentration level. This is expected, as it is a lot easier to handle the larger concentration volumes. also contains the results of the inter-day assessments of accuracy and precision at the concentration levels adopted for the intra-day assessments. In all instances, low inaccuracies and low % RSD were obtained. These results once again justify the suitability of the CAA system for the assay of olanzapine.
Table 3 Intra-day and inter-day accuracy and precision of the charge-transfer complexation method.
3.3 Estimation of molar absorptivity and formation constants
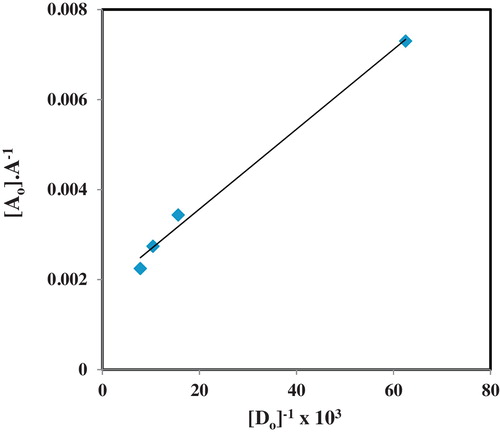
The absorbance values obtained in the calibration curve plot were plotted as a function of ratio of the molar concentration of the donor:acceptor ([D]0:[A]0) according to the Benesi-Hildebrand equation [Citation21] using the expression in Eq. Equation(1)(1)
(1) .
(1)
(1) where [A]0 is the initial concentration of the acceptor (CAA), A is the absorbance of the charge-transfer band, [D]0 is the initial concentration of the donor (olanzapine), KCT is the formation constant of the new charge-transfer band and ɛCT is the molar absorptivity. A plot of [A]0/A against 1/[D]0 will yield intercept as 1/ɛ and the slope as 1/K ɛ from where the formation constant and the molar absorptivity are obtained. The concentration of the acceptor was kept greater than the donor and fixed so that a wide concentration range could be adopted. The Benesi-Hildebrand plot is presented in . Relatively higher molar absorptivities and formation constants were observed for the studied complexes at room temperature relative to the values determined at higher temperature levels. Marginal differences were however observed for these parameters at temperatures of 50, 60 and 80 °C, with a gradual decline in the parameters were obtained. Although the molar absorptivities are supposed to be independent of temperature, empirically this has been found not to hold true. This is because increase in temperature has been found to affect molecular complexes. Since the formation of a charge-transfer complex is an association of some type, and probably an association existing in equilibrium, any factor that will promote dissociation of the complex will lead to reduced absorptivity.
Fig. 6 Benesi-Hildebrand plot for the charge-transfer complexation.
Temperature is one of such factors that can lead to breakdown of the formed complex especially if such formation is associated with an exothermic change and this will lead to the equilibrium shifting towards the free donor and acceptor species which do not have significant absorbance values at the 520 nm used as analytical wavelength [Citation26]. These observations are particularly evident for the current case at hand as the absorption spectra showed no significant absorptivities for the free OLP and CAA at 520 nm. And in addition, the optimization of coupling reaction temperature revealed that increasing the temperatures from 30 to 80 °C also produced decreasing absorptivities. Since estimation of both the molar absorptivities and formation constants depend on the absorbance values, the trend observed in is anticipated. Thus expectedly, the complexes were determined at room temperature. This study involving estimation of molar absorptivities and formation constants as a function of temperature further lends credence to the understanding that molecular associations are affected by diverse properties of reactants and reaction conditions such as concentration, chemical structure, temperature and time. The OLP–CAA system described in this work provides a clear model for the study of the influence of these factors.
Table 4 Physicochemical parameters for the formation of CT-complex between olanzapine and chloranilic acid.
3.4 Physicochemical parameters for the formation of CT-complex
In order to characterize the complex formed between olanzapine and the charge acceptor molecule, CAA; some physicochemical parameters were estimated to explain the propensity or otherwise of the formation of the intermolecular charge-transfer complex. The various physicochemical parameters obtained are summarized in .
The first physicochemical parameter calculated was the transition energy of the complex which is obtained from the expression hνCT where h is Planck's constant and νCT is the wavenumber of the absorption peak of the CT complex. The transition energy was found to be 2.303 eV.
Two other physicochemical parameters estimated were oscillator strength and transition dipole moment. The oscillator strength (f) is a dimensionless quantity used to express the transition probability of the CT band and the transition dipole moment (μEN) of the CT complex [Citation30]. Both parameters are obtained from Eqs. Equation(2)(2)
(2) and Equation(3)
(3)
(3) , respectively.
(2)
(2)
(3)
(3) where Δν1/2 is the half-width, i.e. the width of the band at the half the maximum absorption, and Δν ≈ wavenumber at the absorption maximum. The oscillator strength, f and the transition dipole moment obtained are 7.289 and 0.892 Debye, respectively.
The ionization potential, ID, of the donor in the charge-transfer complex was another physicochemical parameter calculated using the empirical equation derived by Aloisi and Pigantro in 1973 [Citation31] (presented in equation 4).(4)
(4) where νCT is the wavenumber of the CT band in cm−1. ID was found to be 6.054 eV.
The resonance energy of the complex (RN) in the ground state is obtained from the theoretical equation derived by Brieglieb [Citation32] given in Eq. Equation(5)(5)
(5) .
(5)
(5) where ɛCT is the molar absorptivity of the complex at the maximum of the CT absorption, hνCT is the transition energy of the complex. The resonance energy was calculated as 4.687 eV for the new molecular complex.
The dissociation energy (W) of the formed CT complex between OLP and CAA was calculated from the transition energy (hνCT), ionization potential of the donor (ID) and the electron affinity of CAA (EA = 1.1) using the relationship in Eq. Equation(6)(6)
(6) [Citation33].
(6)
(6)
The dissociation energy was found to be 2.651 eV.
From the results presented in , some observable trends are clearly evident from these physicochemical parameters. The values obtained points to the good stability of the complex formed between CAA as acceptor and olanzapine as donor. The ionization potential of the donor gave a high value of 6.054 eV denoting that OLP is a good n-electron donor and making the electrons readily available for donation to an acceptor such as CAA. This is not surprising as nitrogen atom whether as a primary, secondary or tertiary amino group happen to be one of the best electron donors in charge-transfer complexation reactions and most of the previously reported procedures involving CAA have been successfully carried out when the donor functional group contains nitrogen. The secondary amino group found in olanzapine has proven to be a useful electron donor from the results of the ID obtained. The transition energy is about two times less than this ionization energy of OLP, hence, the energy barrier required for electronic transition is readily surmounted and the complex is produced readily. This further confirms the avidity at which the complex was produced. The dissociation energy (W) was also found to be far less than ID. Thus the spontaneous decomposition of the CT complex will be minimal especially at room temperature where these values were obtained from. This is further confirmed by the fact that gradual decomposition of the complex was only observed at elevated temperatures. The high resonance energy of the formed complex will produce a stabilization effect on the complex and this is expected considering the bulky nature of OLP and the tendency to be stable upon donation of a lone pair electron to CAA.
The estimation of these physiochemical parameters has given a good clue to the relative stability of the intermolecular complex formed between olanzapine and CAA at room temperature.
3.5 Thermodynamic considerations of the charge-transfer complexation reaction
The thermodynamic functions, standard free energy change (ΔG°) the enthalpy change (ΔH) and the entropy change (ΔS) were obtained from the well established Eqs. (7)–(9), respectively.(7)
(7)
(8)
(8)
(9)
(9)
The enthalpy of the CT formation was obtained by plotting the log of formation constant against the reciprocal of absolute temperature. The plot is presented in . contains the various thermodynamic parameters obtained, alongside the molar absorptivities and formation constants at the four temperature levels. The standard free energy gave a negative value at all the four temperature conditions considered in this experimental design. This result points to the exothermic nature of the complex formation. This thus explains why higher temperature values led to decrease in the absorbance of the complex. The Gibbs free energy became increasingly higher with increase in temperature denoting that it becomes difficult to generate the complex at higher temperatures. Since it is established that the formation of the complex occurs through an exothermic process, higher temperature will prevent the avidity of reaction and the spontaneity of the charge-transfer complexation. The high Gibbs free energy obtained even at room temperature however attests to the ease of formation of the complex. Though relatively small, the enthalpy change also points to the possibilities of ease of formation of the CT complexes. The enthalpy of formation for the molecular complex was found to be −0.8803 kJ mol−1. The entropy also gave relatively high values with the value reducing as temperature increased. A gradual decline in the entropy with temperature increase was observed for the formation of intermolecular charge-transfer complexation. This implies a lower degree of randomness as a function of temperature and lower tendencies of forming stable complexes. All the thermodynamic parameters estimated however suggest that the complexes are relatively stable at room temperature compared to the elevated temperatures.
Fig. 7 Plot of log K of OLP–CAA complexes as a function of 1/T (K−1).
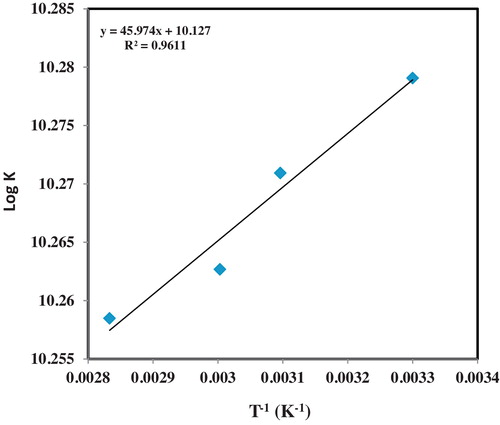
Table 5 Thermodynamic changes following complexation between olanzapine and chloranilic acid.
3.6 Proposed reaction mechanism
The proposed reaction mechanism is presented in . In this study, the chloranilic acid molecule in the reaction mixture induces its own delocalization of electrons due to dipole moment that exist between the carbon and oxygen atoms of the carbonyl group in the molecule of chloranilic acid (C=O; Cð+–Oð−), [step a]. Also in the reaction mixture, the lone pair of the electrons on the nitrogen atoms of the amine group in the olanzapine molecule (H2N:) are available for the chloranilic molecule (electron deficient) [step b], resulting in the formation of complex [step c]. Such reactions are usually avidly possible in solvents that promote electron transfers as acetonitrile and 1,4-dioxan.
Scheme 1 Formation of charge-transfer complexation between olanzapine and chloranilic acid.
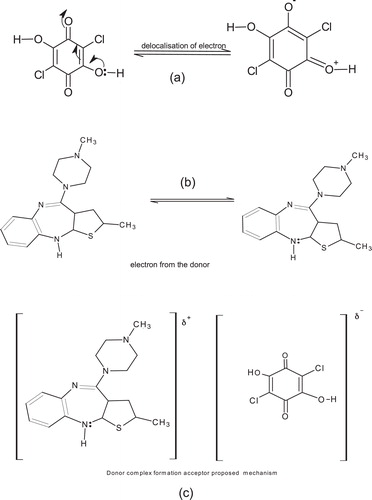
Since the formation of this complex involves electronic transition from olanzapine an electron rich molecule (Lewis-base donor) to an electron deficient (chloranilic acid) molecule (Lewis-acid acceptor), they are called charge-transfer complexes. The bond formation between the molecular pairs is brought about when non-bonding orbital in the donor, olanzapine overlaps with the depleted orbital in the acceptor chloranilic acid. The lower energy molecular orbital (MO) for the complex is occupied in the ground state, and transitions from this molecular orbital (MO) in the ground state to new absorption bands.
3.7 Dosage form analysis
The new procedure was adopted for the estimation of the content of OLP in three commonly available tablet brands in Ibadan metropolis where this study was conducted. The results obtained (using the CAA method) were compared with those obtained using the official Indian Pharmacopoeial method. The results for the comparative dosage form analysis using the new method and official HPLC method are presented in . All the three brands analyzed passed and there were no significant differences in the content of OLP in the tablet brands when assessed by the new method and the official HPLC method. This shows that both methods are equivalent.
Table 6 Comparative dosage form analysis using the new method and official HPLC method.
3.8 Comparative advantages of the new charge-transfer methodology
One clear-cut advantage of the new charge-transfer method developed and validated for the assay of olanzapine using chloranilic acid as described in this work is the single step involved in the adoption of the method. Many of the previously reported spectrophotometric techniques utilize multistep procedures with the attendant compromise of accuracy. In addition the new method is simple, accurate and precise and utilized well known and readily available reagents. It is also a room temperature analysis and can be utilized without stringent control of many environmental factors. It is the first reported of such charge-transfer reactions and holds promise of adaptation in any analytical setting.
4 Conclusion
A new colorimetric method for the assessment and quality control of olanzapine in bulk and dosage forms has been successfully developed. The method holds promise as a simple, fast and accurate technique for the in-process and post-marketing surveillance of the drug especially judging from the standpoint of the variety of generic brands of olanzapine currently available in the market.
Notes
Peer review under responsibility of Taibah University
References
- K.S.RubeshP.GayathriN.DuganathC.H.KiranC.SridharK.JayaveeraSimultaneous estimation of fluoxetine HCl and olanzapine in bulk drug and pharmaceutical formulation by using UV-visible spectroscopy methodInt. J. Pharm. Sci. Drug Res.320115255
- European Medicines AgencyPre-authorisation Evaluation of Medicines for Human Use. Assessment Report for Zypadhera (International Nonproprietary Name: olanzapine).2008
- D.ConcettaM.GaetanaS.VincenzaS.EdoardoDetermination of olanzapine in human plasma by reversed-phase high-performance liquid chromatography with ultraviolet detectionTher. Drug Monit.282006388393
- M.A.RaggiG.CasamentiR.MandrioliG.IzzoE.KenndlerQuantitation of olanzapine in tablets by HPLC, CZE, derivative spectrometry and linear voltammetryJ. Pharm. Biomed. Anal.232000973981
- O.V.OlesenK.LinnetDetermination of olanzapine in serum by high-performance liquid chromatography using ultraviolet detection considering the easy oxidability of the compound and the presence of other psychotropic drugsJ. Chromatogr. B7141998309315
- S.C.KasperE.L.MattiuzS.P.SwansoJ.A.ChiuJ.T.JohnsonC.O.GarnerDetermination of olanzapine in human breast milk by high performance liquid chromatography with electrochemical detectionJ. Chromatogr. B7261999203209
- M.A.SaracinoO.GandolfR.O.Dall’OlioL.AlbersE.KenndlerM.A.RaggiDetermination of Olanzapine in rat brain using liquid chromatography with coulometric detection and a rapid solid-phase extraction procedureJ. Chromatogr. A112220062127
- S.UlrichAssay of olanzapine in human plasma by a rapid and sensitive gas chromatography-nitrogen phosphorus selective detection (GC-NPD) method: validation and comparison with high-performance liquid chromatography-coulometric detectionTher. Drug Monit.272005463468
- C.VanceM.LainPost-mortem tissue concentration of olanzapineJ. Anal. Toxicol.33200915
- K.BasavaiahN.RajendraprasadK.B.VinayMicrotitrimetric determination of drug content of pharmaceuticals containing olanzapine in non-aqueous mediumCICEQ1520097781
- A.JasinskaE.NalewajkoBatch and flow injection methods for the spectrophotometric determination of olanzapineAnal. Chim. Acta5082004165170
- A.KrebsB.StarczewskaH.Puzanowsha-TarasiewiczJ.SledzSpectrophotometric determination of olanzapine by its oxidation with N-bromosuccinimide and cerium (IV) sulphateAnal. Sci.222006829833
- A.A.MohamedKinetic and maximum absorbance spectrophotometric methods for the determination of olanzapineMonatsh Chem.139200810051010
- H.D.RevanasiddappaM.A.VeenaHighly sensitive spectrophotometric methods for the determination of olanzapineEclet. Quim.3320084752
- R.NagarajuB.KanakapuraT.KalsangB.K.VinayQuantitative determination of olanzapine in tablets with visible spectrophotometry using cerium(IV) sulphate and based on redox and complexation reactionsEurasian J. Anal. Chem.42009191203
- K.BasavaiahK.TharpaN.RajendraprasadS.G.HiriyannaK.B.VinaySpectrophotometric determination of antipsychotic drug olanzapine in pharmaceuticalsJordan J. Chem.420096576
- A.A.ElbashirA.A.AhmedS.M.A.AhmedH.Y.Aboul-Enein1,2-Naphthoquinone-4-sulphonic acid sodium salt (NQS) as an analytical reagent for the determination pharmaceutical amine by spectrophotometryAppl. Spectrosc. Rev.472012219232
- O.A.AdegokeO.E.ThomasD.M.MakanjuolaO.O.AdewoleSpectrophotometric determination of olanzapine following condensation reaction with p-dimethylaminobenzaldehydeJ. Taibah Univ. Sci.82014248257
- H.T.KarnesC.March Precisionaccuracy and data acceptance criteria in biopharmaceutical analysisPharm. Res.10199314201426
- ICH Guidelines Q2(R1), Validation of Analytical Procedures: Text and Methodology, http://www.ich.org/fileadmin/Public_Web_Site/ICH_Products/Guidelines/Quality/Q2_R1/Step4/Q2_R1__Guideline.pdf (Date accessed 20 June 2014).
- H.A.BenesiJ.H.HildebrandSpectrophotometric investigation of the interaction of iodine with aromatic hydrocarbonsJ. Am. Chem. Soc.71194927032707
- Indian Pharmacopoeia2007Controller of Publications, Ministry of Health and Family Welfare Government of IndiaNew Delhi857858
- M.AlfredS.JamesC.ArthurA.H.C.ChunPhysical Pharmacy: Physical Chemical Principles in the Pharmaceutical Sciences3rd ed.1993Lea and FebigerPhiladelphia, USA319320
- M.Abdel-SalamA.S.IssaM.MahrousM.E.Abdel-Hamid.Spectrophotometric determination of some tranquillizers and antidepressants using 2,3-dichloro 5,6-dicyano-p-benzoquinoneAnal. Lett.18198513911403
- O.A.AdegokeO.E.UmohJ.O.SoyinkaSpectrophotometric determination of metronidazole and tinidazole via charge transfer complexation using chloranilic acidJ. Iran. Chem. Soc.72010359370
- O.A.AdegokeSpectrophotometric and thermodynamic studies of the charge transfer complexation of nitroimidazoles with chloranilic acid following metal hydride reductionAfr. J. Pure Appl. Chem.52011255264
- O.A.AdegokeC.P.BabalolaP.O.K.IsaacO.A.KotilaSpectrophotometric studies of the charge-transfer complexation between lumefantrine and chloranilic acid in acetonitrileActa Pharm. Sci.532011135149
- O.A.AdegokeC.P.BabalolaO.A.KotilaO.ObuebhorSimultaneous spectrophotometric determination of trimethoprim and sulphamethoxazole following charge-transfer complexation with chloranilic acidArab. J. Chem.201410.1016/j.arabjc.2014.05.022
- J.RoseAdvanced Physicochemical Experiments1964PitmanLondon54
- A.J.MartinA.SwarbrickCammarata In Physical Pharmacy: Physical Chemical Principles in the Pharmaceutical Sciences3rd ed.1983Lea & FebigerPhiladelphia, PA325326H.TsubomuraR.LangMolecular complexes and their spectra, XIII. Complexes of iodine with amides, diethyl sulphide and diethyl disulfidesJ. Am. Chem. Soc.83196120852092
- G.AloisiS.PignatoroMolecular complexes of substituted thiophenes with σ and π acceptorsJ. Chem. Soc. Faraday Trans. 1691973534
- G.BriegliebElektron-Donator-Acceptor Komplexe1961SpringerBerlin
- H.M.McConnelJ.J.HamJ.R.PlattRegularities in the spectra of molecular complexesJ. Chem. Phys.2119536670