
 ?Mathematical formulae have been encoded as MathML and are displayed in this HTML version using MathJax in order to improve their display. Uncheck the box to turn MathJax off. This feature requires Javascript. Click on a formula to zoom.
Abstract
This study developed a GIS-based multivariate regression (MVR) yield rate prediction model of groundwater resource sustainability in the hard-rock geology terrain of southwestern Nigeria. This model can economically manage the aquifer yield rate potential predictions that are often overlooked in groundwater resources development. The proposed model relates the borehole yield rate inventory of the area to geoelectrically derived parameters. Three sets of borehole yield rate conditioning geoelectrically derived parameters—aquifer unit resistivity (ρ), aquifer unit thickness (D) and coefficient of anisotropy (λ)—were determined from the acquired and interpreted geophysical data. The extracted borehole yield rate values and the geoelectrically derived parameter values were regressed to develop the MVR relationship model by applying linear regression and GIS techniques. The sensitivity analysis results of the MVR model evaluated at P ⩽ 0.05 for the predictors ρ, D and λ provided values of 2.68 × 10−05, 2 × 10−02 and 2.09 × 10−06, respectively. The accuracy and predictive power tests conducted on the MVR model using the Theil inequality coefficient measurement approach, coupled with the sensitivity analysis results, confirmed the model yield rate estimation and prediction capability. The MVR borehole yield prediction model estimates were processed in a GIS environment to model an aquifer yield potential prediction map of the area. The information on the prediction map can serve as a scientific basis for predicting aquifer yield potential rates relevant in groundwater resources sustainability management. The developed MVR borehole yield rate prediction mode provides a good alternative to other methods used for this purpose.
1 Introduction
The need for successful planning and management of groundwater exploration in the field of groundwater hydrology for both local and regional groundwater productivity potential mapping cannot be underestimated [Citation1,Citation2]. Nonetheless, existing literature has established that the success of area groundwater productivity potential assessment is largely based on the availability of well yield rate parameters [Citation3,Citation4]. The uniqueness of this parameter as a good, albeit indirect, indicator of groundwater occurrence in an area has been documented in the studies of [Citation5–Citation7]. A provisional means of assessing borehole yield information either locally or regionally is necessary to prevent the mismanagement of this invaluable but non-renewable natural resource, as this information can safeguard the sustainability of groundwater resources by avoiding saline intrusion, encrustation, borehole failures, and the excess lowering of water tables or piezometric surfaces. Consequently, the modelling of an aquifer yield potential rating through a simple and accurate mathematical technique can complement the conventional borehole pumping test (BPT) approach. This is necessary for enhancing the optimisation of groundwater resources that can provide portable water resources to address the challenges of scarce water supplies that threaten the entire world. The growing reliance on groundwater resources stem from unique attributes such as constant temperature, excellent quality, and low vulnerability to pollution and catastrophic events compared to surface water. Moreover, driving factors in various indispensable areas of human economic activity such as irrigation services and industrial utilisation often provide the basis for a nation to increase the availability of groundwater resources [Citation8,Citation9]. Therefore, the concept of enhancing the sustainability of groundwater resources through regional borehole yield rate assessment is timely and necessary.
The conventional approach of assessing borehole yield rate utilises a borehole pumping test (BPT) technique. This approach also provides information such as transmissivity, storability, aquifer geometry, and hydraulic conductivity properties that is useful when hydrogeologists are required to make accurate decisions concerning aquifers [Citation10]. Ultimately, the evaluation of an aquifer's yield potential rate for the purpose of successful groundwater resource development can be best assessed by the BPT technique. However, the BPT approach is laborious, costly, uneconomical and time consuming [Citation11–Citation14]. In addition, the BPT output application is highly localised, thus limiting any regional evaluation of an area aquifer potential yield rating where there are no boreholes in existence. To gain better insight into regional subsurface aquifer potential yield ratings, which can be particularly useful in hard-rock terrains where the locations of groundwater reservoirs (aquifers) are varied and discontinuous, this study proposes a simpler and regionally compliant aquifer yield potential evaluation technique that can address the deficiencies of the BPT approach.
This study develops a GIS-based multivariate regression borehole yield prediction model. The approach employs empirical modelling that can accommodate the simultaneous integration of multiple factors for estimating an aquifer yield potential rating index. The efficiency of regression-based techniques in determining borehole yields from relevant borehole yield conditioning parameters obtained from different sources was established by [Citation15,Citation16]; these studies found that the well yield parameter was strongly correlated with well yield conditioning factors. Other studies [Citation16–Citation18] identified some of those well yield conditioning factors as hole depth, drawdown, screen length, geoelectrical parameters and geological rock formations. However, the regional applicability of this proposed regression model efficiency was carried out through a GIS technique application. The potential of GIS techniques has been explored in numerous environmental decision-making studies with encouraging results, including the management of natural resources—particularly in groundwater potential prediction domains [Citation3,Citation14,Citation19]. Employing the proposed GIS-based MVR yield prediction model can significantly enhance the prediction of the potential yield of underlying groundwater reservoirs (aquifer units) where drilled holes are lacking. The proposed aquifer yield rating potential model output could optimise the sustainability of underlying groundwater resources.
This paper develops a GIS-based multiple variate regression (MVR) yield prediction model for predicting aquifer yield potential on a regional scale. This study introduces the use of derived parameters from geoelectric surveys obtained from an electrical resistivity (ER) prospecting method and applies linear regression and a GIS technique to develop the MVR yield prediction model. The ER method has widely been used for the quantitative estimation of the water transmitting properties of aquifers, aquifer zone delineation and the evaluation of the geophysical properties of aquifer zones in several locations [Citation20–Citation28]. Moreover, the ER method possesses non-invasive, low-cost attributes and offers quick data acquisition and the ability to map geological layers and determine the nature and composition of unseen subsurface formations [Citation29,Citation30]. The unique attributes of the ER method are well exploited in the proposed GIS-based MVR yield model and enable the model to surpass the conventional BPT technique. Applying the developed GIS-based MVR yield model in an area can provide aquifer yield potential rate prediction on a regional scale. The methodologies are illustrated by using a case study in the Crystalline Basement Complex terrain in southwestern Nigeria to establish a robust hydrological database system for continued effective groundwater resources management in the area.
2 Materials and methods
2.1 Geography, hydrology, and hydrogeology of the study area
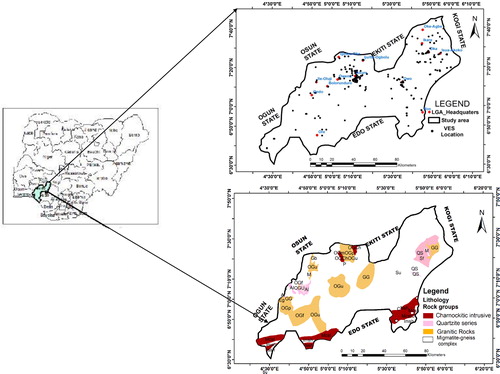
The study area, as depicted in , is located in the northern part of Ondo state, southwestern Nigeria. It lies between the latitudes of 6°40′00″ and 7°45′00″ N and the longitudes of 4°20′00″ and 6°05′00″ E and contains 14 local government areas. The area is bounded to the east by Edo and Delta states, to the west by Ogun and Osun States, and to the north by Ekiti and Kogi States. The topography varies from moderate to high elevation values ranging from 200 m to 250 m. The area lies in a tropical rain forest with mean annual rainfall of approximately 1300 mm. The annual mean monthly temperature ranges from 6 °C to 33 °C. According to [Citation31–Citation33], the underlying regional geology generally contains rocks of the Precambrian Basement Complex of Nigeria. However, the typical petrology units recognised in the study area include granitic rocks (granite gneiss, med-coarse-grained biotite granite, fine-grained biotite granite, undifferentiated older granite, quartzo-feldspathic gneiss, coarse porphyritic biotite), migmatite-gneiss complex (migmatite, megmatite, undifferentiated schist), charnockitic meta-intrusive (charnockitic rocks) and quartzite series (fine-grained quartzite and schist quartz schist) (). These rocks, because of their peculiar complex crystalline basement characteristics, are generally characterised with low porosity and negligible permeability. However, where they are concealed both locally and regionally, these rocks may contain highly faulted and tightly folded areas, incipient joints and fracture systems derived from multiple tectonic events that can result in the development of secondary porosity. According to [Citation34–Citation36], these aforementioned geologic structures are localised and discontinuous. These geologic/structural features can significantly enhance the recharge rate of an underlying groundwater reservoir (aquifer unit).
Fig. 1 The study area map both the VES location, the geologic rock types map with inset map of Nigeria.
3 Methodology
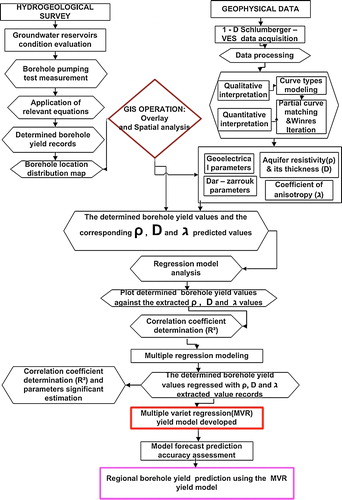
presents an overview of the approach that was applied for the regional assessment of the aquifer unit potential yield prediction mapping in the study area. The adopted methodological concept is multidisciplinary and divided into five phases. (1) The hydrogeological survey phase entails borehole yield rating extraction from the existing borehole database. (2) The hydrogeophysical phase involves geophysical data acquisition, processing and interpretations to determine both primary and secondary geoelectrical parameters. The GIS operation phase (3) of the study addresses overlaying and spatial modelling analyses. The inputs for this third phase derive from the results from the first and second phases. (4) The multiple variate regression (MVR) modelling approach utilises a linear regression technique and statistical software applications. The combined outputs of phase 2–4 constitute phase (5), which results in the modelling of regional borehole yield rate estimation and prediction in the study area. The details of the aforementioned phases (1)–(5) are highlighted below.
Fig. 2 The flowchart of the adopted methodology for the study.
3.1 The hydrogeological survey phase
An inventory of drilled boreholes was surveyed for the purpose of hydrogeological investigation. The inventory map of the boreholes drilled in the area is shown in ; based on these borehole data, the hydrogeological condition of the area was analysed. The borehole pumping test technique was employed for the quantitative appraisement of each drilled hole and their yield ratings were determined. The adopted procedures of the borehole pumping test (BPT) technique were similar to those documented in [Citation37]. The unpublished technical BPT report containing the details of the well drawdown level, the pumping duration, the rate, etc. is catalogued by Nigerian State water board agencies (WATSAN) and the Benin Development Authority, a parastatal Federal Ministry of water resources. The summary of the borehole yield rate records extracted from the existing BPT database in the area is presented in .
Fig. 3 The borehole distribution inventory map of the area.
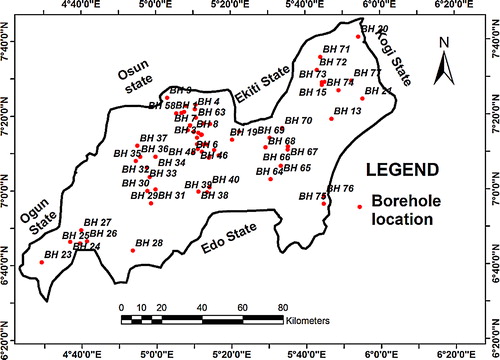
Table 1 Borehole yield rating inventory records of the area.
3.2 The geoelectrical method data acquisition approach
A one-dimensional vertical electrical resistivity sounding (VES) survey was carried out at 450 locations () using a Schlumberger electrode configuration. The apparent resistivity values of the underlying soil formation were measured using an ABEM Terrameter (SAS 1000/4000 series). The electrode current spread length (AB) for the adopted Schlumberger array was varied between 2 and 200 m, whereas the spacing between the potential electrodes (MN) was intermittently varied between 0.5 m and 10 m to achieve suitable current penetration and a depth of investigation that will enable proper delineation of the subsurface lithological sequence to achieve a reliable estimate of aquifer parameters. The coordinates at each VES station were recorded with a Garmin handheld GPS device.
3.2.1 Data processing and interpretation technique
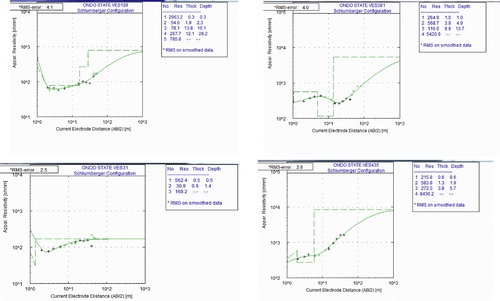
The acquired vertical electrical soundings data were processed by plotting the measured apparent resistivity values against half-current electrode spacing (AB/2) at each station on log-log graph sheets to generate the resistivity model curve. The typical resistivity model curves obtained based on the underlying geologic units in the area are shown in . The field curve types were further quantitatively interpreted using the conventional partial curve matching technique utilising the master curves and the corresponding auxiliary curves for the subsurface layer resistivity and thickness value determination. The estimated model parameters (layer resistivity values and thicknesses) were enhanced through computer iterations using a Win-Resist program. The outputs of both the qualitative and quantitative interpretations of the Schlumberger-VES data are called the geoelectrical parameters. The determined geoelectrical parameters were further grouped into two classes, namely the primary and secondary classes (see ). The estimated layer resistivity (ρ) and layer thickness (D) comprise the primary class; the secondary class parameter is the coefficient of anisotropy (λ). The coefficient of anisotropy (λ) parameter is computed from the layer resistivity (ρ) and layer thickness (D) by applying the Dar–Zarrouk relationships documented in [Citation38]. The λ is described as the ratio of the total transverse resistivity (ρt) to the total longitudinal resistivity (ρL) as expressed in Eq. Equation(1)(1)
(1) , where ρt is defined as the ratio of the total transverse resistance (T) to the total thickness of the layers (H), i.e., T/H, whereas ρL is defined as the fraction of total thickness of the layers (H) with the longitudinal conductance (S), i.e., H/S [Citation39]. The substitution of ρt = T/H and ρL = H/S in Eq. Equation(1)
(1)
(1) creates Eq. Equation(2)
(2)
(2) .
(1)
(1)
(2)
(2)
Fig. 4 Typical resistivity model curves obtained in the area.
3.2.2 The geoelectrically derived borehole yield potential conditioning parameters mapped with GIS approach
Hydrogeologically speaking, the measures of an area's well yield rate largely depend on the degree of aquifer productivity. By exploiting the aforementioned uniqueness of the ER geophysical prospecting method in Section 1, the delineation of the aquifer layer in the subsurface can be effectively mapped [Citation40,Citation41]. Thus, in situ aquifer physical factors such as aquifer layer resistivity (ρ), aquifer layer thickness (D) and coefficient of anisotropy (λ) can be determined based on the delineated aquifer layer by using the interpreted geophysical results ( and ). According to [Citation3,Citation36,Citation42], the aquifer resistivity and its thickness parameters are vital factors for assessing the groundwater potential in an area. However, the coefficient of anisotropy (λ) has been established to be linearly correlated with groundwater yield in an area [Citation43]. Contrary to [Citation19], the determined aquifer resistivity, its thickness and the coefficient of anisotropy parameters are considered as the borehole yield conditioning factors in the study area. The determined geoelectrical parameter (primary and secondary) values characterising the delineated aquifer layer at each VES location and the measured coordinates are presented in . Based on overlaying and spatial analysis, the determined aquifer parameter values (ρ, D and λ) referenced to each VES location are finally processed in a GIS environment in order to map the geoelectrically derived borehole yield potential conditioning parameter maps for the area (a–c).
Fig. 5 Borehole yield conditioning factors used in developing the multi-variate regression yield model where (a) aquifer resistivity map, (b) aquifer thickness map and (c) coefficient of anisotropy map.
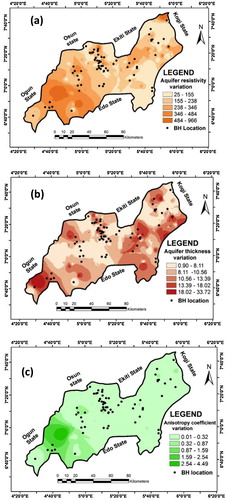
Table 2 Summary of the interpreted geoelectric parameters.
3.2.3 The geoelectric parameters–borehole yield relationship
To establish the influence of the above determined in situ physical aquifer parameters/factors on the extracted borehole yield rate records (), the relationships between the ρ, D and λ parameters and the records in must be established. In examining the spatial analysis and the overlay functionality of the GIS technique, the actual borehole yield values () and the corresponding interpreted and determined ρ, D and λ parameter values can be obtained by using the spatial model map of the determined geoelectrical parameters of the delineated aquifer units for each VES location in the study area ( and a–c). The results of the estimated borehole yield values and the corresponding values of the ρ, D and λ parameter values are presented in . The obtained results in were used to generate linear graphs showing the relationship of the actual borehole yield values to the aquifer layer resistivity values, aquifer layer thickness, and the coefficient of anisotropy values. This was performed to establish the linear correlation of the individual parameters to serve as the basis for their use in the proposed multivariate regression model. a–c presents linear graphs showing the relationship between the actual borehole yield rate values and the corresponding ρ, D and λ parameter values. According to a–c, the high regression coefficients of 0.82, 0.73 and 0.87, respectively, establish the high degree of direct relationship between the borehole yield rate and the determined in situ aquifer geoelectrical parameters (ρ, D and λ).
Fig. 6 Linear relationship between the borehole yield rate records and the geoelectrical derived parameters where graphs (a)–(c) are resistivity, thickness and coefficient of anisotropy parameters models, respectively.
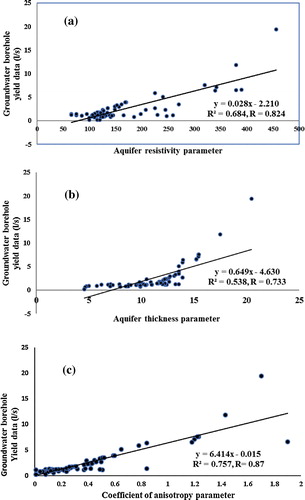
Table 3 Results of the geoelectric parameters and the corresponding actual borehole yield values.
3.3 Multiple variate regression (MVR) yield model
Consider the following generalised multiple variate regression model:(3)
(3) where β0 is the intercept; β1,β2 and β3 are the slopes of the regression line for x1, x2 and x3 which are the independent (predictor) variables, respectively; ℓi is the error term; and Y is the dependent variable (response) as reported in [Citation44,Citation45]. Eq. Equation(3)
(3)
(3) is an example of a linear regression model where the dependent variable Y is linearly related to the predictor variables x1, x2 and x3; however, the relationship between these variables is not exact and is subject to individual variation.
In this study, the borehole yield rate is the dependent variable (Y) and the geoelectrical parameters (ρ, D and λ) are the independent (predictor) variables (x1, x2 and x3). The linear relationship between the borehole yield rate (Y) and the individual dependent variables ρ, D and λ has been established as shown in a–c. However, because the relationship between the dependent and independent variables is not exact, an error term ℓi is introduced to accommodate any individual variation. Eq. Equation(3)(3)
(3) can be written as Eq. Equation(4)
(4)
(4) when x1, x2 and x3 are substituted with ρ, D and λ, respectively;
(4)
(4) The estimation of coefficients β0, β1, β2 and β3 were determined through integrative model regression analysis of the records in using R software. Based on the integrative model regression analysis, β1 = 0.02, β2 = 0.15, β3 = 3.52, β0 = −2.6 and the R-square value = 0.84. By substituting the estimated results, Eq. Equation(4)
(4)
(4) can be modified as Eq. Equation(5)
(5)
(5) ; the carat over Y indicates that it is an estimate and the error term ℓi is thus automatically resolved.
(5)
(5) Eq. Equation(5)
(5)
(5) is a multiple variate regression (MVR) equation with the borehole yield rate (Y) as the dependent variable and (ρ), (D) and (λ) as the multiple independent variables. Based on the submission of [Citation46] reported in [Citation27], Eq. Equation(5)
(5)
(5) is referred to as a Model. Thus, Eq. Equation(5)
(5)
(5) is the proposed multivariate regressions (MVR) yield prediction model developed for the study area.
4 Results and discussion
4.1 Sensitivity analysis of the developed MVR prediction yield model
According to [Citation47] and as cited by [Citation48], a sensitivity analysis is required that involves an analysis of the contribution of individual variables and input parameters on the resultant output of an analytical model. Adopting this approach, the developed MVR yield prediction model was evaluated for a parameter significance assessment. This analysis was carried out using R statistical software. presents the parameter significance evaluation results of the developed MVR yield prediction model. The results in show that the evaluated aquifer layer resistivity, the aquifer layer thickness, and the coefficient of anisotropy parameters have a significant relationship to the response variable borehole yield rate (Y) at P ≤ 0.05 (5%) in the examined area. This implies that the considered borehole yield rate conditioning factors (ρ, D and λ) have high significance at probability (P) ≥ 95% for estimating borehole yield rate (Y) using the MVR yield rate prediction model (Eq. Equation(5)(5)
(5) ). It can thus be implied that the integrative modelling of these aforementioned geoelectrical derived borehole yield rate conditioning parameters with their varying influences are appropriate for estimating and predicting borehole yield rate in the study area. The used borehole yield rate conditioning parameters (ρ, D and λ) in the developed MVR prediction yield model are easily derivable from simple geophysical measurement and thus make Eq. Equation(5)
(5)
(5) a legitimate model for aquifer yield potential determination. Therefore, the estimation and prediction of an area groundwater reservoir potential yield can be reliably determined from knowing these geoelectrical parameters, even in areas without boreholes.
Table 4 Parameters estimations analysis of the developed multiple variate regression (MVR) yield model developed in the area.
4.2 Appraisal of model prediction accuracy
Furthermore, the predictive power of the developed MVR yield prediction model was appraised to determine the feasibility of using the model to predict and estimate the area's groundwater reservoir potential yield. [Citation44,Citation49] suggested a systematic measure of accuracy for any forecast obtained from a model. This measure is called the Theil inequality coefficient, which is given by(6)
(6) where yi is the actual determined borehole yield rate observed in the area,
is the corresponding estimated borehole yield rate of yi from the MVR yield prediction model (see ) and K is the Theil inequality coefficient. Eq. Equation(6)
(6)
(6) was applied to assess the estimation and prediction accuracy of the MVR prediction yield model. The determined Theil inequality coefficient K value was then gauged by the critical value of
, α, where P = n − 1, n is the number of occupied borehole locations, and α is the 5% significance level. A smaller value of K compared with the χ2-tabulated value indicates better prediction accuracy of the model under investigation [Citation50]. The accuracy appraisal result of the MVR yield model is shown in . In addition, the regression line fitted to the actual borehole yield rate and the estimated borehole yield rate based on the MVR prediction yield model data was generated (), and the result shows a high regression coefficient of 0.88 for the linear relationship. These results confirmed the reliability and accuracy of using the MVR yield rate prediction (Y) model for predicting and estimating borehole yield rate in the non-investigated part of the area. Therefore, the output of this yield rate estimate using this developed MVR yield rate prediction model can be harnessed for groundwater resource evaluation and management in the study area.
Fig. 7 Linear relation between the actual borehole yield rate and the estimated borehole yield rate based on the MVR prediction yield model.
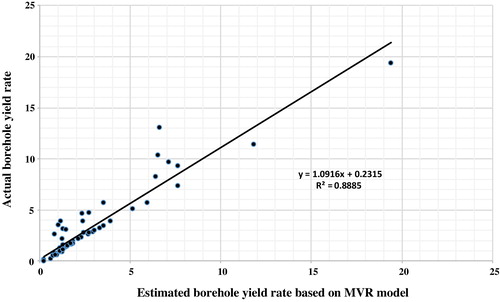
Table 5 The records of the actual borehole yield determined and the predicted borehole yield in the area.
Table 6 MVR yield model prediction accuracy analysis.
4.3 Spatial modelling of the borehole yield prediction map
The application of the MVR yield prediction model was carried out using extracted parameter values from the spatial model interpreted geoelectrical parameters (ρ, D and λ) as shown in a–c. The results of the GIS-based spatial analysis extraction processed with Eq. Equation(5)(5)
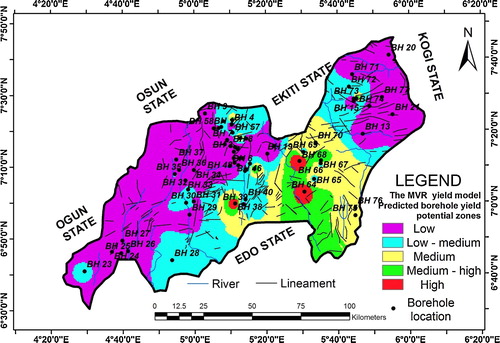
(5) is presented in . The estimated yield rates based on the MVR yield prediction model () were processed in a GIS environment using a geostatistical interpolation Kriging technique to spatially model the aquifer yield rate potential of the area. To classify the area aquifer potential yield prediction into zones, the area yield rate classification information obtained from the state water board agency, where yield rate values range from 0.2 l/s to 1 l/s, >1 l/s, <10 l/s, and >10 l/s, are apportioned to these actual yield descriptions for the low rate, the medium rate, and the high rate, respectively. Using the above criteria, the natural jerk classification algorithm embedded in a geostatistical wizard module was employed in a GIS environment to classify the area into five aquifer yield potential predicted zones: Low (0.06–2.55/s), Low medium (2.55–4.13 l/s), Medium (4.13–5.71 l/s), Medium high (5.71–7.74 l/s) and High (7.74–19.4 l/s). The final aquifer yield spatial prediction model map of the area is shown in . Furthermore, the area of extended coverage by these classified zones are 5318 km2, 2869 km2, 1786 km2, 1064 km2 and 186 km2, respectively.
Fig. 8 The borehole yield rate prediction model map based on the MVR borehole yield model developed.
4.4 Borehole yield model validation
The produced aquifer yield rate potential prediction map model was validated by adopting both qualitative and quantitative approaches. According to [Citation3,Citation51], model validation enables the reliability assessment of any proposed model and increases its usefulness in environmental decision-making studies. The indices used for the prediction map model validation in this study include the drain patterns (river/stream) and geologic lineament features. Through overlaying analysis, these surface geologic features were spatially correlated with the predicted yield rate potential zones (). Quantitatively, the computation of the density values for both the drain patterns and the lineament features were cross-tabulated with the predicted borehole yield classified zones to provide the results presented in . According to , across the predicted borehole yield zones, i.e., from Low to High, the mean river density varies from 0 to 0.0503 km−1. The low borehole yield rate classified zone is relative, with the highest river density values reducing downward to the other classified zones (Low medium, Medium, Medium high and High). Geologically, this suggests that the lithology underlying these zones possess varying porosity and permeability degrees that could be responsible for the varying degree of river drains in the area. Because the groundwater reservoir potential yield rate largely depends on river drain percolation resulting in recharge rate enhancement [Citation52], the possible predicted groundwater reservoir yield potential rate zones are generally structurally controlled and thus validated. However, the lineament intersection density (LID) features computed from the lineament features have mean values in the range of 0–0.009 across the classified aquifer unit potential yield zones (). The predicted high aquifer yield potential zone is characterised by the highest value of LID analysis compared to the other zones. Because high aquifer potential yield is synonymous with high groundwater potential, then the findings of [Citation47,Citation48] that established high LID is associated with high groundwater recharge potential thus substantiates the LID result analysis (). Therefore, the analysed LID result further validates the predicted borehole yield zones (). As a result, the produced borehole yield prediction model map () is a viable tool for monitoring the assessment of groundwater quantity potential that can enhance groundwater resource sustainability in an area.
Table 7 The GIS based cross-tabulation analysis results for the model map validation.
5 Conclusions and future works
This study adequately evaluated the mapping and assessment of an area with underlying aquifer unit yield potential on a regional scale through the output of a GIS-based MVR yield prediction model. This newly proposed borehole yield rate prediction model was based on relating the records of in situ borehole yield rate measurements to geoelectrically derived parameters interpreted from one-dimensional VES-Schlumberger soundings acquired in the Crystalline Basement Complex terrain of southwestern Nigeria. Sensitivity and prediction accuracy analyses of the newly proposed aquifer yield potential prediction model using χ2 distribution at an α = 0.05 significance level was conducted using R statistical software. The MVR yield rate potential prediction model was used to estimate borehole yield values that were spatially processed in a GIS environment to produce a groundwater reservoir potential yield prediction model map of the area. The regional aquifer yield potential model prediction map provided an excellent insight into assessing the viability of the possible underlying aquifer unit yield to the groundwater resource sustainability in the area. The information on this prediction map can serve as a scientific basis for groundwater resource exploration and management in the area. Furthermore, the proposed MVR yield prediction model that was developed with variables from multifaceted geologic settings can be used in any area with similar geology for groundwater resource potential evaluation if the required geoelectrical parameters are known.
Compared with other borehole yield assessment methods, the approach used in this study can provide a quick, independent, and cost-effective assessment of aquifer unit yield potential rates through simple geophysical measurement. However, the efficiency of this developed aquifer yield prediction model can be greatly enhanced by deriving the required borehole yield conditioning parameters from a 2D or 3D resistivity imaging technique. This can enable an accurate modelling of subsurface geological features, from which enhanced borehole yield conditioning parameters can be derived for re-evaluating this model in the future.
Notes
Peer review under responsibility of Taibah University.
Related Research Data
References
- I.ParkY.KimS.LeeGroundwater productivity potential mapping using evidential belief functionGroundwater201410.1111/gwat.12197
- S.LeeS.Kyo-YoungK.YongsungI.ParkRegional groundwater productivity potential mapping using a geographic information system (GIS) based artificial neural network modelHydrogeol. J.2012117
- K.A.N.AdiatM.N.M.NawawiK.AbdullahAssessing the accuracy of GIS-based elementary multi criteria decision analysis as a spatial prediction tool – a case of predicting potential zones of sustainable groundwater resourcesJ. Hydrol.201210.1016/j.jhydrol.2012.03.028
- A.ChowdhuryM.K.JhaV.M.ChowdaryB.C.MalIntegrated remote sensing and GIS-based approach for assessing ground-water potential in West Medinipur district, West Bengal, IndiaInt. J. Remote Sens.3012009231250
- B.DeepikaK.AvinashK.S.JayappaIntegration of hydrological factors and demarcation of groundwater prospect zones: Insights from remote sensing and GIS techniquesEnviron. Earth Sci.7020131319133810.1007/s12665-013-2218-1
- I.JasminandP.MallikarjunaReview: satellite-based remote sensing and geographic information systems and their application in the assessment of groundwater potential, with particular reference to IndiaHydrogeol. J.1942011729740
- R.K.PrasadN.C.MondalP.BanerjeeM.V.NandakumarV.S.SinghDeciphering potential groundwater zone in hard rock through the application of GISEnviron. Geol.552008467475
- A.G.MaxwelA.GeophreyA.K.RaymondPrediction of potential groundwater over- abstraction: a safe-yield approach – a case study of Kasena-Nankana district of UE region of GhanaRes. J. Appl. Sci. Eng. Technol.419201237753782
- R.C.CarterWater and Poverty: Redressing the Balance2003
- P.RenardThe future of hydraulic testsHydrogeol. J.20051325913262
- Roscoe, Moss Co.Handbook of Ground Water Development1990WileyNew York 34-51C.W
- FetterApplied Hydrogeology4th ed.1994Prentice HallEnglewood Cliffs, NJ543591
- D.K.ToddL.W.MaysGroundwater Hydrology2005WileyNew York
- M.K.JhaV.M.ChowdaryA.ChowdhuryGroundwater assessment in Salboni Block, West Bengal (India) using remote sensing, geographical information system and multi-criteria decision analysis techniquesHydrogeol. J.18720101713172810.1007/s10040-010-0631-z
- A.S.1.AkinwumijuO.O.OrimoogunjePredicting the yields of deep wells of the deltaic formation, Niger Delta, NigeriaJ. Environ. Anal. Toxicol.32201310.4172/2161-0525.1000168
- C.C.EzehG.Z.UgwuA.OkonkwoJ.OkamkpaUsing the relationships between geoelectrical and hydrogeological parameters to assess aquifer productivity in Udi LGA, Enugu State, NigeriaInt. Res. J. Geol. Min. (IRJGM) (2276-6618)312013918
- H.MartinEvaluation of factors influencing transmissivity in fractured hard-rock aquifers of the Limpopo ProvincePaper presented at the International Conference on Groundwater201210.4314/wsa.v38i3.3 ISSN 0378-4738 (Print) Available on http://www.wrc.org.za
- K.A.MogajiH.S.LimK.AbdullahModeling of groundwater recharge using a multiple linear regression (MLR) recharge model developed from geophysical parameters: a case of groundwater resources managementEnviron. Earth Sci.73201512171230
- I.P. Ifabiyi, Water Resources Utilization Implementation. Journal of Social Sciences. Envtal. Setting. Jomoh HI, Ifabiyi IP (Eds.), Contemporary Issues in Environmental Studies. Haytees Press, Ilorin (2000) 245–250.
- P.UngemachF.MoslaghiniA.DupratEmphasis in determination of transmissivity coefficient and application in nappe alluvial aquifer RhineBull. Inst. Assoc. Sci. Hydrol.XIV31969169190
- W.KellyGeoelectric sounding for estimating aquifer hydraulic conductivityGroundwater1561977420425
- W.K.KosinkiW.E.KellyGeoelectric soundings for predicting aquifer propertiesGroundwater191981163171
- S.NiwasD.C.SinghalAquifer transmissivity of porous media from resistivity dataJ. Hydrol.821985143153
- O.A.L.De LimaS.NiwasEstimation of hydraulic parameters of shaly sandstone aquifers from geological measurementsJ. Hydrol.23520001226
- S.ChandraR.ChV.A.RaoV.S.SinghS.C.JainEstimation of natural recharge and its dependency on sub-surface geoelectric parametersJ. Hydrol.200410.1016/j.jhydrol.2004.04.001
- I.LouisG.KarantonisN.VoulgarisF.LouisGeophysical methods in the determination of aquifer parameters: the case of Mornos river delta, GreeceRes. J. Chem. Environ.18420044149
- D.C.S.Mufid Al-HadithiM.IsrailB.KumarGroundwater-recharge estimation using a surface electrical resistivity method in the Himalayan foothill region, IndiaHydrogeol. J.1420064450
- S.NiwasO.A.L.de LimaAquifer parameter estimation from surface resistivity dataGroundwater41120039499
- D.V.FittermanM.Deszcz-PanS.T.PrinosHelicopter Electromagnetic Survey of the Model Land Area, Southeastern Miami-Dade County, Florida2012U.S. Geological Survey Open-File Report: 117677
- A.C.HinnellT.P.A.FerreJ.A.VrugtJ.A.HuismanS.MoyseyJ.RingsM.B.KowalskyImproved extraction of hydrologic information from geophysical data through coupled hydrogeophysical inversionWater Resour. Res.201010.1029/2008WR007060
- H.A.JoneR.D.HockeyThe geology of part of south-western NigeriaGeol. Surv. Nigeria Bull.31196487
- M.A.RahamanO.OcanOn the relationships in the Precambrian Magmatic Gneissis of NigeriaJ. Min. Geol.1519782332
- M.A.RahamanRecent Advances in the Study of the Basement Complex of Nigeria Precambrian Geology of Nigeria1988A Publ. of Geological Survey of Nigeria
- B.N.SatpathyB.N.KanungoGroundwater exploration in Hard rock terrain – a case studyGeophys. Prospect.2441976725763
- M.A.Dan-HassanM.O.OlorunfemiHydro-geophysical investigation of a basement terrain in the north central part of Kaduna State NigeriaJ. Min. Geol.3521999189206
- A.N.BalaE.C.IkeThe aquifer of the crystalline basement rocks in Gusau area, North-western NigeriaJ. Min. Geol.3722001177184
- A.OchukoHydrogeophysical and hydrogeological investigations of groundwater resources in Delta Central, NigeriaJ. Taibah Univ. Sci.920155768
- A.JayeobaM.A.OladunjoyeHydro-geophysical evaluation of groundwater potential in hard rock terrain of southwestern NigeriaRMZ – M&G602013271285
- R.MailletThe fundamental equations of electrical prospectingGeophysics121974529556
- K.A.MogajiG.M.OlayanjuM.I.OladapoGeophysical evaluation of rock type impact on aquifer characterization in the basement complex areas of Ondo State, Southwestern Nigeria: Geo-electric assessment and Geographic Information Systems (GIS) approachInt. J. Water Res. Environ. Eng.3420117786
- A.O.AdelusiM.A.AyukJ.S.KayodeVLF-EM and VES: an application to groundwater exploration in a Precambrian basement terrain SW NigeriaAnn. Geophys.5712014S018410.4401/ag-6291 2013
- C.E.ChukwudiG.Z.UgwuO.AustinJ.OkamkpaUsing the relationships between geoelectrical and hydrogeological parameters to assess aquifer productivity in Udi LGA, Enugu State, NigeriaInt. Res. J. Geol. Min. (IRJGM) (2276-6618)312013918 Available at: http://www.interesjournals.org/irjgm
- M.A.AyukA.O.AdelusiK.A.N.AdiatEvaluation of groundwater potential and aquifer protective capacity assessment at Tutugbua-Olugboyega area, off Ondo road, Akure Southwestern NigeriaInt. J. Phys. Sci.812013375010.5897/IJPS09.299 9. Available at: http://www.academicjournals.org/IJPS
- A.KoutsoyiannisTheory of Econometrics2nd ed.1977PalgraveNew York
- D.N.GujaratiBasic Econometric4th ed.2004
- O.MazacW.E.KellyI.LandaA hydrogeophysical model for relations between electrical and hydraulic properties of aquifersJ. Hydrol.791985119
- P.NapolitanoA.G.FabbriSingle-parameter sensitivity analysis for aquifer vulnerability assessment using DRASTIC and SINTACS. HydroGIS 96: application of geographic information systems in hydrology and water resources management (proceedings of the Vienna conference)IAHS Publ.2351996559566
- I.DoumouyaB.DibiK.I.KouameB.SaleyJ.P.JourdaI.SavaneJ.BiemiModelling of favourable zones for the establishment of water points by geographical information system (GIS) and multicriteria analysis (MCA) in the Aboisso area (South-east of Côte d’Ivoire)Environ. Earth Sci.6720121763178010.1007/s12665-012-1622-2
- H.T.NeilMulti-variate Analysis with Application in Education and Psychology2nd ed.1990John Wiley and SonsNew York
- H.T.NeilMultivariate analysis with application in Education and PsychologyRevised ed.2003Wadsworth Publishing Company, Inc.Belmont, CA
- M.A.ManapW.N.A.SulaimanM.F.RamliB.PradhanN.SuripA knowledge-driven GIS modelling technique for groundwater potential mapping at the Upper Langat Basin, MalaysiaArab. J. Geosci.6520131621163710.1007/s12517-011-0469-2
- K.A.MogajiH.LimK.AbdullahModeling of groundwater recharge using a multiple linear regression (MLR) recharge model developed from geophysical parameters: a case of groundwater resources managementEnviron. Earth Sci.73201512171230