
 ?Mathematical formulae have been encoded as MathML and are displayed in this HTML version using MathJax in order to improve their display. Uncheck the box to turn MathJax off. This feature requires Javascript. Click on a formula to zoom.
Abstract
Activated carbon obtained from plantain peels was applied to the optimization of the adsorption process parameters for abstraction of colour from simulated dye effluent. The activated carbon was prepared and characterized using nitrogen adsorption, X-ray diffractometry (XRD) and Fourier transform infrared spectroscopy (FTIR). Equilibrium isotherms were modelled using the Langmuir, Freundlich, Dubinin–Radushkevich and Temkin models; the Temkin and Dubinin–Radushkevich models provided the best fit for the sorption process, with a correlation coefficient greater than 0.95. The D–R model suggested a chemical process. The pseudo second-order kinetic model agreed well for fitting experimental data with the calculated adsorption capacity, qe, (46.5 mg/g), which was reasonably close to the experimental value (47.3 mg/g). Optimization of the process parameters was achieved using response surface methodology (RSM) – Box–Behnken design, where factors considered are represented on three levels: (−1), (0) and (+1) for high, mean and low levels, respectively. ANOVA fits a quadratic model with prob > F less than 0.05 (<0.0001) at 95% confidence level. From this modelling, significant factors for dye removal have been identified.
1 Introduction
Activated carbon has numerous applications, including liquid phase applications, gas phase applications, reduction of industrial air pollution and electrodes and batteries. In liquid phase applications, activated carbon is used to treat industrial wastewaters, e.g., textile manufacturing wastewater. Activated carbon's large porous surface area and controllable pore structure make this material suitable for wastewater treatment [Citation1]. The porosity of activated carbon facilitates the uptake of dyes; in this application, the chemical properties of dye and activated carbon are crucial due to the interactions that occur between the adsorbate and adsorbent [Citation2,Citation3]. Dye contamination of wastewater is a serious issue that affects dye and pigment-related industries [Citation4,Citation5]. Even at very low concentrations, dyes reduce general water quality by impairing important characteristics such as the oxygen solubility level. The complex molecular structure of dyes makes them stable and difficult to biodegrade [Citation6]. Methylene blue (MB), known for its wide application in textile industries, has harmful effects on living organisms during short periods of exposure [Citation7]. In view of the above, plantain peels, a biowaste discarded in large quantities in most parts of the world, including Nigeria, can be used for the preparation of activated carbon [Citation8]. Activated carbon prepared from plantain peels was utilized in the present study for dye abstraction from simulated dye wastewater. Plantain is a tropical crop from the genus Musa and is used as a food in many parts of the globe. Plantain peels are the outer layer of the plantain fruit, which is normally discarded as waste during food preparation. Many methods for removing dye from effluents have been studied [Citation9]. Adsorption removes dyes with high efficiency. Carbon adsorbents made from biowaste, which consists primarily of cellulosic matter, exhibit high efficiency in removing dyes. Activated carbon produced from agricultural waste is effective for the adsorption of dyes from solution [Citation10–Citation14] because of its high surface area, as well as its micropore and mesopore structures. The micro- and mesopores develop during activation at high temperature. Few studies have been published employing plantain peels to produce activated carbon. Opeoyu and Fatoki [Citation15] studied the dynamics of adsorption of zinc from an aqueous matrix using plantain peels. The adsorption efficiency of the biomass was greater than 99% for Zn2+. Idowo et al. [Citation16] studied the biosorption of chromium (VI) from aqueous solution using the biomass of plantain peel residue; the biomass was suitable for certain applications. Akpor et al. [Citation17] used plantain peels in the removal of phosphorus and nitrogen from aqueous solution. The authors suggested the use of plantain peels for the bioremediation of wastewater. In a study by Adeyi et al. [Citation12], carbon from plantain peels was used successfully to clean up effluent contaminated with aniline blue from textile industries. The adsorption of dyes has been studied with several sorbents using mathematical models, e.g., response surface. These studies are important for understanding the process and optimizing conditions for high adsorption [Citation18–Citation20].

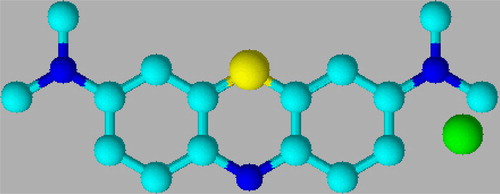
Fig. 1 3D-molecular ball and stick structure of methylene blue: colour code; blue – nitrogen, orange – sulphur, green – chlorine and light blue – CH.
Response surface methodology (RSM) is a set of mathematical techniques that describes the relationship among several independent variables and one or more dependent variables (responses). This method was developed by Box and Wilson [Citation21] and has been widely used as a technique for designing experiments. This technique is useful in the fields of science and engineering, especially for better understanding and improving the efficiency of a process. RSM varies all significant parameters simultaneously over a set of designed experiments and then combines the results through a mathematical model [Citation22,Citation23]. Box and Behnken [Citation24] developed a model that accurately describes linear, quadratic and interaction effects of a second-order polynomial. This design was created to minimize the number of experiments in quadratic model fitting. Experimental matrices are constructed while taking into account two levels: high (+1) and low (−1) levels. The final matrix is completed by introducing a medium level and several replications of the central point, which reduces error.
In this paper, we employed Box–Behnken design (BBD) to optimize the adsorption process parameters for the adsorption of methylene blue (MB) from simulated dye effluent using activated carbon prepared from plantain peels; MB is a representative dye commonly used in the textile industry. The interactive effects of the process parameters were studied using this model. Kinetic and equilibrium studies were analysed to assess the validity of the statistical model and to determine the type of adsorption process.
2 Experimental
All chemical reagents, including H2SO4, NaOH, HCl and MB (), were of analytical grade and were used as received. Plantain peels were collected from a disposal outlet in Uyo Metropolis, Nigeria. Details for preparation methods have been published elsewhere [Citation8]. The prepared activated carbons (PAPP) and (CAPP), along with the nonactivated sample (NAPP), were characterized for surface area, porosity, surface functional groups and crystalline structure. The surface area and porosity analyses were carried out using a Micromeritics Surface area and porosity Analyser (Model: TriStar 3000) by nitrogen adsorption method at −196 °C after pretreatment at 300 °C for 4 h. The surface areas and pore volumes were determined online with the analyser program. The surface functional groups were detected by FTIR spectrophotometry (Nicolet 6700, USA). XRD of the samples was analysed with a powder X-ray (Shimadzu XRD-6000) diffractometer using Cu Kα radiation at a scanning rate of 6°/min, with 2θ ranging from 5° to 60°.
2.1 Design of experiment
Batch adsorption was employed in an optimization study of the following three independent parameters: initial dye concentration (X1), adsorbent weight (X2), and contact time (X3) (). The optimization study followed carefully designed experiments using expert design (Version 7.0) with a BBD of the RSM. In total, 17 experiments with all possible combinations of parameters were run in duplicate. The average adsorption capacity, qe,av (mg/g) was used to obtain predicted responses () according to their low, medium and high levels represented by −1, 0 and +1, respectively. The number of experiments was calculated according to Eq. Equation(1)(1)
(1) ,
(1)
(1) where N is the total number of experiments, k is the number of studied factors and r is the replicate number of central points [Citation5].
Table 1 Process variables and levels.
Table 2 Experimental design matrix for optimization using BBD.
2.2 Preparation of adsorbate and adsorption process
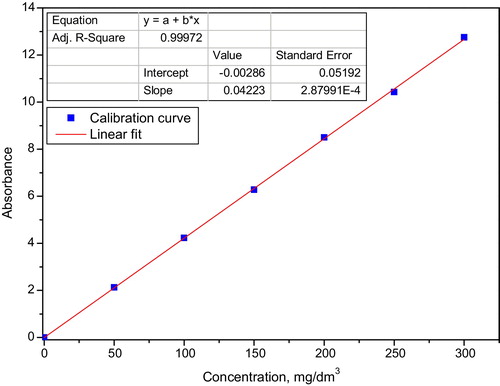
A stock solution of 1 g/dm3 MB was prepared by dissolving 0.5 g of the dye in distilled water in a 0.5-dm3 volumetric flask and filling the flask to the mark. Working solutions were prepared from this stock solution by serial dilution to the desired concentrations; these solutions were used to generate a calibration curve (). The adsorptive application of the prepared carbons was evaluated using a batch process and wastewater produced from a simulated dyeing process. Arbitrary concentrations (150 mg adsorbent weight and 200 mg/dm3 dye solution) were selected to evaluate the prepared adsorbents. Percentage adsorption, R, was calculated using Eq. Equation(2)(2)
(2) .
(2)
(2) where Ci is the concentration of dye before adsorbent addition and Cf is the concentration of dye remaining in solution at equilibrium. Experiments were carried out to study the factors for maximum adsorption; the details are shown in and . The initial dye concentration, adsorbent weight and contact time were varied on three levels according to . pH was maintained at 3.0 throughout the experiment. This pH was chosen based on literature reports that found this pH maximized adsorption due to the existence of negatively charged species on the surface of agricultural waste carbon [Citation8,Citation25]. The pH was adjusted using 0.1 M NaOH or HCl. The kinetics of the process was studied by adsorbing the dye at different time intervals ranging from 2 to 35 min. Then, 100 mg of the adsorbent was added to a 250 cm3 conical flask containing 30 cm3 of a 100 mg/dm3 dye solution. The mixture was stirred with a magnetic stirrer vibrating at 200 rpm at room temperature (300 ± 2 K) until equilibrium was reached. The isotherm study was conducted by varying the initial concentration of the dye from 50 to 300 mg/dm3 at a constant adsorbent weight of 100 mg/dm3. The batch was agitated for 30 min with a magnetic stirrer at constant temperature (300 ± 2 K). In each experiment, the residual dye concentration was determined using a UV-spectrophotometer (Unicam Heλ, Model 2100) at a predetermined maximum wavelength of MB (λmax = 665 nm). The quantity of dye adsorbed at equilibrium (qe, mg/g) was calculated according to Eq. Equation(3)
(3)
(3) .
(3)
(3)
Fig. 2 Calibration curve for methylene blue absorption.
3 Results and discussion
3.1 Characterization of activated carbon
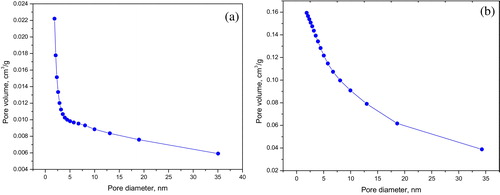
Characterization of the activated carbon's surface area and porosity, surface functional groups and crystalline structure was carried out using BET adsorption method, FTIR and XRD, respectively. The surface area and porosity results have been published elsewhere [Citation8]. Both PAPP and CAPP exhibited greater surface area and mesoporosity compared with NAPP; this is due to a burn off of the volatile substances on the carbon's surface during activation [Citation1,Citation11,Citation26]. CAPP had an SBET of 297 m2/g, higher than PAPP and NAPP, which had SBET values of 177 m2/g and 1.71 m2/g, respectively. These differences were due to cumulative chemical and heat activation; the changes in the surface areas were attributable to the pores in PAPP. The pores were created in PAPP through a release of organic volatiles and CO from fixed carbon, which is attributed to the larger pore size (meso/macropores) and usually contributes to lower surface area [Citation1]. Pores with diameters <2 nm, 2–50 nm and >50 nm are classified as micropores, mesopores and macropores, respectively. a and b shows that most adsorption of gas molecules occurred on the low mesopores of the carbons; the mesopores had diameters of 1.8–5.0 nm and 1.8–3.5 nm for CAPP and PAPP, respectively. These observations indicate that the carbons were suitable for adsorption. Methylene blue has been reported to be successfully adsorbed onto mesopores with pore diameters greater than 1.5 nm [Citation27–Citation30].
Fig. 3 Barrett, Joyner and Halenda (BJH) cumulative pore volume adsorption plot for activated carbon: (a) CAPP and (b) PAPP.
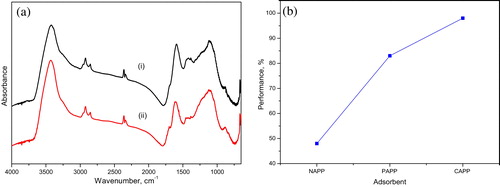
In addition to the surface area and porosity, the performance of activated carbon is also influenced by surface chemistry. The different heteroatoms on the surface of activated carbon govern its chemistry. Heteroatoms such as oxygen, nitrogen and hydrogen are borne to peripheral carbon atoms and exist as organic functional groups [Citation31]. The surface functional groups were studied using an FTIR spectrophotometer in the wave number range of 4000–400 cm−1. The spectra [Citation8] and a reveal different functional groups on the surface of PAPP, CAPP and NAPP of the plantain peels. The NAPP exhibits many heteroatoms, as revealed by the spectrum. The activation processes produce activated carbon and decreased the heteroatoms. The decrease in heteroatoms resulted in a decrease in vibration bands, as evidenced by the reduced intensity of certain peaks and the disappearance of some bands. This indicates that the activation processes for the production of PAPP and CAPP were efficient and led to oxidation of the functional groups of the starting material [Citation32]. However, a shows spectra of the carbon surface before and after adsorption. The intensity of the vibration near 1425 cm−1 decreased. This is indicative of an interaction between the functional group on the surface of the carbon and a functional group from the dye [Citation33].
3.2 Evaluation of activated carbons
The prepared activated carbons, PAPP and CAPP, were tested for their ability to effectively adsorb dyes compared with the NAPP (b). Abstraction of colour was in the order NAPP < PAPP < CAPP. Compared with NAPP, PAPP and CAPP were 35% and 50% more efficient, respectively. This might be related to the increase in surface area and pore volume, which invariably increased the micro-mesoporosity:macroporisity ratio in the structure of the carbons. In the PAPP, only approximately 6% pore volume is microporous; the rest are a combination of mesopores and macropores. The attribution of macroporosity to decreased surface area is documented in the literature [Citation1]. Based on this evaluation, optimization, kinetics and isotherm studies were conducted with CAPP.
Fig. 4 (a) FTIR spectra of (i) CAPP, (ii) dye sorped CAPP and (b) adsorption evaluation for prepared activated carbons.
3.3 Equilibrium adsorption isotherm
Adsorption isotherms are invaluable tools for evaluating the performance of the adsorption process, describing how the adsorbent interacts with the adsorbate. Useful conclusions can be drawn for a process by relating the equilibrium concentration of a dye solution with adsorption capacity. Although several adsorption isotherms are known, only four important isotherms are analysed in the present report. The Langmuir isotherm [Citation34], which describes monolayer attachment of gas or liquid molecules to the surface of an adsorbent, was applied according to Eq. Equation(4)(4)
(4) . A plot of 1/qe against 1/ce (not shown) should be a straight line with a good correlation coefficient (R2) to be reliable. b and qo () are obtained from the slope and intercept of the plot, respectively. qe (mg/g), ce (mg/dm3), b (dm3/mg) and qo (mg/g) are adsorption capacity, dye concentration at equilibrium, Langmuir isotherm constant and maximum adsorption capacity, respectively. The characteristic nonlinear plot and poor R2 value for this study made it insufficient to explain the adsorption process.
Table 3 Equilibrium adsorption isotherm parameters.
The Freundlich isotherm has been applied to study the heterogeneity of systems, especially for organic compounds or highly interactive species on activated carbon and molecular sieves [Citation35]. Its linear form is represented by Eq. Equation(5)(5)
(5) . A plot of log qe against log Ce (a) gives a linear curve where constant KF (Freundlich isotherm constant [(mg/g)(dm3/g)1/n]) is related to adsorption capacity. KF and n (adsorption intensity) are calculated from the intercept and slope of the plot, respectively. The slope ranging between 0 and 1 is a measure of adsorption intensity or surface heterogeneity; it becomes more heterogeneous as its value gets closer to zero [Citation35]. In this study, 1/n is greater than unity, indicating cooperative adsorption.
Fig. 5 (a) Freundlich isotherm plot. (b) Temkin isotherm plot. (c) Dubinin–Radushkevich plot. (d) Pseudo second-order kinetics plot for MB adsorption.
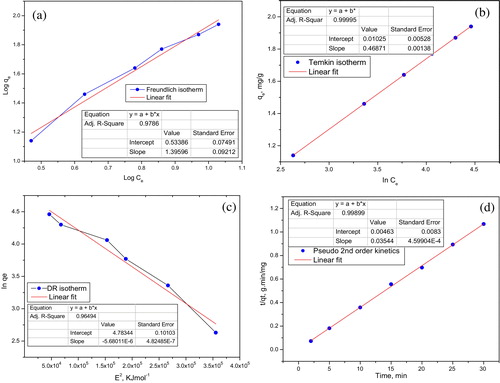
The Temkin isotherm model provides useful insight into the adsorption mechanism as it explicitly accounts for adsorbent–adsorbate interactions and the energy of adsorption. This model assumes the heat of adsorption of all of the molecules in the layer decreases linearly with coverage due to adsorbent–adsorbate interactions. The adsorption is characterized by a uniform distribution of binding energies, up to some maximum binding energy [Citation36]. The derivation of the Temkin isotherm assumes that the decrease in the heat of sorption is linear rather than logarithmic, as implied by the Freundlich equation [Citation25]. The Temkin isotherm can be applied in the form given in Eq. Equation(6)(6)
(6) , where T is the absolute temperature (K), R is molar gas constant (J/mol K), and KT (dm3/g) and b (J/mol) are Temkin isotherm constants. By plotting qe against ln Ce (b), KT and b can be calculated from the intercept and slope of the straight line. Values of b and KT (), 5321.5 J/mol and 1.0221 dm3/g, respectively, are within the validity frame of model fit for explaining this adsorption process. The process was endothermic as indicated with a positive energy value. The D–R isotherm was also used to estimate the apparent free energy of adsorption and type of adsorption [Citation37]. The D–R equation can be written in the form of Eq. Equation(7a)
(7a)
(7a) , where KE is a constant related to the adsorption energy (mol2/kJ2) and Q is, the theoretical D–R constant (mg/g). ɛ is the Polanyi potential and is calculated from Eq. Equation(7b)
(7b)
(7b) , where R is the molar gas constant (J/mol K) and T is absolute temperature (K). The values of Qm and KE were obtained from the intercept and slope, respectively, of the linear plot of ln qe against ɛ2 (). The mean adsorption energy, E (kJ/mol), can be obtained by applying the value of KE of the D–R isotherm equation in Eq. Equation(7c)
(7c)
(7c) . Calculation gives a value of 296.7 kJ/mol for E. It has been documented that “E” provides useful information on the type/mechanism of adsorption process. If ‘E’ is less than 8 kJ/mol, the adsorption is physical in nature; if it is between 8 and 16 kJ/mol, the adsorption process proceeds via ion exchange. If ‘E’ is greater than 16 kJ/mol, the mechanism of particle diffusion and chemical reaction dominate the process [Citation38–Citation40]. Therefore, from this result, it is concluded that the process is chemisorption.
(4)
(4)
(5)
(5)
(6)
(6)
(7a)
(7a)
(7b)
(7b)
(7c)
(7c)
3.4 Adsorption kinetics
Adsorption kinetics was studied to understand the dynamics of the system, applying pseudo-first and pseudo-second-order models. The linear form of pseudo-first-order dynamics is given by Eq. Equation(8)(8)
(8) . A plot of log(qe − qt) against t (not shown) is expected to be linear for applicability of the model. However, for this study, the data deviated largely from linearity and was inapplicable. In Eq. Equation(8)
(8)
(8) , qe is the adsorption capacity at equilibrium (mg/g), qt is instantaneous adsorption capacity (mg/g), t is time (min) and K1 (/min) is the rate constant for the reaction order. K1 and qe are 0.231/min and 21.8 mg/g, respectively, with R2 < 0.7. These values are typical of a nonconforming model for this work. Experimental data fit a pseudo-second-order kinetic model with a good correlation coefficient, R2 = 0.9989; qe (46.8 mg/g) approaches an experimental value of 47.3 mg/g. Parameters evaluating the applicability of pseudo second order reaction were obtained from the plot of t/qt against t (d) in Eq. Equation(9)
(9)
(9) , where K2 is the rate constant for the reaction and the other terms have their usual meanings. The fitting of a pseudo-second-order kinetic model confirms the earlier proposition from the D–R isotherm that the process is a chemisorption process.
(8)
(8)
(9)
(9)
3.5 Statistical analysis of regression model
Experiment design provides a statistical model that uses quantitative data to determine regression model equations for the optimization of operating conditions [Citation41]. The Box–Behnken design of RSM was employed to optimize conditions for maximum adsorption of MB on carbon from plantain peels. The methodology is practical because it employs experimental data and explores the interactive effects of the variables on the overall process. Statistical analysis was carried out by fitting experimental data to a general model equation given in Eq. Equation(10)(10)
(10) [Citation42],
(10)
(10) where Y is the response; βo is a constant coefficient; βj, βjj and βij are interaction coefficients of linear, quadratic and second-order terms, respectively; xi and xj are the independent variables; k is the number of studied factors; and ei is the error term. The coded values of the process parameters in Eq. Equation(10)
(10)
(10) could be determined by Eq. Equation(11)
(11)
(11) where xi is the dimensionless coded value of the ith independent variable, xi is the uncoded value of the ith independent variable, xo is the uncoded value of the ith independent variable at the centre point and Δxi is the step change value between low level (−1) and high level (+1) [Citation43].
(11)
(11) The transformed model equation in terms of coded factors is given in Eq. Equation(12)
(12)
(12) .
(12)
(12) where qe is the predicted adsorption capacity. Eq. Equation(12)
(12)
(12) can be used to make predictions about the response in terms of coded factors for a given level of each factor. The high and low levels for the factors are coded as +1 and −1, respectively. The relative impact of the factors is determined by comparing the factor's coefficients. The initial concentration is indicated by the coefficient to have a significant impact on adsorption. The significance of the model equation and the goodness of fit were evaluated by the F-test analysis of variance (ANOVA) () and R2 values (). The ANOVA subdivides the total variation in a set of data into components associated with specific sources of variation to test hypotheses on the parameters of the model [Citation44]. It also identifies important factors and determines which is the most significant and if the experiment results are meaningful. A large F-value indicates that most of the variation can be explained by a regression equation and a low p-value (<0.05) points to a statistically significant model. The responses (see ) were calculated according to Eq. Equation(12)
(12)
(12) , and the data were verified by the coefficients of each of the terms in . The significance of each coefficient was measured from the probability values (p-values). The model F-value (85.16) implies that the model is significant. Values of P(F > 0.1) indicate that the model terms are not significant. In this process, X1 and X2, are the most significant terms (). Good values that predict an accurate response for the standard deviation, coefficient of variation, adjusted R2 and predicted R2 are 0.92, 3.11, 0.9853 and 0.8558, respectively (). Generally, the coefficient of variation (CV), which is the ratio of the standard error to the mean value of the observed response measures reproducibility of the model. A model can be considered reasonable if its CV is less than 15% [Citation45]. Although predicted R2 is less that adjusted R2, it is considered to be in reasonable agreement if the difference is less than 0.2 threshold value. The R2 value (0.991) is indicative of the model providing 99.1% accuracy of output prediction. Cobas et al. [Citation5] and Isa et al. [Citation42] recorded model outputs of approximately 95.3% and 97%, respectively, indicated nonbias models. The validity of the model was confirmed by the diagnostic plots; normal probability plots of studentized residuals and plots of predicted values against actual values (). While the former shows a good distribution of data at experimental points, the latter shows that predicted and actual values agree well. These results indicate that the statistical analysis data confirms the experimental data to a significant degree of certainty.
Fig. 6 (a) Normal probability plot of studentized individuals and (b) predicted against actual values of adsorption capacity for MB adsorption.
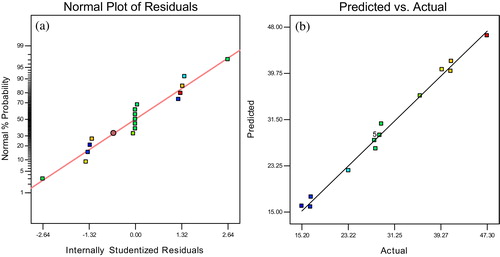
Table 4 ANOVA for response surface quadratic model.
Table 5 Model fit summary for quadratic model1.
3.6 Effect of variables interaction on adsorption
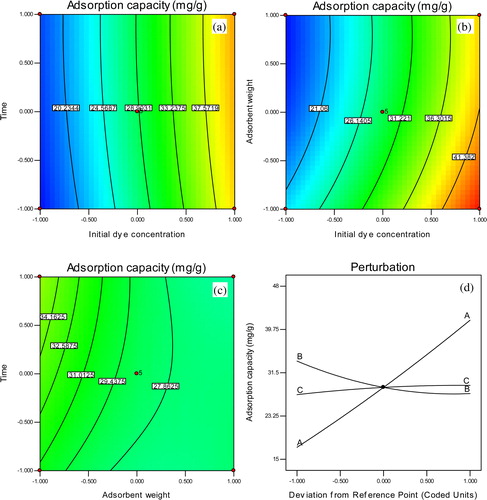
shows the effect of the interaction of any two factors in the adsorption process while the other factor remained constant. The simultaneous effect of time and initial concentration is presented (a). The adsorption capacity increases with an increase in concentration. This means that at a higher concentration, there is a greater driving force to overcome mass transfer limitations, leading to higher adsorption. From the figure, adsorptive removal was exclusively concentration dependent as revealed by the intense contour gradient at high concentrations. The interactive effect of adsorbent weight and initial concentration is shown in b. Obviously, the two factors have an overwhelming influence on the response. The gradient of the contour tilts the lower right corner of the plot, implying a high performance at high concentration and low adsorbent weight. Although increases in adsorbent weight increase the adsorption, in this study, adsorption sites corresponding to 100 mg showed maximum adsorption. In c, the effect of time and adsorbent is shown; the adsorbent weight is the limiting factor even at very short contact times. The interactive effects of these variables demonstrate the impact of each factor on the response. Nevertheless, the most important factor controlling the response can also be shown with the perturbation plot (d). The response is plotted by changing only one factor over its range while holding the other factors constant. The perturbation plot compares the effect of all of the factors at a particular point in the design space. As seen from the plot, concentration is the most significant factor for this process, which varies greatly with adsorption capacity.
Fig. 7 Contour plot showing effect on adsorption capacity of combined factors (a) time and initial concentration, (b) adsorbent weight and initial concentration, (c) time and adsorbent weight and (d) perturbation plot showing effect of individual factors at the medium level.
3.7 Process optimization
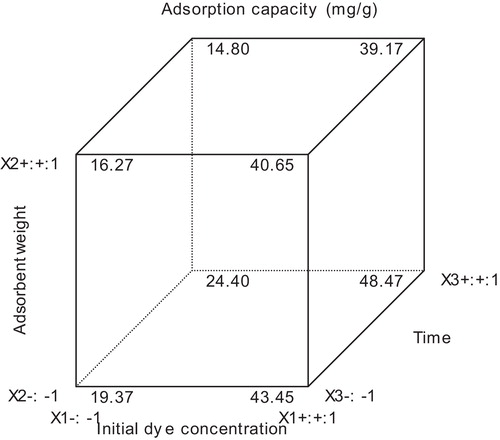
Process optimization was achieved using the numerical node of the design expert software. The three studied variables were targeted within the range (high and low) and the adsorption capacity (response) was targeted at the maximum. The program integrates individual factors at tuneable levels and output response (a–e). Variation of the factors produces an important result which leads to optimal conditions. Notably, time was not a crucial factor for this experiment; a time of 5 min was enough to obtain a 44.2 mg/g adsorption performance (). When the factors were varied between extreme conditions an optimal response of 48.4 mg/g was obtained as seen in the cube plot (); the extreme conditions include a concentration set at maximum (300 mg/dm3), an adsorbent weight minimum (100 mg) and time of 30 min. The cube plot represents the effect of three factors simultaneously, showing the predicted values from the coded model for the combinations of the −1 and +1 levels of the three factors.
Fig. 8 Desirability ramp for numerical optimization for independent factors (initial concentration, adsorbent weight, time), and response (adsorption capacity).
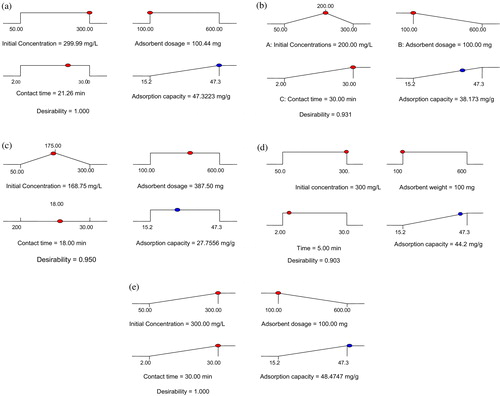
Fig. 9 Cube plot for surface response of MB adsorption onto plantain peels carbon.
4 Conclusion
Activated carbon prepared from plantain peels is suitable for MB adsorption from simulated dye wastewater. Its performance suggests that it is applicable to the treatment of industrial dye wastewater. The good adsorption capacity of the CAPP is closely related to its high SBET and mesopore size distribution. FTIR analysis of the carbon surface revealed functional groups that are involved in adsorption through interactions with dye molecules. The mechanism of adsorption shown by FTIR, conformity of adsorption to Temkin and D–R isotherms, and pseudo-second-order kinetic models revealed an endothermic chemisorption process. With the help of Box–Behnken design of RSM, two factors, namely, initial dye concentration and adsorbent weights, are identified to significantly favour the adsorption process.
Acknowledgements
The authors thank members of Laboratory of Catalysis, State Key Laboratory of Heavy Oil processing, China University of petroleum for use of their facilities for adsorbent characterization.
Notes
Peer review under responsibility of Taibah University.
References
- M.AsadullahM.S.KabirM.B.AhmedN.A.RazakN.S.A.RasidA.AezziraRole of microporosity and surface functionality of activated carbon in methylene blue dye removal from waterKorean J. Chem. Eng.30201322282234
- B.S.GirgisA.-N.A.El-HendawyPorosity development in activated carbons obtained from date pits under chemical activation with phosphoric acidMicropor. Mesopor. Mater.522002105117
- N.Karatepeİ.OrbakR.YavuzA.ÖzyuğuranSulfur dioxide adsorption by activated carbons having different textural and chemical propertiesFuel87200832073215
- O.S.BelloK.A.AdegokeA.A.OlaniyanH.AbdulazeezDye adsorption using biomass wastes and natural adsorbents: overview and future prospectsDesalin. Water Treat.53201512921315
- M.CobasM.SanrománM.PazosBox–Behnken methodology for Cr (VI) and leather dyes removal by an eco-friendly biosorbent: F. vesiculosusBioresour. Technol.1602014166174
- D.PodstawczykA.Witek-KrowiakK.ChojnackaZ.SadowskiBiosorption of malachite green by eggshells: mechanism identification and process optimizationBioresour. Technol.1602014161165
- G.O.El-SayedRemoval of methylene blue and crystal violet from aqueous solutions by palm kernel fiberDesalination2722011225232
- E.I.InamU.J.EtimE.G.AkpabioS.A.UmorenSimultaneous adsorption of lead (II) and 3,7-bis (dimethylamino)-phenothiazin-5-ium chloride from aqueous solution by activated carbon prepared from plantain peelsDesalin. Water Treat.201511410.1080/19443994.2015.1010236
- V.GuptaApplication of low-cost adsorbents for dye removal – a reviewJ. Environ. Manage.90200923132342
- M.AsadullahM.AsaduzzamanM.S.KabirM.G.MostofaT.MiyazawaChemical and structural evaluation of activated carbon prepared from jute sticks for Brilliant Green dye removal from aqueous solutionJ. Hazard. Mater.1742010437443
- M.AsadullahI.JahanM.B.AhmedP.AdawiyahN.H.MalekM.S.RahmanPreparation of microporous activated carbon and its modification for arsenic removal from waterJ. Ind. Eng. Chem.202014887896
- O.AdeyiO.S.AyandaG.O.OlutonaO.GaniyuAdsorption kinetics and intraparticulate diffusivity of aniline blue dye onto activated plantain peels carbonChem. Sci. Trans.2012
- J.M.DiasM.C.Alvim-FerrazM.F.AlmeidaJ.Rivera-UtrillaM.Sánchez-PoloWaste materials for activated carbon preparation and its use in aqueous-phase treatment: a reviewJ. Environ. Manage.852007833846
- A.AhmadM.LohJ.AzizPreparation and characterization of activated carbon from oil palm wood and its evaluation on methylene blue adsorptionDyes Pigm.752007263272
- B.OpeoluO.FatokiDynamics of zinc sorption from aqueous matrices using plantain (Musa sp.) peel biomassAfr. J. Biotechnol.1120121319413201
- S.IdowuS.OniA.AdejumoBiosorption of chromium (VI) from aqueous solution by biomass of plantain (Musa paradisiaca) peel residueAfr. J. Med. Phys. Biomed. Eng. Sci.3201122
- O.AkporC.NwonumaT.Edewor-KuponiyiO.AmiraThe role of ripe Musa sapientum (plantain) peels in the removal of phosphorus and nitrogen from aqueous solutionJ. Biol. Agric. Health320138596
- M.GhaediS.N.KokhdanRemoval of methylene blue from aqueous solution by wood millet carbon optimization using response surface methodologySpectrochim. Acta A1362015141148
- S.DuttaA.BhattacharyyaA.GangulyS.GuptaS.BasuApplication of response surface methodology for preparation of low-cost adsorbent from citrus fruit peel and for removal of methylene blueDesalination27520112636
- M.D.PavlovićA.V.BuntićK.R.MihajlovskiS.S.Šiler-MarinkovićD.G.AntonovićŽ.RadovanovićS.I.Dimitrijević-BrankovićRapid cationic dye adsorption on polyphenol-extracted coffee grounds—a response surface methodology approachJ. Taiwan Inst. Chem. Eng.45201416911699
- G.E.BoxK.WilsonOn the experimental attainment of optimum conditionsJ. R. Stat. Soc. Ser. B131951145
- R.H.MyersD.C.MontgomeryC.M.Anderson-CookResponse Surface Methodology: Process and Product Optimization Using Designed Experiments3rd ed.2009John Wiley & SonsNew York
- F.GhorbaniH.YounesiS.M.GhasempouriA.A.ZinatizadehM.AminiA.DaneshiApplication of response surface methodology for optimization of cadmium biosorption in an aqueous solution by Saccharomyces cerevisiaeChem. Eng. J.1452008267275
- G.E.BoxD.W.BehnkenSome new three level designs for the study of quantitative variablesTechnometrics21960455475
- P.S.KumarS.RamalingamC.SenthamaraiM.NiranjanaaP.VijayalakshmiS.SivanesanAdsorption of dye from aqueous solution by cashew nut shell: studies on equilibrium isotherm, kinetics and thermodynamics of interactionsDesalination26120105260
- O.OlorundareR.KrauseJ.OkonkwoB.MambaPotential application of activated carbon from maize tassel for the removal of heavy metals in waterPhys. Chem. Earth502012104110
- Y.GaoQ.YueB.GaoY.SunOptimization preparation of activated carbon from Enteromorpha prolifra using response surface methodology and its adsorption studies of fluoroquinolone antibioticsDesalin. Water Treat.2014113
- F.AhmadW.M.A.W.DaudM.A.AhmadR.RadziCocoa (Theobroma cacao) shell-based activated carbon by CO2 activation in removing of cationic dye from aqueous solution: kinetics and equilibrium studiesChem. Eng. Res. Des.90201214801490
- S.AltenorB.CareneE.EmmanuelJ.LambertJ.-J.EhrhardtS.GaspardAdsorption studies of methylene blue and phenol onto vetiver roots activated carbon prepared by chemical activationJ. Hazard. Mater.165200910291039
- S.WangZ.ZhuA.CoomesF.HaghsereshtG.LuThe physical and surface chemical characteristics of activated carbons and the adsorption of methylene blue from wastewaterJ. Colloid Interface Sci.2842005440446
- Y.El-SayedT.J.BandoszAdsorption of valeric acid from aqueous solution onto activated carbons: role of surface basic sitesJ. Colloid Interface Sci.27320046472
- N.F.CardosoR.B.PintoE.C.LimaT.CalveteC.V.AmaviscaB.RoyerM.L.CunhaT.H.FernandesI.S.PintoRemoval of remazol black B textile dye from aqueous solution by adsorptionDesalination269201192103
- U.J.EtimS.AUmorenU.M.EduokCoconut coir dust as a low cost adsorbent for the removal of cationic dye from aqueous solutionJ. Saudi Chem. Soc.201210.1016/j.jscs.2012.09.014
- I.LangmuirThe constitution and fundamental properties of solids and liquids. Part I. SolidsJ. Am. Chem. Soc.38191622212295
- K.FooB.HameedInsights into the modeling of adsorption isotherm systemsChem. Eng. J.1562010210
- M.TemkinV.PyzhevRecent modifications to Langmuir isothermsActa Physicochim. USSR121940217222
- M.DubininL.RadushkevichEquation of the characteristic curve of activated charcoalChem. Zentr.11947875
- X.-W.WuH.-W.MaY.-R.ZhangAdsorption of chromium (VI) from aqueous solution by a mesoporous aluminosilicate synthesized from microclineAppl. Clay Sci.482010538541
- M.E.ArgunS.DursunC.OzdemirM.KaratasHeavy metal adsorption by modified oak sawdust: thermodynamics and kineticsJ. Hazard. Mater.14120077785
- S.TahirN.RaufRemoval of a cationic dye from aqueous solutions by adsorption onto bentonite clayChemosphere63200618421848
- A.ZahangirS.A.MuyibiJ.ToramaeStatistical optimization of adsorption processes for removal of 2,4-dichlorophenol by activated carbon derived from oil palm empty fruit bunchesJ. Environ. Sci.192007674677
- M.H.IsaE.H.EzechiZ.AhmedS.F.MagramS.R.M.KuttyBoron removal by electrocoagulation and recoveryWater Res.512014113123
- H.ZhangX.RanX.WuD.ZhangEvaluation of electro-oxidation of biologically treated landfill leachate using response surface methodologyJ. Hazard. Mater.1882011261268
- K.RavikumarK.PakshirajanT.SwaminathanK.BaluOptimization of batch process parameters using response surface methodology for dye removal by a novel adsorbentChem. Eng. J.1052005131138
- R.J.RossiApplied Biostatistics for the Health Sciences2010John Wiley & SonsNew Jersey