
 ?Mathematical formulae have been encoded as MathML and are displayed in this HTML version using MathJax in order to improve their display. Uncheck the box to turn MathJax off. This feature requires Javascript. Click on a formula to zoom.
Abstract
A series of quaternary glass systems with the composition 79TeO2-(20−x)Nb2O5-xB2O3-1V2O5 was prepared using the melt quench technique. Such studies as optical absorption, Raman, FTIR spectroscopy, EPR and DSC were carried out on the glass system. The physical properties, such as density (ρ) and molar volume (VM), were determined. The Urbach energy (ΔE), optical band gap (Eopt), optical basicity (Λ), refractive index (n) and electron polarizability (α) of the glasses were determined from optical absorption data. Spin-Hamiltonian parameters of VO2+ ions were calculated from the EPR data. With the gradual substitution of B2O3 at the expense of Nb2O5, the density and optical band gap of the glasses decreased, and the electronic polarizability increased. EPR spectra revealed that VO2+ occupies an octahedral site with tetrahedral compression. Spin-Hamiltonian parameters g|| and g⊥ increased as B2O3 content increased in the glass. The glass transition temperature (Tg) also decreased as the B2O3 content in the glass increased.
Keywords:
1 Introduction
From recent research investigating tellurium glasses containing B2O3, it is observed that these glasses are potential materials for the optical fibre industry because of their good visible and infrared (IR) transparencies [Citation1–Citation3]. The glasses have good chemical stability and high values of non-linear refractive index. Tellurium niobate glasses containing B2O3 possess a wide infrared window and ultra-fast, non-linear optical response; they have demonstrated excellent nonlinear performances. These materials have found wide application in IR domes, optical filters and modulators. They are potential materials for optical memory devices and laser windows. Tellurium niobate glasses have been widely studied by various researchers due to their novel applications. It has been reported that tellurium cannot be vitrified alone via the traditional method. High transparent tellurium glasses can be obtained by introducing other metal oxides [Citation4]. These oxides include transition metal oxides, alkaline oxides and alkaline earth oxides. Tellurium glasses with A2O3 (A = B2O3, Bi2O3, Al2O3) oxides have high third-order non-linear (TONL) susceptibility. Research has been conducted on TeO2-Nb2O5-Bi2O3 glasses, and these glasses exhibit good optical properties, such as large refractive index values and energy band gaps. Tellurium glasses with oxides such as A2O3 exhibit semiconducting properties [Citation5]. Research has been conducted on TeO2-Nb2O5-Bi2O3 glasses. It is reported that TeO2-Nb2O5-Bi2O3 possesses good performance because of low phonon energy for tellurium glasses. Research has been focused on producing new tellurite glasses of improved optical properties. The physico-chemical properties and thermal properties of TeO2-Nb2O5-Bi2O3 glasses have been reported [Citation6]. To the best of our knowledge, glasses with 79TeO2-(20−x)Nb2O5-xB2O3-1V2O5 have not been studied and investigated. From the previous studies on these glass systems, it is clear that at low concentrations of A2O3, the nonlinear susceptibility of the glass is less, and as the A2O3 concentration increases, the susceptibility increases. High refractive indices of these glasses were explained based on the electronic polarizability and optical basicity. It has been reported that the decay of the second harmonic intensity is reduced by the addition of Al2O3 in TeO2 glasses [Citation7]. The origin of nonlinearity in tellurium glasses is due to the addition of A2O3 to tellurium glasses having effects similar to silicon and phosphate glasses. A careful selection of glass composition is required to obtain a glass sample with large second harmonic generation (SHG) and high refractive index values [Citation8]. It has been reported that Bi2O3 is used in ceramic materials and optical fibres because of its high refractive index [Citation9]. It is also used in the electronic field due to it having a high valence cation of low field strength and high polarizability. The aim of this work is to analyze the optical, structural and thermal properties of tellurium niobate glasses containing B2O3 and to present the correlation between glass structure and the optical and thermal properties. In our present system, we have chosen four glasses with the above mentioned composition. B2O3 is chosen as the oxide glass former, and the changes in the glass structure with the variation in the modifier oxide are studied.
Table 3 FTIR bands positions of the glass system 79TeO2-(20−x)Nb2O5-xB2O3-1V2O5.
Table 4 Assignment of FTIR bands of the glass system 79TeO2-(20−x)Nb2O5-xB2O3-1V2O5.
Table 5 Raman bands positions of the glass system 79TeO2-(20−x)Nb2O5-xB2O3-1V2O5.
Table 6 Assignment of Raman bands of the glass system 79TeO2-(20−x)Nb2O5-xB2O3-1V2O5.
2 Experimental
The composition of the glass samples is listed in . All samples were prepared by using the following starting chemical constituents: TeO2 (99.9% Sigma Aldrich), B2O3 (99.9% Sd Fine), Nb2O5 (99.9% Sd Fine) and V2O5 (99.9% Sd Fine). Composition of the glass chosen was 79TeO2-(20−x)Nb2O5-xB2O3-1V2O5 (x = 5, 10, 15 and 20 mol%). Required quantities of chemicals were carefully mixed in a porcelain crucible and melted in an electrical furnace at approximately 850–950 °C, depending on the composition, for one hour. The melt was then poured onto a steel plate and then pressed with another steel plate, both of which were maintained at approximately 200 °C. All the samples were bubble free and light brown in colour. The samples were moved to an annealing furnace, where they were heated at 300 °C for approximately five hours and then cooled to room temperature. X-ray diffractograms of the samples were recorded using a copper target (kα = 1.54 Å) on a Philips PW (1140) diffractometer at room temperature. The densities of the glasses were measured at room temperature via the Archimedes method, using xylene (ρ = 86 g/cc) as the immersion liquid. From the density values, the molar volumes of the glasses were determined. The Fourier transform infrared spectra of the glass samples were taken using a Perkin-Elmer FT-IS spectrometer model 1605 in the wave number range of 2000–400 cm−l. KBr pellets were used to record the FTIR spectra of the glass samples. Raman spectra of the samples were recorded by a micro-Raman spectrometer (LABRAM-HR) using laser excitation lines of 632.8 nm (He–Ne) at room temperature. All measurements were made in a back scattering geometry, using a 20× microscope objective lens with a numerical aperture of 0.75. Typical laser power at the sample surface was 2.4 mW, with a spot size of 2 μm in diameter. The optical absorption spectra were recorded by using a double beam Shimadzu UV-3100 spectrometer in the wavelength range of 350–800 nm at room temperature, with air as the reference medium. Disc-shaped glass samples (1 mm thickness) were used to record the optical absorption spectra. The EPR spectra of the samples were measured using a JEOL-JM Fe 3 EPR spectrometer that works in the X-band frequency range. Differential scanning calorimetry (DSC) of the samples was carried out using a DSC Q-20 Instrument operated up to 600 °C with a heating rate of 10 °C.
Table 1 Composition of glass system 79TeO2-(20−x)Nb2O5-xB2O3-1V2O5.
3 Results and discussion
3.1 X-ray diffraction (XRD)
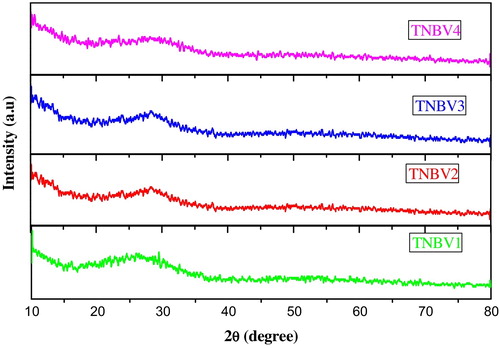
The X-ray diffraction patterns of the glass samples (shown in ) did not show any discrete or sharp peaks, indicating the amorphous nature of the prepared glass samples.
Fig. 1 XRD spectra of TNBV glass system.
3.2 Physical properties of the samples
The physical properties of the glass system 79TeO2-(20−x)Nb2O5-xB2O3-1V2O5 were investigated by measuring the densities of the glass samples. The density and the oxygen molar volume of the glasses were calculated using the following equation.(1)
(1)
Here, ‘a’ is the weight of the glass sample in air and ‘b’ is the weight of the glass sample when immersed in xylene. ρx is the density of xylene, which is 0.865 g/cm3. The molar volume is given by the equation(2)
(2)
Oxygen packing fraction (OPD) is given by(3)
(3)
The oxygen molar volume V0 is given by the equation(4)
(4) where Mi is the molecular weight, xi is the mole fraction of each component, ρ is the density of the glass, ni is the number of oxygen atoms in each constituent oxide and C is the number of oxygen atoms per formula unit.
Densities of the samples TNBV1–TNBV4 were calculated. Molar volume, oxygen molar volume and oxygen packing fraction for each sample were calculated from the density values; the values are presented in . The density of the samples was in the range of 5.38–5.07 g/cc. On the other hand, the molar volume increased from 26.56 to 29.87 cm3/mol. Moreover, the density of the samples decreased as the B2O3 content increased; hence, the molar volume increased. The variation in the density values of the glasses is attributed to the structural rearrangement of atoms inside the glass upon addition of B2O3 to TeO2. The molecular weight of B2O3 (69.61 g/mol) is lower than that of Nb2O5 (265.81 g/mol); thus, the density of the glasses decreases as B2O3 replaces Nb2O5 inside the glass matrix [Citation10]. This will result in a decrease in strong connectivity in the glass network. The compactness of the glass network decreases. NBOs created in the glass due to the introduction of B2O3 alter the structure of the glass in such a way that the density of the glass decreases as B2O3 increases [Citation11,Citation12]. An increase in molar volume indicates that these glasses have a more disordered structure due to the increase in the free volume. Changes in molar volume are attributed to changes in structure caused by an increase in inter-atomic spacing, which in turn decreases the stretching force constant of the bonds inside the glassy network, resulting in less compact glass. The decrease in oxygen packing density from TNBV1 to TNBV4 is due to the decrease in the number of oxygen atoms per unit composition.
Table 2 Physical and optical parameters of glass system 79TeO2-(20−x)Nb2O5-xB2O3-1V2O5.
3.3 Fourier transform infra-red spectra (FTIR)
The FTIR spectra of the quaternary glass system 79TeO2-(20−x)Nb2O5-xB2O3-1V2O5 in the range of 2000–400 cm−1 is shown in . FTIR bands of the glasses and their assigned vibrational modes are listed in and . For TNBV1 glass system, bands are observed at 468 cm−1, 661 cm−1, 787 cm−1, 930 cm−1, and 1213 cm−1. The band at 468 cm−1 is attributed to symmetrical stretching or bending vibrations of the Te–O–Te linkages, which are formed by corner sharing of (TeO4), (TeO3+1) and (TeO3) units; this band is also assigned to the bending vibrations of O–B–O bonds [Citation13–Citation15]. The intense band at 661 cm−1 observed is due to the stretching vibrations of Te–O bonds in [TeO4] trigonal bipyramidal (tbp) units. The band at 787 cm−1 is attributed to the stretching vibrations of Te–O bonds in [TeO3] trigonal pyramidal (tp) units inside the glass network. From the studies on tellurium glasses, it is noted that the structure of these glasses is made up of TeO4 trigonal bipyramid (tbp) units [Citation16,Citation17]. It has been reported that the FTIR spectra of B2O3 containing glasses occur mainly in three regions. The range between 1200 and 1400 cm−1 is from borate units, in which boron is connected to three oxygens [BO3]. The region from 900 to 1100 cm−1 is due to boron in tetrahedral oxygen coordination, i.e., [BO4] units. Bands in the range of 430–470 cm−1 are due to the manifestation of O–B–O bending units [Citation18]. For the present glass system, the band observed at 930 cm−1 is due to the stretching vibrations of Nb–O bonds in [NbO6] octahedra that formed in the glass network; this band is also ascribed to the B–O stretching vibrations of BO4 units. The decrease in the intensity of the band at 930 cm−1 indicates the breakage of B–O bonds in BO4 units and successive conversion of (BO3)3− orthoborate and BO3 triangular units [Citation19]. The band at 1213 cm−1 is due to the [BO3] vibrational units in the glass system.
Fig. 2 FTIR spectra of TNBV glass system.
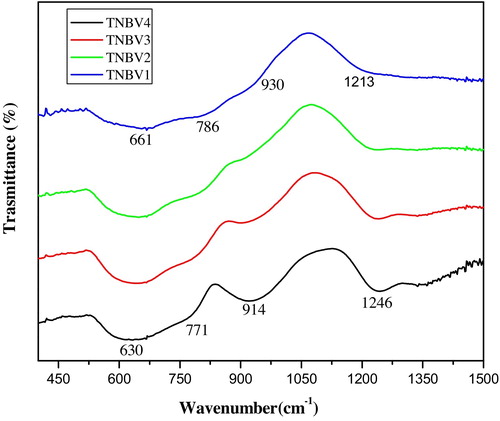
As the B2O3 concentration increases from 5 to 20 mol% from the TNBV1 to TNBV4 glass system, the band at 468 cm−1 shifts to 441 cm−1. The band at 661 cm−1 shifts to 630 cm−1, while the band at 787 cm−1 shifts to 771 cm−1. Initially, when B2O3 is added to TeO2, Te–O–B bridge structures are formed inside the glass. Further addition of B2O3 results in cleavage of Te–O–Nb bonds taking place and the formation of Te–O–B bonds increasing. In addition to the formation of these bonds, [BO4] units are converted into [BO3] units. This is explained by the increase in the band from 1213 cm−1 to 1245 cm−1 from the TNBV1 to TNBV4 glass system. When the B2O3 content in the glass is 5 mol%, there are Te–O–B bonds; as the boron content in the glass increases, non-bridging oxygens (NBO) are formed. The presence of these bonds is confirmed by the FTIR bands in the range of 630 cm−1 [Citation20]. The introduction of B2O3 changes some of the [TeO4] units into [TeO3] units. From spectra, it is clear that glass consists of TeO3 (tp) and TeO4 (tbp) units. As the concentration of B2O3 increases, the band at 661 cm−1 shifts towards a lower wave number (630 cm−1), which is the characteristic band of [TeO4] trigonal bipyramids (tbp), and the band at 787 cm−1 shifts to 770 cm−1, which is the characteristic band of [TeO3] trigonal pyramids (tp) in glass. The intensity of the bands related to Te–O stretching vibrations of [TeO4] increased, while the intensities of bands corresponding to stretching vibrations of [TeO3] units decreased. The band at 930 cm−1 is the characteristic band of [BO4] units; this band shifts to 914 cm−1 as B2O3 content increases, indicating a decrease in [BO4] units in the glass network. The role of B2O3 is to break the three-dimensional network and hence create non-bridging oxygens (NBOs). These NBOs have ionic character and much lower bond energies [Citation21]. The NBOs increase as B2O3 content in the glass increases. Our results are in good agreement with the previous work conducted by researchers on the heavy metal oxide-based TeO2 glass [Citation22].
3.4 Raman spectra
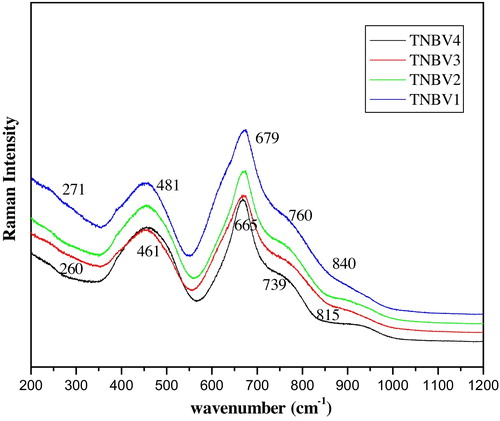
The Raman spectroscopic studies are carried out on the glass system 79TeO2-(20−x)Nb2O5-xB2O3-1V2O5. Raman spectra of the glasses help to unravel the presence of various structural units, as well as changes in the structural units with the addition of modifier ions. The Raman spectrum is complimentary to FTIR spectra and is as shown in . The assignment of Raman bands is given in and . Five major Raman bands are observed: Band1: 250–275 cm−1, Band2: 460–480 cm−1, Band3: 660–685 cm−1, Band4: 720–770 cm−1 and Band5: 820–915 cm−1. Band1 is due to the stretching vibrations of Te–O–B linkages [Citation23]. Te–O–Te linkages can also be explained by the peak near 460 cm−1. A band at 460 cm−1 is observed in most of the tellurium glasses, which represents Te–O–Te linkages. The band at 660–685 cm−1 is due to the stretching vibrations of [TeO4] structural units [Citation24]. The stretching vibrations of [TeO3] structural units are presented by the band in the range of 720–775 cm−1. The presence of B–O–B bonds in boroxyl rings is also explained by the peak of approximately 720–760 cm−1. The B–O–B bonds in the form of boroxyl rings are confirmed by the presence of this band [Citation25]. The spectra reveal the presence of NBO6 octahedra, which is the characteristic band for the tellurium niobate glasses and is represented by the band at approximately 815–870 cm−1. From the spectra, it is observed that with gradual substitution of the modifier oxide Nb2O5, significant changes are observed in Raman spectrum for TNBV4 to TNBV1. The peak at 679 cm−1 shifts to 665 cm−1 and the peak at 760 cm−1 shifts to 739 cm−1; this is because [TeO3] units increase as B2O3 content increases [Citation26]. Due to the formation of NBO, as B2O3 oxide content increases, the bands shift to lower wave numbers.
Fig. 3 Raman spectra of TNBV glass system.
3.5 DSC analysis
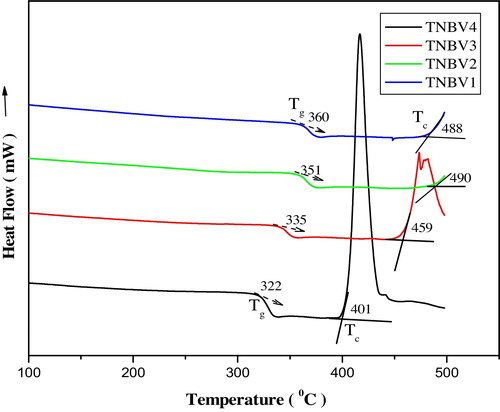
The DSC curves of the glass system 79TeO2-(20−x)Nb2O5-xB2O3-1V2O5 are as shown in . DSC is useful in suggesting structural changes that take place due to compositional changes. The thermal analyses of the glass samples are made for the glass systems in the temperature range of 50–500 °C. The glass transition temperatures (Tg), crystallization temperature (Tc), and thermal stability (ΔT) of the glasses are calculated and listed in . B2O3 is a glass former, and when combined with TeO2, Te–O–B bonds are formed in the system [Citation27,Citation28]. Boron exists in the form of [BO3] and [BO4] structural units in borate containing glasses. The transition temperature is a function of glass composition and also depends on the bond strength, crosslink density and closeness of packing. Thus, it is important to correlate the transition temperature of a glass system with the enthalpy of atomization. Tg represents the temperature above which an amorphous matrix can attain various structural configurations and below which the matrix is frozen into a structure that cannot easily change into another structure [Citation29]. The variation of transition temperature in the present glass system can be explained as follows. The bond dissociation energy of Nb–O is 753 kJ/mol and that of B–O is 806 kJ/mol [Citation30]. The bond dissociation energy or the bond dissociation enthalpy is more for B–O bonds because the bond length of a B–O bond is less than that of a Nb–O bond. The lower the bond length, the higher the bond strength. Thus, the atoms are closely packed and more energy is required to dissociate B–O bonds, but the molar volume of the glass increases as B2O3 content in the glasses increases and the transition temperature decreases as B2O3 increases; this shows that Tg is very sensitive to any change of coordination number of glass forming atoms and also the formation of NBOs in the glass system [Citation31]. As the boron content inside the glass system increases, the non-bridging bonds increase. This will decrease the glass stability; as a result, the glass transition temperature also decreases [Citation32,Citation33]. From the DSC thermogram, it is observed that for the TNBV4 glass system, the crystallization temperature is approximately 401 °C, whereas the other glass samples do not show onset crystallization near this temperature; rather, they crystallize at higher temperatures; as a result, thermal stability against crystallization is high. We have noted that the density of the glass samples decreases as B2O3 content increases. As the molar volume of the glass samples increases, the number of Te–O–B bonds per unit volume inside the glass increases. Te–O–B units are loosely packed due to the increase of free volume inside the glass and the decrease in rigidity [Citation34]. The average cross link density of the glasses increases as B2O3 content increases and as Te–O–B linkages increase and replace the Te–O–Nb bonds inside the glass matrix. The average cross link density and number of bonds per unit volume have a direct link with Tg of the glass [Citation35,Citation36]. As a result, the NBOs inside the glass increase and there is variation in the glass transition temperature.
Fig. 4 DSC plots of TNBV glass system.
3.6 Optical absorption spectra
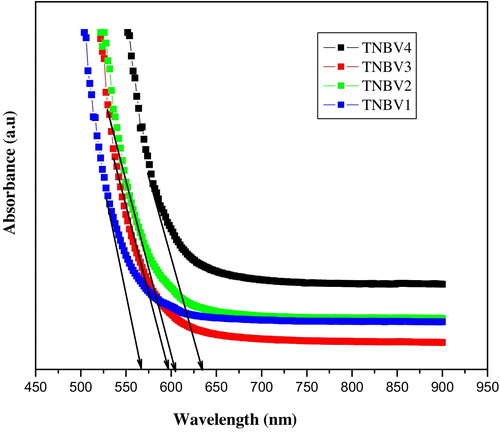
The optical absorption spectra of the 79TeO2-(20−x)Nb2O5-xB2O3-1V2O5 glass system are recorded in the wavelength range of 350–900 nm at room temperature and are shown in . From the figure, it is clear that each glass shows a distinct cut-off wavelength (λc). The cut-off wavelength λc values are presented in . It is found that the optical absorption edge is not sharply defined in the present glasses, which clearly indicates their glassy nature [Citation37]. The fundamental absorption edge for TNBV1 at 568 nm is shifted to a higher wavelength (632 nm) as B2O3 content increases from 5 to 20 mol%. Shifting of the absorption edge to a higher wavelength is due to the variation of molar volume and oxygen packing density with the incorporation of B2O3 inside the glass.
Fig. 5 Optical absorption spectra of TNBV glass system.
The absorption coefficient can be determined near the edge by using the following equation(5)
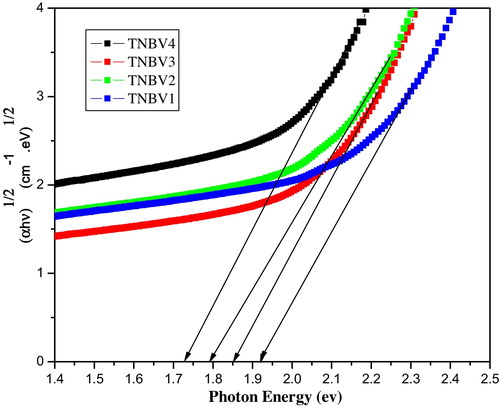
(5) where t is the thickness of the sample and ln(I/I0) corresponds to absorbance. We calculate the photon energies from the wavelength and plot a graph between E and (αE)1/2. The relationship between the optical bandgap energy (Eopt) and absorption coefficient α(ω) is given by the equation
(6)
(6)
This relation was proposed by Davis and Mott [Citation38–Citation40], where Eopt is the optical band gap, A is a constant and p takes values based on the mechanism of inter-band transitions. According to Tauc’s relations for amorphous materials, indirect transitions are valid. Moreover, the relationship between the bandgap and the molar refractive index n is examined by the equation(7)
(7)
The band gap of each sample is determined from the curves drawn with energy (E) values on the x-axis and (αhν)1/2 values on the y-axis. The band gap plot for all four glasses is shown in . The band gap values are in the range of 1.93–1.72. From the values of band gap, it is clear that the band gap decreases as the borate content increases from x = 5 to x = 20 mol%. The optical absorption coefficient just below the absorption edge varies exponentially with photon energy, indicating the presence of an Urbach tail. Initially, when B2O3 is added to TeO2, NBOs are formed in the system. In our system, the B2O3 content increases from TNBV1 to TNBV4, which results in an increase in NBOs in the glass system. As a result of the replacement of B2O3 with Nb2O5, the structural changes take place inside the glass. As B2O3 in the glass matrix increases, B–O–Te is replaced with Nb–O–Te and hence the stability of the glass is also decreased. These structural changes will result in shifting of the valence band maximum to higher energies, thus reducing the band gap of the glass system.
Fig. 6 Band gap plots of TNBV glass system.
In glasses and amorphous materials, there exists band tailing in the forbidden energy band gap. The extent of band tailing is a measure of the disorder in the material and can be estimated using the Urbach rule. In many crystalline and non-crystalline semiconductors, αω depends exponentially on ħω. This exponential dependence is known as the Urbach rule. The Urbach rule is given by the equation(8)
(8)
Urbach plots for the four glass samples are plotted in . From the slope of the graph, the Urbach energies are determined. The Urbach energies are listed and decrease as the Nb2O5 content inside the glass decreases. The Urbach energies for TNBV1 to TNBV4 glasses varies from 0.25 to 0.19 eV. The optical basicity of an oxide glass will reflect the ability of the glass to donate negative charge to a probe ion [Citation41]. The optical basicity calculations have been carried out using the following equations. For this, the optical basicities assigned to individual oxides are taken into account. According to Duffy and Ingram, the optical basicity is calculated as Λth = X1Λ1 + X2Λ2 + ⋯ + XnΛn, where Λ1, Λ2, Λn are the basicity values assigned to individual oxides and X1, X2, Xn are the equivalent fractions based on the amount of oxygen each oxide contributes to the overall glass stoichiometry. Optical basicity facilitates understanding the types of bonds present inside the glasses; a higher value of basicity denotes a more ionic bonding. The electronic polarizability of an oxide ion can be calculated based on Eopt and molar volume VM using the equation
(9)
(9) where VM is the molar volume, Eopt is the optical band gap energy, αo is the polarizability of a cation, and p and q represent the number of cation and oxide ions, respectively, in the chemical oxide of the form ApOq.
Fig. 7 Urbach plots of TNBV glass system.
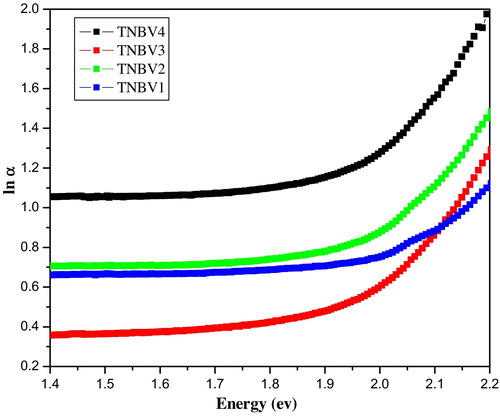
The optical basicity and electronic polarization values are calculated and listed in . There is an increase in optical basicity and electronic polarization as B2O3 increases. This could be due to the basicity of B2O3 being larger than the basicity of Nb2O5; the values are in agreement with the studies conducted by other researchers on other tellurium glasses. The variation of the band gap and Urbach energies can be explained by the structural changes caused inside the glass due to the addition and increase of Nb2O5. This confirms that the optical properties of these glasses are enhanced by the addition of Nb2O5 and B2O3 to the glass network.
The metallization criterion for the glasses is calculated using the equation given below.(10)
(10) where RM is the molar refraction and VM is the molar volume of the given glass sample.
The glasses reported here possess the metallization criterion in the range from 0.3707 to 0.3221. TNBV1 has the largest value (M = 0.3707) and TNBV4 has the smallest value (M = 0.3221). A larger metallization criterion value indicates a larger band gap between valence and conduction bands. The metallization criterion for most of the tellurium glasses could range from 0.30 to 0.45. The range of the metallization criterion for the present glass system falls into this range.
3.7 Electron paramagnetic resonance spectra
The EPR spectra of the 79TeO2-(20−x)Nb2O5-xB2O3-1V2O5 glass system are shown in . The spectra show the structure, which is due to the hyperfine interaction of a single, unpaired electron with the vanadium nucleus, whose nuclear spin is 7/2. Vanadium complexes are studied via EPR spectroscopy because they have one unpaired electron and possess characteristic spectra. Electron paramagnetic resonance (EPR) spectroscopy of transition metal (TM) ions in glasses is the most widely used research subject and helps in identifying the local environment of paramagnetic impurity and mapping the crystal field [Citation42,Citation43]. In our present glass system, we have doped each sample with 1 mol% of V2O5. VO2+ has been used as a spectroscopic probe for the characterization of glasses because their EPR spectra are rich in hyperfine structures due to the 51V nucleus and are easily observable at room temperature. The EPR spectra have been analyzed assuming that vanadium is present as VO2+ ions in a ligand field of C4v symmetry. Spin-Hamiltonian parameters (SHP) are calculated using the equations given by Hecht et al. [Citation44]. The solution for the Spin-Hamiltonian was suggested by Bleaney [Citation45].(11)
(11) where H is the axial Spin-Hamiltonian and Hx, Hy and Hz are the static magnetic field components. Hyperfine splitting constants A11 and A⊥ are calculated using the equations below.
(12)
(12)
(13)
(13) where z is the symmetry axis, S is the electron spin operator, I is the nuclear spin operator and β is the Bohr magneton. g⊥ and g|| are perpendicular and parallel components, respectively, of the g tensor. A|| and A⊥ are the parallel and perpendicular components, respectively, of hyperfine tensor A. The crystal fields of V4+ ions inside the glasses are described either by three- or four-fold symmetries. The deviation of octahedral symmetry varies the g|| and g⊥ values and is due to a change in the environment of V4+ in the ligand field at the site of V4+. As the B2O3 content is varied, it is observed that tetragonal distortion varies. This variation is non-linear around the VO2+ ion [Citation46,Citation47].
Fig. 8 EPR spectra of TNBV glass system.
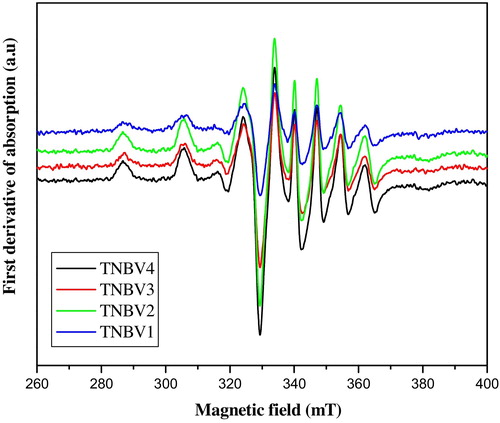
It is clear from the figure that the field positions of parallel and perpendicular peaks depend on the glass composition. The Spin-Hamiltonian parameters (SHP) are calculated from the equations assuming that the vanadium is present as VO2+ ions. Spin-Hamiltonian parameters g||, g⊥, A|| and A⊥ for the TNBV1 to TNBV4 system are listed in . g||, g⊥, A|| and A⊥ increase from TNBV1 to TNBV4. In the present glass system, we have chosen the composition of B2O3 from x = 5–20 mol% and it is clear that the EPR spectrum has a dependence on the composition of the glass. From the spectra, it is clear that vanadium is present in the coordinated distorted octahedral symmetry, the degree of distortion being a function of the composition of the glass. The Spin-Hamiltonian parameters listed are in good agreement with other systems containing vanadium. We have obtained g|| < g⊥ < ge and A|| > A⊥ for all four glass systems. This confirms that vanadium occupies an octahedral site with tetragonal compression [Citation48–Citation50]. Δg||/Δg⊥ is calculated and listed for each sample. Δg||/Δg⊥ is a measure of tetragonal distortion and varies nonlinearly for each sample; this is due to the variation of the ligand field around the transition metal site. The structural changes are in agreement with FTIR spectra, where TeO4 units are partially converted into TeO3+1 and TeO3 units with the variation of B2O3 and Nb2O5 in the glass system. As Δg||/Δg⊥ decreases, there is an improvement in octahedral symmetry at the vanadium ion site and the degree of distortion dependent on the composition of the glass.
Table 7 Spin-Hamiltonian parameters of glass system 79TeO2-(20−x)Nb2O5-xB2O3-1V2O5.
4 Conclusions
From the experimental results obtained from the systematic study and analysis of the quaternary glass system 79TeO2-(20−x)Nb2O5-xB2O3-1V2O5, it is concluded that optical properties of tellurium glasses are strongly influenced by the introduction of modifier oxide Nb2O5 at the expense of B2O3 in the glass system. From the experimental results, the following conclusions are reached:
| 1. | The band gap values decrease from TNBV1 to TNBV4 and the optical basicity of these glasses increases from TNBV1 to TNBV4. | ||||
| 2. | Urbach energy values decrease as the borate content in the glass increases. Electron polarizability increases from 2.59 to 2.92 from TNBV1 to TNBV4. | ||||
| 3. | From the IR results, it is clear that tellurium exists as [TeO4] and [TeO3] in the glass structure and the number of [TeO4] to [TeO3] units varies as B2O3 content increases. The band shifts to lower frequencies as B2O3 content increases. More and more B–O–Te linkages are formed inside the glass and the stability of the glass increases as B2O3 content decreases. | ||||
| 4. | Raman spectra indicate that TeO4 trigonal bipyramids, TeO3 and TeO3+1 trigonal units, and NbO6 octahedra are the basic structural units of the glass system. From Raman studies, it is observed that with increasing borate content inside the glass, more and more [BO3] structural units are formed, which increases the NBO in the glass network. The formation of NBO causes variation in the structural and optical properties of the glass system. | ||||
| 5. | From DSC studies, it is clear that the transition temperature of the glass increases as borate content in the glass decreases. This implies that the rigidity of glass decreases as boron content increases in the glass matrix. | ||||
| 6. | From EPR studies, it is obvious that g|| is greater than g⊥, vanadium VO2+ is present in the glass in the form of an octahedral coordination with tetrahedral distortion and the ground state is | ||||
Notes
Peer review under responsibility of Taibah University.
Related Research Data
References
- A.E.ErsunduM.CelikbelikS.AydinJ. Non-Cryst. Solids3582012641647
- A.I.SabryM.M.El-SamanoudyJ. Mater. Sci.30199539303935
- R.A.H.El-MallawanyI.A.AhmedJ. Mater. Sci.43200851315138
- SwapnaS.SureshV.ChandraMouliInd. J. Pure Appl. Phys.422004560564
- SureshS.SwapnaV.ChandraMouliFerroelectrics3252005105109
- A.E.ErsunduG.KaradumanM.CelikbelikN.SolakS.AydinJ. Alloys Compd.5082010266272
- S.SakidaJ. Am. Ceram. Soc.842001836842
- J.LiZ.ShianW.YufeiChin. Opt. Lett.2200453
- W.H.DumbaughJ.C.LappJ. Am. Ceram. Soc.75199223152326
- J.S.WangE.M.VogelE.SnitzerOpt. Mater.31994187203
- G.VijayaPrakashD.Narayana RaoA.K.BhatnagarSolid State Commun.11920013944
- H.MoriT.KitamiH.SakataJ. Non-Cryst. Solids1681994157166
- G.UpenderV.KamalakerC.P.VardhiniV.ChandraMouliInd. J. Pure Appl. Phys.472009551556
- T.XuF.ChenS.DaiX.ShenX.YangQ.NieC.LiuJ. Non-Cryst. Solids357201122192222
- V.SreenivasuluG.UpenderSwapnaV.VamsipriyaV.ChandraMouliM.PrasadPhysica B45420146066
- J.ChinnababuV.ChandraMouliInd. J. Pure Appl. Phys.472009241247
- M.ÇelikbilekA.E.ErsunduN.SolakS.AydinJ. Non-Cryst. Solids35720118895
- G.UpenderS.BharadwajA.M.AwasthiV.C.MouliMater. Chem. Phys.1182009298302
- R.A.El-MallawanyTellurite Glasses Handbook Physical Properties and Data2002CRC PressBoca Raton, FL
- Y.B.SaddeekPhilos. Mag.8920094154
- R.A.H.El-MallawanyI.A.AhmedJ. Mater. Sci.43200851315138
- W.L.KonijnendijkJ.M.StevelsJ. Non-Cryst. Solids181975307331
- N.F.MottE.A.DavisElectronic Processes in Non-Crystalline Materials1979Clarendon PressOxford
- V.KamalakerG.UpenderC.H.RameshV.ChandraMouliSpectrochimica892012149154
- E.A.DavisN.F.MottPhilos. Mag.221970903922
- R.El-MallawanyM.D.AbdalhI.A.AhmedMater. Chem. Phys.1092008291296
- B.H.VenkataramanK.B.R.VarmaOpt. Mater.28200614231431
- V.DimitrovS.SakkaJ. Appl. Phys.79199617361740
- K.TerashimaT.H.ShimatoT.YokoPhys. Chem. Glasses381997211217
- V.DimitrovT.KomatsuJ. Ceram. Soc. Jpn.107199910121018
- M.H.R.LankhorstJ. Non-Cryst. Solids2972002210219
- V.DimitrovY.DimitrovA.MonteneroJ. Non-Cryst. Solids18019945157
- V.O.SokolovV.G.PlotnichenkoV.V.KoltashevE.M.DianovJ. Non-Cryst. Solids352200656185632
- G.UpenderM.PrasadV.ChandraMouliJ. Non-Cryst. Solids3572011903909
- R.P.Sreekanth ChakradharK.P.RameshJ.L.RaoJ.Rama KrishnaMater. Res. Bull.40200510281043
- V.VamsiPriyaG.UpenderM.PrasadGlass Phys. Chem.402014144150
- M.D.IngramPhys. Chem. Glasses281987215
- V.DimitrovS.SakkaJ. Appl. Phys.79199617361740
- M.SubhadraP.KistaiahJ. Alloys Compd.5052010634639
- V.DimitrovY.DimitrovA.MonteneroJ. Non-Cryst. Solids18019945157
- B.H.VenkataramanK.B.R.VarmaOpt. Mater.28200614171422
- J.A.DuffyM.D.IngramJ. Non-Cryst. Solids211976373410
- H.HosonoH.KawazoeT.KanazawaJ. Non-Cryst. Solids371980427433
- K.FukimiS.SakkaJ. Mater. Sci.23198828192823
- B.BleaneyK.D.BowersM.H.PryceProc. R. Soc. (London)2281955147154
- H.G.HechtT.S.JohnstonJ. Chem. Phys.4619672334
- B.V.R.ChoudariP.PramodaKumariMater. Res. Bull.341999327342
- I.ArdeleanS.CoraV.LoncoJ. Optoelectron. Adv. Mater.8200618431852
- Y.B.SaddeekPhilos. Mag.8920094154
- F.StuderN.RihB.RaveauJ. Non-Cryst. Solids1071988101117