
 ?Mathematical formulae have been encoded as MathML and are displayed in this HTML version using MathJax in order to improve their display. Uncheck the box to turn MathJax off. This feature requires Javascript. Click on a formula to zoom.
Abstract
Artichoke peels were used to produce activated carbon using chemical activation methods. Two activation protocols were compared: a two-step method A and a one-step method B. As newly used activating agents, KCl, CrCl3 and TiCl4 were compared. The results show that method B is superior to A. KOH with method B had an area of 2321 m2/g and a total pore volume 1.0071 cm3/g, of which 0.9794 cm3/g was confined to micropores. The corresponding values for KCl are 1731, 0.6925 and 0.6718. TiCl4 had lower but comparable values with those of KCl. CrCl3 appeared to be the least successful among the three newly used activating agents. The post-activation washing step strongly affects the characteristics of the final product. The differences among the effects of Zn, Cr and Ti are discussed in terms of the differences in polarizing power.
1 Introduction
Plant-based adsorbents require a simple alkali and/or acid treatment to remove lignin before the application to increase their efficiency. Non-conventional adsorbents require less maintenance and supervision. For activated carbon (AC), the production costs can be reduced by either choosing a cheap raw material or applying a proper production method. Nevertheless, the preparation of AC with notably specific characteristics using low-cost raw materials at low temperature (less energy costs) remains challenging. The use of non-conventional wastes as sources to produce ACs may be an efficient alternative for both effective waste management practices and low-cost AC production. A revision of the literature shows that there are a considerable number of studies dedicated to the valorization of such wastes to produce AC. In recent years, various investigations focused on testing new cheap and renewable raw materials to produce activated carbon, mainly agricultural byproducts such as fruit stones [Citation1], cherry stones [Citation2], agricultural waste biomass [Citation3], seed hulls [Citation4] (cotton seed, peanut, sunflower, soybean, lupine), straws and stalks [Citation5] (corn, rice, cotton, wheat), wastes of the wood industry [Citation6], bamboo fibres [Citation7], coconut shell [Citation8], peels of orange [Citation9,Citation10], banana and mandarin [Citation10] and other low-cost lignocellulosic materials that offer an inexpensive source of carbon. It has been found that lignocellulose materials account for approximately 47 wt.% of the total raw material for commercial production. Many studies have used non-conventional, municipal and industrial wastes as AC precursors, such as plastic waste [Citation11] (PET), waste of tires [Citation12], coal tar pitch [Citation13], sewage sludge [Citation14], newspaper waste [Citation15], waste from the alcoholic beverage industry [Citation16], tea industry waste [Citation17], palmyra waste of the coastal regions [Citation18], and other low-cost adsorbents. There are two main manufacturing methods to produce AC: the physical (thermal) activation method and chemical activation method. Physical activation implies two different and separate stages: pyrolysis or carbonization of the precursor at 400–600 °C and controlled gasification of the resulting char by an oxidizing agent at 800–1100 °C. Chemical activation is a single-step process, where the pyrolysis and activation steps are simultaneously performed at temperatures of 400–800 °C. The most commonly used chemical agents are ZnCl2, NaOH, KOH, and H3PO4, and the least commonly used are NaHCO3 and K2CO3. To the best of our knowledge, no reports on KCl, CrCl3 or TiCl4 as an activating agent to produce ACs could be found in related works. In selecting the agents, we aimed at comparing a commonly used agent with new one(s) of its relative(s). The corrosive nature of ZnCl2 enables it to act as a cellulose destructor, which explains the wide-spread use as an activating agent. In our study, ZnCl2 is used as a representative of transition metal chlorides to compare with the newly used chlorides. Thus, for alkali metal hydroxides, we selected KCl, and CrCl3 and TiCl4 for the transition metal chlorides. We included H3PO4, which has been extensively used, to extend the scope of the comparison. The activation process was conducted via a two-step method A or a one-step method B. Different products were characterized by determining the percentage yield, FTIR, XRD, SEM, N2 adsorption, determining the PZC, surface oxygen groups and iodine number.
2 Experimental
2.1 Materials
Artichoke peels were collected from Egyptian markets. They were sieved to remove impurities, cut into smaller pieces, washed with water many times to eliminate dirt, and dried at 90 °C for 24 h. KOH, KCl, ZnCl2, CrCl3, TiCl4, H3PO4, NaOH, HCl, Na2CO3, NaHCO3, KNO3, KOH, HNO3 and sublimed iodine were purchased from Sigma.
2.2 Sample preparation
2.2.1 Method A: a two-stage process
Pyrolysis: The dried peels were introduced into a horizontal tubular furnace and carbonized at 500 °C for 1 h under a flow of nitrogen (100 cm3/min). After cooling to room temperature, the carbonized sample was ground to form a powder. This powdered form of carbonized char was divided into six groups; each group was impregnated in an aqueous solution of one of the following activating agents: KOH, KCl, ZnCl2, CrCl3, TiCl4, and H3PO4. In each case, the impregnation was at 60 °C for 24 h with a weight ratio of 1.5:1 (activating agent:precursor), and identical amounts of water were added for all cases to obtain slurries.
Activation: The treated groups were filtered, washed with distilled water several times to remove the excess activating agents, and dried at 110 °C for 24 h. Then, they were again placed in the tubular furnace and heated at 800 °C for 1 h under a flow of nitrogen (100 cm3/min). After cooling to room temperature, the obtained carbon was washed with 7 N aqueous solution of HCl and subsequently hot distilled water until pH ≃ 6.5 to eliminate the activating agent residues and other mineral species that formed during the process. Finally, the resulting activated carbon was dried at 110 °C for 24 h and stored in tightly closed glass bottles in a desiccator for the analysis.
2.2.2 Method B: a single-stage process
Carbonization and activation: The dried raw material was divided into six equivalent groups, and each group was impregnated in an aqueous solution of one of the following activating agents: KOH, KCl, ZnCl2, CrCl3, TiCl4, and H3PO4. The impregnation of all groups was at 60 °C for 24 h with a weight ratio of 1.5:1 (activating agent:precursor), and identical amounts of water were added to obtain slurries. The treated groups were filtered, washed with distilled water several times and dried at 110 °C for 24 h. Then, they were placed in a horizontal tubular furnace and heated at 800 °C for 1 h under a flow of nitrogen (100 cm3/min). Subsequently, the washing and drying steps were identical to those in method A.
For comparison, untreated activated carbons (references) were prepared by similarly pyrolysing and activating the dried peels as in A and B without the activating agent, washing and drying as in the case of the treated samples.
The activated carbon yield was defined as the final weight of the product after activation, washing, and drying. The percentage yield was determined from the following relation:where Wf and Wi are the final activated carbon dry weight (g) and precursor dry weight (g), respectively.
2.3 Characterization of activated carbon materials
2.3.1 IR spectroscopy
The chemical function groups in the bulk phase and on the carbon surface were characterized using a Fourier Transform IR spectrophotometer (Nicolet 6700 FTIR, Thermo Scientific, USA) in the range of 4000–400 cm−1. The samples were examined as KBr disks.
2.3.2 Surface oxygen function groups
This process was conducted with Boehm titration [Citation19]. The acidic sites were determined under the assumption that NaOH neutralizes the carboxylic, lactonic and phenolic groups, Na2CO3 neutralizes the carboxylic and lactonic groups, and NaHCO3 neutralizes only carboxylic groups. The basicity was determined via titration with HCl.
2.3.3 Point of zero charge
The pHPZC values of different carbons were determined using the Mass titration method [Citation20]. Six fixed masses (0.15 g) of each carbon sample were introduced into six 100-ml Erlenmeyer flasks, which contained 50 ml of 0.1 M potassium nitrate solution. The initial pH of these solutions was adjusted to 2, 4, 6, 8, 10, and 12 by adding a few drops of either nitric acid or potassium hydroxide. The agitated solutions were allowed to equilibrate while covered for 24 h in an isothermal shaker at 22 ± 1 °C. Then, each suspension was filtered, and the final pH was measured.
2.3.4 X-ray diffraction analysis
The crystallographic structure of the activated carbon samples was studied using a powder X-ray diffraction analyser BRUKUR D8 ADVANCE with CuKα X-ray source with a secondary monochromator (Germany), which operated at 40 kV and 40 mA in the 2θ range of 4–80.
2.3.5 Nitrogen physisorption
The textural and porous structure of each activated carbon sample was investigated using the physical adsorption of N2 at −196 °C on an automatic apparatus (NOVA 4000e – Quanta chrome instruments). All samples were degassed at 200 °C and 10−5 mmHg in a vacuum for 6 h.
2.3.6 Iodine number
The ability of activated carbon to remove contaminants was determined based on its adsorption capacity. An iodine adsorption test (ASTM D4607-94) was assessed to measure the adsorption capacity of activated carbon from the liquid phase.
2.3.7 Surface morphology
The surface morphology of selected activated carbon samples was imaged using a scanning electron microscope (ZEISS, EVO HD – USA).
3 Results and discussion
3.1 (%) Yield
The percentage yields of the artichoke-based ACs prepared by both methods are presented in . Generally, the (%) yield of method B is nearly twice that of method A, which indicates the efficiency of method B. The AC yields of method B are 40.76–31.26%, where the yields of method A are 20.8–14.2%. Method B gave comparable AC yields from globe artichoke (40–25%) [Citation21] and other precursor materials such as coconut shell (33.8–28.94%) [Citation22] and palm shell (45–20%) [Citation23].
Table 1 (%) Yields of Artichoke-based activated carbons using methods A and B.
The lower AC yields of method A may be attributed to the evolution of most of the volatile matter during the carbonization step in addition to an increase in carbon consumption in the reactions with the activating agents during impregnation and activation at high temperatures. The latter reason may explain the lower yield than untreated carbon. The higher yields of method B can be attributed to the efficiency of the chemical activation process, where the chemical structure of the precursor was hardly destroyed, which was predicted to enhance the chemical interactions and pervasion of the dehydrating agents through the carbon matrix. Furthermore, method B gave comparable yields using the newly applied activating agents KCl, CrCl3, and TiCl4.
3.2 IR spectroscopy
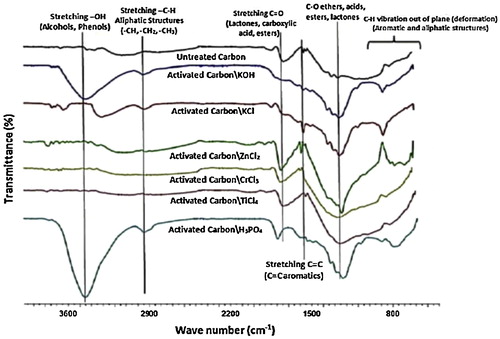
The 4000–400 cm−1 infrared spectra are shown in and . Tables S1 and S2 (see Supporting information) show different identified groups in different samples of methods A and B, respectively, with the corresponding wave numbers. shows the FTIR spectra of artichoke-based ACs prepared by method A, which indicate variations particularly in the fingerprint region (1300–9000 cm−1) and the region above 3000 cm−1. Hence, it may be concluded that method A has occurred via different chemical reactions between char and activating agents, which resulted in ACs of different chemical structures, and the carbonization step represents a decomposition stage of the lignocellulose material to a completely different carbon structure Char.
Fig. 1 FTIR spectra of Artichoke based AC prepared by method “A”.
The 4000–400 cm−1 infrared spectra are shown in and . Tables S1 and S2 (see Supporting information) show different identified groups in different samples of methods A and B, respectively, with the corresponding wave numbers. shows the FTIR spectra of artichoke-based ACs prepared by method A, which indicate variations particularly in the fingerprint region (1300–9000 cm−1) and the region above 3000 cm−1. Hence, it may be concluded that method A has occurred via different chemical reactions between char and activating agents, which resulted in ACs of different chemical structures, and the carbonization step represents a decomposition stage of the lignocellulose material to a completely different carbon structure Char.
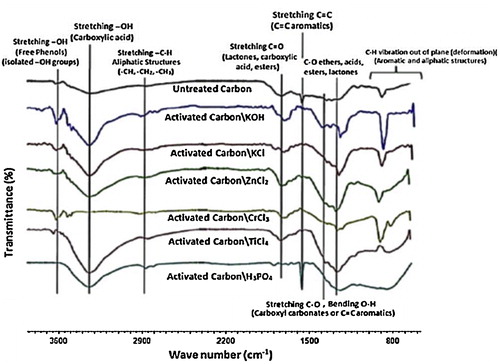
Fig. 2 FTIR spectra of Artichoke based AC prepared by method “B”.
Thus, all ACs appear as if they were not derived from the same precursor. In addition, the spectra show that important chemical function groups are absent in many carbon samples, particularly hydroxyl groups and phenolic –OH (Table S1) (Supporting information). The functionality of the ACs that were prepared using method A is clearly qualitatively variable, which differently affects the surface charge and the adsorption process.
Thus, all ACs appear as if they were not derived from the same precursor. In addition, the spectra show that important chemical function groups are absent in many carbon samples, particularly hydroxyl groups and phenolic –OH (Table S1) (Supporting information). The functionality of the ACs that were prepared using method A is clearly qualitatively variable, which differently affects the surface charge and the adsorption process.
The spectra of all ACs that were prepared using method B () show that the samples are almost homogenous because they expose similar surface groups in different amounts and have a similar profile to the IR spectrum of untreated carbon in nature, i.e., the carbon samples appear to be derived from the same precursor. Table S2 (Supporting information) shows the IR data that support this conclusion. In addition, all samples except untreated and AC/CrCl3/B samples exhibit a small wide band at approximately 1390 cm−1 that corresponds to the stretching vibration of C–O and bending vibration of O–H in carboxyl carbonates or C=C aromatics and various modes of substituted rings [Citation24]. All carbon samples exhibit peaks of variable intensity in the region of 840–880 cm−1, all of which are related to the out-of-plane bending vibrations of C–H in aromatic rings with a large degree of substitution [Citation25]. The intensity variation implies a variable extent of substitution [Citation26].
The spectra of all ACs that were prepared using method B () show that the samples are almost homogenous because they expose similar surface groups in different amounts and have a similar profile to the IR spectrum of untreated carbon in nature, i.e., the carbon samples appear to be derived from the same precursor. Table S2 (Supporting information) shows the IR data that support this conclusion. In addition, all samples except untreated and AC/CrCl3/B samples exhibit a small wide band at approximately 1390 cm−1 that corresponds to the stretching vibration of C–O and bending vibration of O–H in carboxyl carbonates or C=C aromatics and various modes of substituted rings [Citation24]. All carbon samples exhibit peaks of variable intensity in the region of 840–880 cm−1, all of which are related to the out-of-plane bending vibrations of C–H in aromatic rings with a large degree of substitution [Citation25]. The intensity variation implies a variable extent of substitution [Citation26].
All activating agents, including the newly used ones (KCl, CrCl3 and TiCl4), successfully prepared ACs of considerable function groups that are of great importance. Furthermore, the results emphasize the role of method B in highlighting the correlation between the final picture on processed AC and its precursor.
3.3 Oxygen functional groups content (Boehm)
Depending on the activation method, partial oxidation may occur, and the carbon surface becomes rich in various functional groups with a broad range of concentrations. The Boehm titration results of artichoke-based ACs that were prepared using both methods A and B are presented in . The values are the average of three measurements.
Table 2 Results of Boehm titrations in (mmol/g) and Point of Zero Charge (pHpzc) for ACs that were prepared using methods A and B.
Method B leads to more oxygen functional groups than method A. This result may be attributed to the protective effect of method B because of the incubation of the activating agents deep in the precursor structure. However, the first stage of method A (carbonization) produces a non-porous solid carbon structure that resists any pervasion of the activating agents and maintains only the reactions of surface carbon atoms. The effect of the activation process also clearly appears in the comparison between these results and those of the untreated sample. Although method A resulted in practically equal total values to the untreated sample, the values of method B are clearly 40% higher. It is worth noting that such a superior oxidic surface relies on the basic oxygen groups as inferred from the minute change in total acidic amounts. Method A appears to decrease the total acidic nature relative to the untreated sample. The phenolic groups appear to be strongly dependent on the preparation method. However, for method B, the activating agents do not monotonically affect the nature of surface oxides on the ACs. KCl, KOH and H3PO4 yield carbons with relatively higher acidic surface oxides, TiCl4 yields carbons with higher basic surface oxides, whereas CrCl3 and ZnCl2 yield carbons with nearly neutral surfaces.
3.4 Point of zero charge
The point of zero charge (PZC), as distinguished from IEP, varies with the net total (external and internal) surface charge of the particles [Citation27]. The value of the untreated carbon reflects the acidic nature because there are more total acidic oxygen groups than basic groups ().
Except for ZnCl2/A and H3PO4/B, all treated samples show higher PZC values than the untreated one. This result is understandable considering that more basic sites developed than acidic ones. Furthermore, among the acidic groups, most of the improvement is because of the formation of phenolic groups, which are the weakest among the three detected types of acidic nature. In addition, AC/H3PO4/B has the lowest pHpzc (5.18) despite the considerable amount of basic sites. This acidic nature may be because there are polyphosphates, which contain notably acidic surface groups with pKa of 1.6–1.9 and form as a result of the self-heating effect, which increases the temperature of the sample to 80–90 °C. This effect can be attributed to the strong exothermal reaction of P2O5 (formed by dehydration of excess, non-reacted H3PO4) with water vapour from the ambient atmosphere before washing [Citation28].
The PZC value depends on the activation method except in the case of KCl and TiCl4 because for these two reagents, the increase in number of acidic sites corresponds with an increase in number of basic sites. For ZnCl2 and CrCl3, method B results in more basic sites without a change in the number of acidic sites. Therefore, it causes a higher PZC. In contrast, in the case of KOH and H3PO4, method B causes an increase in acidic nature, which corresponds with either minute or no change in basic amounts, and a lower PZC value than method A.
3.5 Iodine number
It has been established that the iodine number measures the accessibility of pores with dimensions ≥1.0 nm [Citation29]. The iodine numbers of artichoke-based ACs prepared by both methods A and B are presented in . The values are the average of two measurements. Method B significantly enhances the adsorptive capacities of the ACs. These high iodine numbers are because of the development of the micropore structure via method B, whereas the ACs produced via method A have lower iodine values because they have a heterogeneous pore system and no extended micropore structure. The vast difference in the case of ZnCl2 strongly shows the superior efficiency of method B.
Table 3 Iodine numbers (mg/g) of artichoke-based activated carbons that were prepared by both methods A and B (According to ASTM D4607-94).
3.6 Texture and structure characterization
3.6.1 Nitrogen physisorption
The isotherms (Supporting information) of all ACs prepared via method B are typical Type I of the IUPAC classification, which sharply increase at low relative pressures of approximately 0.01 and reach a plateau that is parallel to the relative pressure axis with the complete absence of hysteresis. The isotherms of the untreated sample and ACs prepared via method A appear to be a combination of Type I and Type II according to IUPAC, which exhibit different degrees of hysteresis of Type H4 and indicate microporosity in the case of Type-I adsorption isotherms. The isotherm of AC/ZnCl2/A is mostly Type II with a Type-H3 hysteresis loop (), which is observed with solids of plate-like particles that create slit-shaped pores [Citation30].
Fig. 3 Adsorption–desorption isotherms of N2 at STP for Artichoke based ACs prepared by both methods “A” and “B”(ZnCl2).
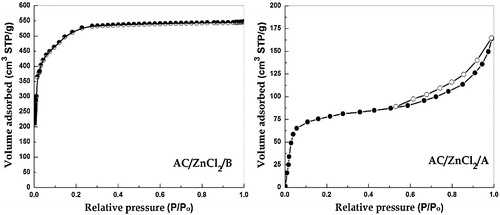
The isotherms (Supporting information) of all ACs prepared via method B are typical Type I of the IUPAC classification, which sharply increase at low relative pressures of approximately 0.01 and reach a plateau that is parallel to the relative pressure axis with the complete absence of hysteresis. The isotherms of the untreated sample and ACs prepared via method A appear to be a combination of Type I and Type II according to IUPAC, which exhibit different degrees of hysteresis of Type H4 and indicate microporosity in the case of Type-I adsorption isotherms. The isotherm of AC/ZnCl2/A is mostly Type II with a Type-H3 hysteresis loop (), which is observed with solids of plate-like particles that create slit-shaped pores [Citation30].
Although the BET equation is most widely used to evaluate the surface area of solids, it is unlikely to yield a reliable value of the actual surface area if the isotherm is truly Type I because it does not consider the possibility of micropore filling or penetration into molecular-size cavities [Citation30]. Indeed, applying the linear form of the BET equation to our data resulted in lines of low R2, which implies the inapplicability of the equation. The t-plot method for micropore analysis, which was developed by De Boer, and the αs-method, which was developed by Sing, have been used to estimate the actual internal and external surface areas of the artichoke-based ACs prepared via both methods A and B. includes the complete numerical values for all textural parameters of artichoke-based ACs. The surface areas of ACs prepared via method B are clearly 2–4 times those prepared via method A. Most of the surface area of the activated carbon is related to the pores with diameter below 2 nm, whereas mesopores and macropores have smaller contributions to the total surface area. The relatively low surface area in the case of H3PO4 can be attributed to the formation of polyphosphoric acid and/or phosphate and polyphosphate species, which act as an insulating layer around the particles during the impregnation step, partly preventing the penetration of the activating agent into the raw material [Citation31] and making some created pores inaccessible to nitrogen. In the case of AC/CrCl3/B, the relatively low surface area of 909.35 m2/g is attributable to the presence of many chromium phases in the carbon matrix after the washing steps, which affect the pore structure of the product. The existence of these phases was proven using XRD (will be presented). Chromium carbides with a high melting point (1895 °C) persist during the activation step and consequently facilitate the oxidation to form chromium oxides. The difference in surface area between AC/KOH/B and AC/KCl/B may be explained based on the chemical nature of the precursor. The acidic nature of the artichoke peels facilitates the deep penetration of KOH into the precursor structure. Hence, it increases the efficiency of the activation process via KOH instead of KCl. Nonetheless, the value of the latter case implies that KCl is also an efficient activating agent.
Table 4 Textural parameters of artichoke-based activated carbons prepared via both methods A and B.
For activated carbons, the pore volume is an important parameter that characterizes their pore structures. In Type-I isotherms, the amount adsorbed at relative pressure near unity corresponds to the total amount adsorbed in both micropores (filled at low relative pressure) and mesopores (filled at pressures above 0.2). Consequently, the subtraction of micropore volume (α-method) from the total amount provides the volume of mesopores [Citation32]. The results show that the pore volumes and surface area follow identical trends and that the pore volume is mainly confined to micropores. Sample ZnCl2/A concomitantly shows a significant fraction of mesoporosity ().
An additional analysis was performed by applying the Dubinin–Radushkevich (DR) equation. shows the numerical values of DR parameters of all AC samples.
Table 5 Dubinin–Radushkevich analysis results and the textural parameters of artichoke-based activated carbons prepared using methods A and B.
The mean pore width of the ACs prepared using method B, except AC/CrCl3/B, is below 2 nm, which confirms the microporous nature of ACs prepared using method B, whereas its value for ACs prepared using method A is ≥2 nm, which confirms the mesoporous nature of ACs prepared using method A. The energies of adsorption Eo of ACs prepared using methods B and A are approximately 20 kJ/mole and 16 kJ/mole, respectively, which reflects the microporous nature of solids produced via method B [Citation33]. In contrast, AC/CrCl3/B has lower adsorption energy than AC/CrCl3/A, which may be attributed to the presence of Cr2O3 phases as impurities in AC/CrCl3/B because of the strong reaction of the precursor and activating agent when method B is used and the difficult complete removal of diffused chromium species. AC/CrCl3/A does not have as much of these species as AC/CrCl3/B because of the inefficient activation process of method A. Thus, the presence of impurities so badly affects AC/CrCl3/B that they reduce the energy of adsorption to a lower value than that of AC/CrCl3/A. The values of Eo for KCl and TiCl4 with method B are of special interest because KCl and TiCl4 are newly used activating agents.
According to Kaneko [Citation34], Dubinin–Radushkevich plots are composed of three or four regions with different slopes: L, M, H and S. The first three regions are attributed to micropores, whereas the fourth one signifies the presence of mesoporosity. The previous regions are observed in the DR plots of all ACs that were prepared using method A, except that region S is absent for AC/KOH/A. According to the DR plots of ACs prepared by method B, the absence of region S implies the increase in microporosity and decrease in external area and number of wider mesopores. In addition, region L′ is observed at low pressure, which corresponds to the presence of ultramicropores. shows the DR plots of ACs/TiCl4. See Supporting information for the plots of all other samples.
Fig. 4 Dubinin–Radushkevich plots for artichoke-based AC/TiCl4.
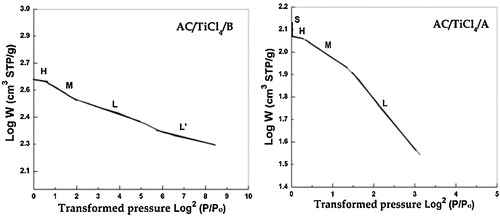
According to Kaneko [Citation34], Dubinin–Radushkevich plots are composed of three or four regions with different slopes: L, M, H and S. The first three regions are attributed to micropores, whereas the fourth one signifies the presence of mesoporosity. The previous regions are observed in the DR plots of all ACs that were prepared using method A, except that region S is absent for AC/KOH/A. According to the DR plots of ACs prepared by method B, the absence of region S implies the increase in microporosity and decrease in external area and number of wider mesopores. In addition, region L′ is observed at low pressure, which corresponds to the presence of ultramicropores. shows the DR plots of ACs/TiCl4. See Supporting information for the plots of all other samples.
3.6.2 X-ray diffraction analysis
An increase in disorder of the graphitic sheets of the activated carbon usually enhances the porosity and internal surface area. XRD analysis was performed for artichoke-based ACs that were prepared using only method B to study the effect of the activating agents on the crystallographic structure of activated carbon and identify the purity of the activated carbon (investigate the metal content) in addition to the metallic and intermetallic phases if there are any. The XRD patterns are shown in . The phase compositions and other XRD parameters were interpreted as in [Citation35–Citation37]. The amorphous nature of the prepared ACs is clear. AC/KOH, AC/ZnCl2 and AC/H3PO4 have nearly complete amorphous structures with a high degree of disordering, which reflects the efficiency of the preparation process and washing step and proves the competence of KOH, ZnCl2 and H3PO4 as regular activating agents to prepare ACs from our precursor (artichoke peels). KOH has the strongest amorphous (disordering) effect on artichoke-peel-based ACs, whereas AC/KCl, AC/CrCl3 and AC/TiCl4 have amorphous structures with different degrees of crystallinity because there are certain metallic oxide phases as impurities. AC/KCl exhibits two peaks, which correspond to β-K2O and α-K2O. In addition, AC/CrCl3 has different peaks, which are assigned to graphite (002), (004), and different peaks of Cr2O3. AC/TiCl4 exhibits two peaks that correspond to anatase (101) and rutile (110) and one peak of graphite (004). These oxidic phases may appear as impurities in the prepared ACs because of the inefficiency of the washing step despite the vigorous conditions.
Fig. 5 XRD of artichoke based activated carbons prepared by method “B”.
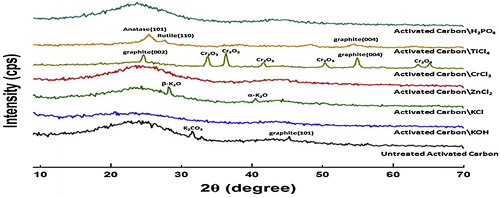
Alternatively, the formation of high-temperature metal carbides, which deeply settle in the carbon texture, becomes unattainable by the leaching reagent. These metal carbides are likely oxidized after cooling and form different metallic oxide phases. AC/CrCl3 has the largest amount of metallic oxides in addition to certain graphite phases among all AC samples. The presence of these crystalline entities induces the build-up of more ordered graphite layers as inferred from the appearance of well-defined peaks of the (002) and (004) graphite faces. Although this result may hint at the failure of CrCl3 to act as a good activating agent to produce active carbon from a cellulosic precursor, it may benefit the removal of organic dyes from aqueous solutions [Citation37]. TiCl4 and KCl are promising new activating agents for the preparation of activated carbons.
3.6.3 Surface morphology
The surface morphology of some selected artichoke-based ACs was examined using a scanning electron microscope to illustrate the surface changes because of the preparation method.
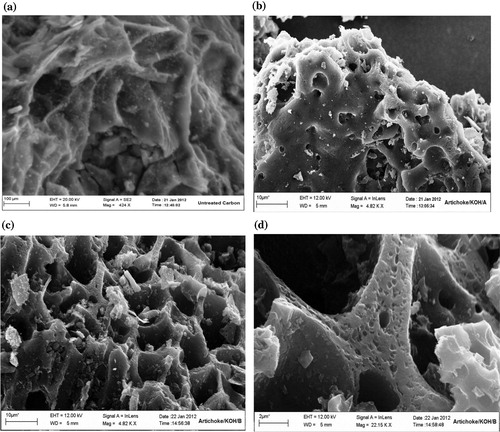
(a) shows the SEM micrograph of the untreated carbon sample. Its surface is notably dense with no pores except some occasional cracks. The SEM micrograph of artichoke-based AC/KOH/A ((b)) shows that its surface is nearly homogenous with some wide pores. This appearance accounts for its low surface area and pore volumes and confirms the low efficiency of method A in preparing ACs from our raw materials. (c) illustrates the significantly porous nature of the AC/KOH/B sample. The surface contains honeycomb-like formations, which consist of a system of adjacent cavities with an organized network of macropores. These cavities, macropores, and edges contain micropore colonies (at higher magnification; (d)), which account for the high internal surface area (≃2321 m2/g). This texture is notably beneficial for many adsorption processes because the wide pores serve as channels for the smaller pores. The chemical, surface, and morphological characterization results reveal that method B (single-stage method) is the chemical activation method that we can select to prepare efficient ACs from our raw materials.
Fig. 6 Scanning electron micrographs of (a) artichoke based untreated carbon, and (b) artichoke based AC/KOH/A, (c and d) artichoke based AC/KOH/B.
4 General discussion
Cellulose undergoes thermal decomposition without a melting state, which results in the formation of a strong carbonaceous residue. In the chemical activation method, the initial step involves the mixing (impregnation) and chemical attack of the biomass by the activating agent. In the subsequent step of the thermal treatment, the activating agents initiate the bond cleavage, cross-link the reactions, minimize tar formation, and modify the surface chemistry of the resulting adsorbent. In addition, the activation process rearranges the carbon structure and produces a more ordered structural skeleton. The chemical reaction between KOH and the carbon material has been described to proceed through many steps, which involves the formation of K2O, steam and K2CO3 [Citation38]. Regarding the mechanism of the KCl activation process, KCl introduces K+ into carbon materials, which reacts with oxygen of the precursor to form α- and β-K2O, as confirmed using XRD. K2O can easily infiltrate the pores and is subsequently reduced by carbon, which results in carbon gasification with subsequent CO2 emission, which enhances the porous structure.
For the mechanism of the transition metal activation process, transition metal chlorides are dehydrating agents and can alter the pyrolysis behaviour of the carbon precursor. The chemicals that remain after the thermal process are leached in the washing step and leave cavities that constitute a porous structure. However, the leach ability will increase when the leachable species more easily leave the carbon matrix, which depends on the strength of the interaction between the metal and the carbon matrix. To compare ZnCl2, CrCl3 and TiCl4 in that behaviour, we invoke the concept of the polarizing power of metal cations. The polarizing power means the ability to distort the electron distribution in the neighbouring molecules, atoms or ions [Citation39]. The parameter Z/r2 can be considered a measure of the strength of the charge field of the cation by which the neighbouring atoms in the matrix will be affected. Considering this parameter for Zn, Cr and Ti cations with their ionic radii (Pauling) as 0.088, 0.081 and 0.096 nm, respectively, we obtain the values of 259, 454 and 434, respectively. According to these values, we can arrange the interaction strength of cations with the carbon matrix as Zn < Ti < Cr. Therefore, the leach ability is expected to follow the order: Zn > Ti > Cr, which explains the order in all reported data that cite Zn first as a successful activating agent to produce AC from artichoke peels. The presence of more than one oxidation state for Cr increases the chance of interaction with the carbon matrix and consequently decreases the leach ability of Cr after activation with a consequent AC formation with lower-grade targeted properties. However, all samples consisted of acidic and basic sites, which indicates that the strength instead of the nature of the interaction is the more important factor in drawing the final picture.
5 Conclusions
The AC production from a cellulosic precursor (artichoke peels) via chemical activation strongly depends on the activation method. The one-step method appears to be superior to the method that proceeds in two separate steps. KOH with method B resulted in an area of 2321 m2/g and a total pore volume of 1.0071 cm3/g, of which 0.9794 cm3/g was confined to micropores. The characteristics of the produced AC also strongly depend on the nature of the used activating agent. Method B resulted in higher iodine number and total amount of acidic and basic surface functional groups. The use of new activating agents such as KCl, CrCl3 and TiCl4 appears tempting in future use with deeper concern for the conventional activating agents that largely appear in the literature. The application of these activating agents with other precursors of different origin is in progress.
Supplementary data
Download MS Word (4.8 MB)Notes
Peer review under responsibility of Taibah University.
Related Research Data
References
- F.Rodriguez-ReinosoM.Molina-SabioActivated carbons from lignocellulosic materials by chemical and/or physical activation: an overviewCarbon30199211111118
- D.AngınProduction and characterization of activated carbon from sour cherry stones by zinc chlorideFuel1152013804811
- E.KoseogluC.Akmil-BasarPreparation, structural evaluation and adsorptive properties of activated carbon from agricultural waste biomassAdv. Powder Technol.262015811818
- S.OmarB.GirgisF.TahaCarbonaceous materials from seed hulls for bleaching of vegetable oilsFood Res. Int.3620031117
- O.IoannidouA.ZabaniotouAgricultural residues as precursors for activated carbon production—a reviewRenew. Sustain. Energy Rev.11200719662005
- J.M.DiasM.C.M.Alvim-FerrazM.F.AlmeidaJ.Rivera-UtrillaM.Sanchez-PoloWaste materials for activated carbon preparation and its use in aqueous-phase treatment: a reviewJ. Environ. Manag.852007833846
- H.D.NguyenT.T.T.MaiN.B.NguyenT.D.DangM.L.P.LeT.T.DangV.M.TranNovel method for preparing micro fibrilated cellulose from bamboo fibersNanosci. Nanotechnol.42013919
- J.KatesaS.JunpiromandC.TangsathitkulchaiEffect of carbonization temperature on properties of char and activated carbon from coconut shellSuranaree J. Sci. Technol.2042013269278
- K.Y.FooB.H.HameedPreparation, characterization and evaluation of adsorptive properties of orange peel based activated carbon via microwave induced K2CO3 activationBioresour. Technol.1042012679686
- F.S.HashemM.S.AminAdsorption of methylene blue by activated carbon derived from various fruit peelsDesalin. Water Treat.201610.1080/19443994.2015.1132476
- N.V.SychN.T.KartelN.N.TsybaV.V.StrelkoEffect of combined activation on the preparation of high porous active carbons from granulated post-consumer polyethylene-terephthalateAppl. Surf. Sci.252200680628066
- F.RozadaM.OteroJ.B.ParraA.MoranA.I.GarciaProducing adsorbents from sewage sludge and discarded tires: characterization and utilization for the removal of pollutants from waterChem. Eng. J.1142005161169
- H.TamaiN.KatsuK.OnoH.YasudaAntibacterial activated carbons prepared from pitch containing organometallicsCarbon39200119631969
- M.J.MartinA.ArtolaM.D.BalaguerM.RigolaActivated carbons developed from surplus sewage sludge for the removal of dyes from dilute aqueous solutionsChem. Eng. J.942003231239
- K.OkadaN.YamamotoY.KameshimaA.YasumoriPorous properties of activated carbons from waste newspaper prepared by chemical and physical activationJ. Colloid Interface Sci.2622003179193
- C.Nieto-DelgadoM.TerronesJ.R.Rangel-MendeDevelopment of highly microporous activated carbon from the alcoholic beverage industry organic by-productsBiomass Bioenergy352011103112
- A.GundogduC.DuranH.B.SenturkM.SoylakM.ImamogluY.OnalPhysicochemical characteristics of a novel activated carbon produced from tea industry wasteAppl. Pyrol.1042013249259
- P.RavichandranP.SugumaranS.SeshadriPreparation and characterization of activated carbons derived from palmyra waste of coastal regionProceedings of International Conference on Impact of Climate Change on Coastal EcosystemIndia2011
- H.P.BoehmSurface oxides on carbon and their analysis: a critical assessmentCarbon402002145149
- J.S.NohJ.A.SchwarzEffect of HNO3 treatment on the surface acidity of activated carbonsCarbon281990675682
- M.BenadjemiaL.MillièreL.ReinertN.BenderdoucheL.DuclauxPreparation, characterization and methylene blue adsorption of phosphoric acid activated carbons from globe artichoke leavesFuel Proc. Technol.92201112031212
- A.L.CazettaA.M.M.VargasE.M.NogamiM.H.KunitaM.R.GuilhermeA.C.MartinsT.L.SilvaJ.C.G.MoraesV.C.AlmeidaNaOH-activated carbon of high surface area produced from coconut shell: kinetics and equilibrium studies from the methylene blue adsorptionChem. Eng. J.1742011117125
- J.GuoA.C.LuaTextural and chemical properties of adsorbent prepared from palm shell by phosphoric acid activationMater. Chem. Phys.802003114119
- A.SwiatkowskiM.PakulaS.BiniakM.WalczykInfluence of the surface chemistry of modified activated carbon on its electrochemical behavior in the presence of lead (II) ionsCarbon42200430573069
- J.GuoA.C.LuaCharacterization of adsorbent prepared from oil-palm shell by CO2 activation for removal of gaseous pollutantsMater. Lett.552002334339
- A.M.PuziyO.I.PoddubnayaA.Martinez-AlonsoF.Suarez-GarciaJ.M.D.TasconSynthetic carbons activated with phosphoric acid: I. Surface chemistry and ion binding propertiesCarbon40200214931505
- J.A.MenendezM.J.Illan-GomezY.LeonC.A.LeonL.R.RadovicOn the difference between the isoelectric point and the point of zero charge of carbonsCarbon33199516551659
- A.M.PuziyO.I.PoddubnayaA.Martinez-AlonsoF.Suárez-GarciaJ.M.D.TascónSurface chemistry of phosphorus-containing carbons of lignocellulosic originCarbon43200528572868
- N.M.HaimourS.EmeishUtilization of date stones for production of activated carbon using phosphoric acidWaste Manag.262006651660
- K.S.W.SingD.H.EverettR.A.W.HaulL.MoscouR.A.PierottiJ.RouquerolT.SiemieniewskaReporting physisorption data for gas/solid systems with special reference to the determination of surface area and porosityPure Appl. Chem.571985603619
- Q.S.LiuT.ZhengP.WangL.GuoPreparation and characterization of activated carbon from bamboo by microwave-induced phosphoric acid activationIndian Crops Prod.312010233238
- N.YalcinV.SevincStudies of the surface area and porosity of activated carbons prepared from rice husksCarbon38200019431945
- F.StoeckliL.BalleriniEvolution of microporosity during activation of carbonFuel701991557560
- K.KanekoT.SuzukiK.KakeiEvaluation of micropore width of activated carbon fibers with multi-stage micropore filling analysisJ. Carbon Soc. Jpn. (TANSO)1401989288295
- Z.RyuJ.ZhengM.WangPorous structure of pan-based activated carbon fibersCarbon361998427432
- J.Y.HaB.D.SosnowchikL.LinD.H.KangA.V.DavydovPatterned growth of TiO2 nanowires on titanium substratesAppl. Phys. Exp.4065002201113
- S.MopoungSurface image of charcoal and activated charcoal from banana peelJ. Microsc. Soc. Thail.2220081519
- Y.GuoS.YangK.YuJ.ZhaoZ.WangH.XuThe preparation and mechanism studies of rice husk based porous carbonMater. Chem. Phys.742002320323
- G.M.S.ElShafeiThe polarizing power of metal cations in (Hydr)oxidesJ. Colloid Interface Sci.1821996249253
Appendix A
Supplementary data
Supplementary data associated with this article can be found, in the online version, at doi:10.1016/j.jtusci.2016.04.006.
Appendix A
Supplementary data
The following are the supplementary data to this article: