
 ?Mathematical formulae have been encoded as MathML and are displayed in this HTML version using MathJax in order to improve their display. Uncheck the box to turn MathJax off. This feature requires Javascript. Click on a formula to zoom.
Abstract
In this study, we developed QSAR models for the anti-proliferative activity of pyrazolo-triazole hybrids [(1-benzyl-1H-1,2,3-triazol-4-yl)(1,3-diphenyl-1H-pyrazol-4-yl) methanone] on human brain cancer (U87MG), lung cancer (A549), prostate cancer (PC-3), and colon cancer (HT-29) cell lines. We employed K-means cluster analysis to split the data sets. Statistically robust models were generated [pIC50 (U87MG): R = 0.873, Q2 = 0.554, pIC50 (A549): R = 0.879, Q2 = 0.637,
pIC50 (PC3): R = 0.953; Q2 = 0.850;
pIC50 (HT-29): R = 0.962, Q2 = 0.891;
The reliability of these models was confirmed by acceptable validation parameters, and these models also satisfied the Golbraikh and Tropsha acceptable model criteria. The QSAR study highlighted the atomic feature and molecular descriptors, information content descriptors, and topological and constitutional descriptors that affect anti-cancer activity.
1 Introduction
The conventional drug discovery and development cascade, from a theoretical concept to the market, consumes almost 15 years with large monetary expenses [Citation1,Citation2]. Computational methodologies have emerged as a crucial component of the drug discovery process. Many in silico tools have been developed to shorten the drug discovery cycle to minimize the expense and risk of failure [Citation3,Citation4]. Computer-aided drug design (CADD) is an important method that can help from hit identification to lead optimization and beyond [Citation5,Citation6]. Computer-aided drug design (CADD) including quantitative structure-activity relationships (QSAR), pharmacophore modelling, molecular field analysis, molecular docking and de novo drug design, which allow the development of predictive models for potential lead candidate discovery and optimization [Citation7,Citation8].
Quantitative structure-activity relationship (QSAR) modelling is used to find the relationship between an observed activity and the corresponding structural features of chemo types [Citation9–Citation15]. By predicting the biological activity of a novel chemical entity from the QSAR models, various molecular descriptors are calculated [Citation16–Citation21]. A large number of software programmes that are able to calculate such molecular descriptors are available commercially as well as freely [Citation9]. “PaDEL-Descriptor” (http://www.yapcwsoft.com/dd/padeldescriptor/) is a premium QSAR modelling software that calculates 797 descriptors (663 1D, 2D descriptors, and 134 3D descriptors) and 10 types of fingerprints [Citation9,Citation10].
Previously, we developed many QSAR models for varieties of diseases, such as cancer and AIDS [Citation12–Citation17,Citation19,Citation21]. Now, our attention is focussed on a series of pyrazolo-triazole hybrids that exhibit promising anti-proliferative properties, as reported by Reddy and co-workers [Citation22]. Thus far, no QSAR study on pyrazolo-triazole hybrids has been reported. Hence, we have attempted to develop some robust statistically significant QSAR models to predict the biological potency of those pyrazolo-triazole hybrids. The information generated from the QSAR could be effective to understanding the structure – activity relationships of the series under consideration and subsequently design a new anticancer lead compound.
2 Materials and methods
2.1 Datasets and biological activity
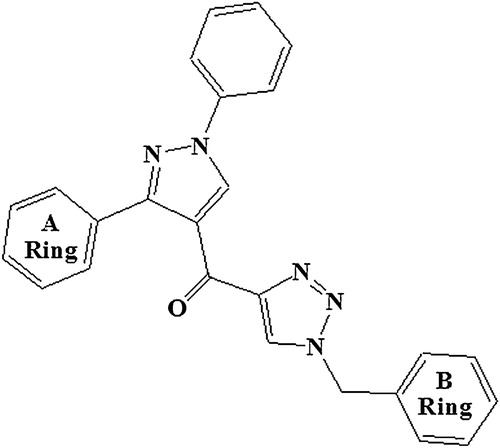
The antiproliferative activities of several (1-benzyl-1H-1,2,3-triazol-4-yl)(1,3-diphenyl-1H-pyrazol-4-yl) methanone derivatives () on different human cancer cell lines [U87MG (brain), A549 (lung), PC3 (prostate), and HT-29 (colon)] were selected from Reddy et al. [Citation22] to develop the chemometric tools. On the basis of the four different cell lines, four datasets were generated, and the negative logarithm of the IC50 (μM) value was considered as the dependent parameter or the response variable for the QSAR models [Citation18,Citation20,Citation23–Citation25].
Table 1 Antiproliferative activities (IC50-μM) of the (1-benzyl-1H-1,2,3-triazol-4-yl)(1,3-diphenyl-1H-pyrazol-4-yl)methanone derivatives (1–30).
2.2 Generation and selection of descriptors
The 2D structures of the pyrazolo-triazole hybrids were drawn using ChemDraw Ultra 8.0.3 [Citation26]. Then, the PaDEL-Descriptors [Citation9] were calculated for the compounds on the MS Windows platform. Whole constitutional, topological, electronic, thermodynamic, geometric, and autocorrelation descriptors were calculated by PaDEL software. These descriptors encoded different aspects of the molecular structures and were considered as independent parameters in the chemometric models.
2.3 Correlation analysis
Initially, a correlation analysis was carried out with the response variable and independent parameters of the compounds using STATISTICA 7 software [Citation27]. The information less descriptors that showed no variation between structures and/or descriptors and those that did not cover the whole space were initially deleted from our study [Citation20]. One of each inter-correlated pair of variables with a correlation coefficient greater than 0.60 was eliminated to decrease the redundancy.
2.4 Test set and training set selection
The splitting of datasets is very important in chemometric model development because of the influence of the chemical nature of the training set compounds on the predictive ability of a developed QSAR model. Non-hierarchical clustering techniques such as the K-means clustering technique are widely used to standardize a descriptor matrix consisting of different descriptors [Citation28,Citation29]. In the K-means clustering analysis, the separation and arrangement of different objects into several groups was performed according to their distance in multidimensional space. In this study, we used the STATISTICA 7 software [Citation27] based K-means clustering analysis tool.
2.5 Stepwise multiple linear regression (S-MLR)
Stepwise multiple linear regression [Citation18–Citation20] methods built multistep models step by step. The following procedures were followed to build S-MLR models.
| (i) | By altering the descriptor or variable combination, a previous step was repeated with the stepping criterion of F = 4 for inclusion and F = 3.99 for exclusion. | ||||
| (ii) | When a specified maximum number of steps had been reached or/and when stepping is no longer possible with the given stepping criterion, the search was terminated. | ||||
2.6 Statistical methods
Several validation parameters were employed to verify the statistical quality of all of the models. The correlation coefficient (R), squared correlation coefficient (R2), adjusted R2 (), variance ratio (F) at specified degree of freedom (df) and standard error of the estimate (SEE) [Citation19,Citation28–Citation30] were calculated using STATISTICA 7 software [Citation27].
We also reported the p-value and t-value for various parameters in each model. The effects of the intercorrelation of the descriptors was further verified by the variant inflation factor (VIF) [Citation18,Citation19]. A VIF value greater than 10 indicates a defective QSAR model.where r2 is the multiple correlation coefficient of one descriptor's effect regressed over the remaining molecular descriptors.
2.7 Validation of the 2D-QSAR Models
The leave-one-out (LOO) cross-validation method, the predicted residual sum of squares (PRESS), and the standard deviation of error of prediction (SDEP) [Citation28–Citation30] were applied as internal validation tools to validate our developed 2D-QSAR models. The predictive powers of all of the developed QSAR models were justified by these internal cross-validation techniques.
To predict the anti-proliferative activities of the pyrazolo-triazole hybrids, it was also important to calculate the ,
, rm2(overall), Δrm2(overall), and other similar parameters. [Citation29].
was calculated by the equation
where yi and
are the actual and predicted activities of the ‘ith’ molecule in the training set, respectively, and ymean is the average activity of all molecules in the test set.
The matrices were calculated to understand both the internal and external predictive capacities,
where r2 is the squared correlation coefficient between the observed vs predicted response values of the test set compounds and
represents the corresponding values for regression through the origin (observed vs. predicted).
The Y-randomization of the model (cR2p) was evaluated to ensure that the model is not based on chance for 100 scrambling iterations [Citation19]. Additional parameters proposed by Golbraikh and Tropsha et al. [Citation30] were also determined for the developed QSAR models to ensure robustness.
3 Results and discussion
3.1 Selection of training and test sets
All datasets were tested on the basis of the anti-cancer activity on human cancer cell lines [U87MG (brain cancer), A549 (lung cancer), PC3 (prostate cancer), and HT-29 (colon cancer)] to develop the QSAR models (). Each dataset (n = 28 in U87MG cell line; n = 24 in A549 cell line; n = 19 in PC3 cell line; and n = 27 in HT-29 cell line) of the pyrazolo-triazole hybrids (.) was divided on the basis of the clusters, as derived from the K-means clustering method in STATISTICA version 7 software [Citation27].
Fig. 1 General structure of pyrazolo-triazole hybrids (1-benzyl-1H-1,2,3-triazol-4-yl)(1,3-diphenyl-1H-pyrazol-4-yl) methanone.
Four clusters (three clusters in the case of the PC3 cell line) were generated, and from each cluster, 25% of the compounds were taken at random to form the test set. It was also ensured that the property range of the test set compounds spans over the range of the training set compounds. Thus, the dataset was divided into training (nTrain = 21 in U87MG cell line; nTrain = 18 in A549 cell line; nTrain = 14 in PC3 cell line; nTrain = 20 in HT-29 cell line) and test (nTest = 7 in U87MG cell line; nTest = 6 in A549 cell line; nTest = 5 in PC3 cell line; nTest = 7 in HT-29 cell line) sets, as shown in Supplementary Table T1.
Four clusters (three clusters in the case of the PC3 cell line) were generated, and from each cluster, 25% of the compounds were taken at random to form the test set. It was also ensured that the property range of the test set compounds spans over the range of the training set compounds. Thus, the dataset was divided into training (nTrain = 21 in U87MG cell line; nTrain = 18 in A549 cell line; nTrain = 14 in PC3 cell line; nTrain = 20 in HT-29 cell line) and test (nTest = 7 in U87MG cell line; nTest = 6 in A549 cell line; nTest = 5 in PC3 cell line; nTest = 7 in HT-29 cell line) sets, as shown in Supplementary Table T1.
The QSAR models were generated based on the training set compounds, and the test set compounds were taken for validation purposes. The criterion for selecting the best model was based on the correlation coefficient. The recommended ratio between the number of predictor parameters and the number of data points was 1:5 for all of these models [Citation19,Citation28,Citation31,Citation32].
3.2 Stepwise multiple linear regression (S-MLR)
The correlation matrixes among descriptors used to develop regression-based QSAR models are provided in Supplementary Table T2. The best models that we found through the stepwise multiple linear regression analysis of all of these datasets are as follows.
The correlation matrixes among descriptors used to develop regression-based QSAR models are provided in Supplementary Table T2. The best models that we found through the stepwise multiple linear regression analysis of all of these datasets are as follows.(1)
(1)
(2)
(2)
(3)
(3)
and
(4)
(4)
Model (1) and Model (2) both explain 70.3% and predict 55.4% and 63.7% of the variances of the U87MG and A549 cell line anti-proliferative activities, respectively, whereas Model (3) explains 88% and predicts 85% of the variance of the PC-3 cell line inhibition. The highest explanation and predictive ability are shown by Model (4), which can explains 91% and predict 89% of the variances of the HT-29 cell line antiproliferative activity. The VIF, t-value and p-value for Models (1)–(4) are shown in .
Table 2 VIF, t-value and p-value for Models (1)–(4).
The differences between the R2 and Q2 values of all models are less than 0.30. All models showed rm2(LOO) values greater than 0.50 and have good predictive ability, as indicated by values higher than 0.50. These four models demonstrated Avg
and rm2(overall) values greater than 0.50. The validation metric values are within the acceptable limits, confirming the acceptable overall fitting of these models. The values found for the cR2p (model randomization) of all models are much greater than the threshold value of 0.50, ensuring that the models are not the outcome of mere chance alone. The statistical results are listed in . Additionally, the four models satisfied the acceptability criteria suggested by Golbraikh and Tropsha (). The observed, calculated, residual, predicted residual, and LOO-predicted activities of the training set compounds of Model (1)–(4) are shown in Supplementary Table T3. The observed and predicted values of the test set compounds of Models (1)–(4) are provided in Supplementary Table T4. The observed (Obs) vs. LOO-predicted (Pred) activities of the training set compounds for Models (1)–(4) are plotted graphically in . It is very interesting that compounds 11, 17, 23 have a potent broad spectrum of activities against all of the tested cancer cell lines. To check the significance of the developed QSAR models, the predicted biological activities of these compounds were compared with the observed activities, suggesting good agreement (Supplementary Table T5).
Fig. 2 Graphical representation of Observed (Obs) versus LOO-predicted (Pred) activities of training set compounds for (a) Model (1), (b) Model (2), (c) Model (3), (d) Model (4).
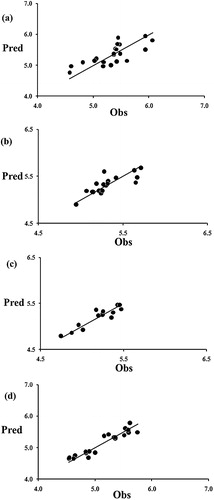
Table 3 Important statistical parameters of Models (1)–(4).
Table 4 Golbraikh and Tropsha acceptable model criteria of Models (1)–(4).
The differences between the R2 and Q2 values of all models are less than 0.30. All models showed rm2(LOO) values greater than 0.50 and have good predictive ability, as indicated by values higher than 0.50. These four models demonstrated Avg
and rm2(overall) values greater than 0.50. The validation metric values are within the acceptable limits, confirming the acceptable overall fitting of these models. The values found for the cR2p (model randomization) of all models are much greater than the threshold value of 0.50, ensuring that the models are not the outcome of mere chance alone. The statistical results are listed in . Additionally, the four models satisfied the acceptability criteria suggested by Golbraikh and Tropsha (). The observed, calculated, residual, predicted residual, and LOO-predicted activities of the training set compounds of Model (1)–(4) are shown in Supplementary Table T3. The observed and predicted values of the test set compounds of Models (1)–(4) are provided in Supplementary Table T4. The observed (Obs) vs. LOO-predicted (Pred) activities of the training set compounds for Models (1)–(4) are plotted graphically in . It is very interesting that compounds 11, 17, 23 have a potent broad spectrum of activities against all of the tested cancer cell lines. To check the significance of the developed QSAR models, the predicted biological activities of these compounds were compared with the observed activities, suggesting good agreement (Supplementary Table T5).
3.3 Descriptor Contributions in the QSAR models
3.3.1 Model 1
ATSC6e is defined as the centred Broto-Moreau autocorrelation – lag 6/weighted by the Sanderson electronegativities [Citation33]. The electronegative substituent, e.g., F or Cl, decreases whereas electron-donating group, e.g., methoxy, increases the value of the coefficient ATSC6e. It shows a positive impact on the biological activity. Compound 23 has the highest ATSC6e value and has methoxy substitutions on both the A and B ring. Thus, this compound is the most potent against the U87MG cell line.
VE1_Dt represents the cocoefficient sum of the last eigenvector from the detour matrix [Citation34]. The negative coefficient of VE1_Dt implies that with the increase of these values, the glioblastoma cell inhibitory activity of the pyrazolo-triazole hybrids may be decreased. The presence of this descriptor in the QSAR model suggests that three methoxy substitutions in the A-ring are unfavourable (compounds 25–30), whereas di- or tri-methoxy substitutions are preferable in the B ring.
SpMin1_Bhs and PetitjeanNumber have positive contributions towards the anti-proliferative activity of the analogues on cancerous U87MG cell lines. SpMin1_Bhs demonstrates the smallest absolute eigenvalue of the Burden modified matrix – n 1/weighted by the relative I-state. Fluorine/fluorine-containing substituents, e.g., CF3, decrease the values of the coefficient and so are detrimental to the activity. The PetitjeanNumber is defined as the shape of the cation. The value of the shape parameter PetitjeanNumber increases when the substituents are changed from F or Cl to CF3 or –OCH3 on the B ring, which increases the activity.
3.3.2 Model 2
MATS8c negatively contributed towards the antiproliferative activity on A549 cell lines. It represents the Moran autocorrelation lag 8/weighted by charges [Citation34]. Compound 17 has the lowest MATS8c value, and it shows the highest biological potency on the lung cancer cell line.
JGI10 is the mean topological charge index of order 10 [Citation34], and it demonstrated a positive impact on the lung cancer cell line inhibition. The mean topological charge index can be increased by adding high-electronegativity compounds to the A ring of (1-benzyl-1H-1,2,3-triazol-4-yl)(1,3-diphenyl-1H-pyrazol-4-yl)methanone derivatives (compound 7, 10, 13, 15, 16, 21).
VR3_Dzp is defined as the logarithmic Randic-like eigenvector-based index from the Barysz matrix/weighted by polarizabilities, whereas VE3_Dzv represents the logarithmic coefficient sum of the last eigenvector from the Barysz matrix/weighted by the van der Waals volumes [Citation34]. These two descriptors positively contributed towards the A549 cell line inhibition, which means that compounds having good VR3_Dzp and VE3_Dzv values will show promising antiproliferative activity.
3.3.3 Model 3
AATS6e is defined as the average Broto-Moreau autocorrelation – lag 6/weighted by the Sanderson electronegativities [Citation34]. The negative coefficient of AATS6e implies that with a decrease in the value of AATS6e, the prostate cancer cell inhibitory activity of the pyrazolo-triazole hybrids will increase. The highest and lowest AATS6e values are shown by compound 7 (containing an electron-withdrawing group) and compound 23 (bearing an electron-donating group), respectively. Thus, electronegativity on the B-ring of the pyrazolo-triazole hybrid is detrimental to the PC-3 cell line inhibition.
ASP-7 (ChiPath Descriptor Average simple path, order 7) and SpMin6_Bhi (smallest absolute eigenvalue of Burden modified matrix – n 6/weighted by relative first ionization potential) negatively contributed towards the inhibition of prostate cancer cell lines [Citation33]. The potential anticancer activity shown by compounds 4 and 5 had a low ionization potential compared with that of others.
3.3.4 Model 4
AATSC8c shows a negative impact on the HT-29 cell line antiproliferative activity. It denotes the average centred Broto-Moreau autocorrelation – lag 8/weighted by charges [Citation34]. Substitution on the B ring of pyrazolo-triazole hybrids with trifluoromethyl may lead to a less active molecule against colon cancer cell lines (compounds 15, 27).
VE1_Dzv is the coefficient sum of the last eigenvector from the Barysz matrix/weighted by van der Waals volumes [Citation34]. It positively contributed towards the inhibition of colon cancer cell lines.
SpMin3_Bhs is defined as the smallest absolute eigenvalue of the Burden modified matrix – n 3/weighted by the relative I-state [Citation34]. The positive contribution shown by SpMin3_Bhs indicates that the biological potency can be increased by increasing the SpMin3_Bhs value. Upon the addition of an electronegative atom or an electron-withdrawing group to ring B of these hybrid derivatives, there was a dramatic loss in the antiproliferative activity of the HT-29 cell lines (compounds 1, 7, 13, 19, and 25).
4 Conclusions
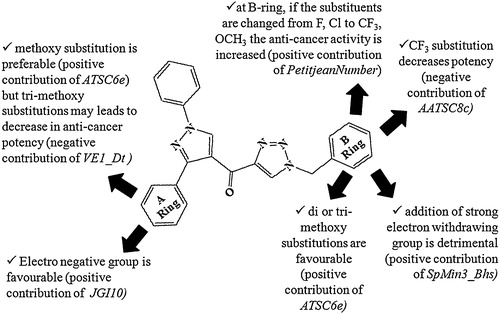
In conclusion, very important indications emerge from our QSAR study of pyrazolo-triazole hybrids (). The QSAR models suggest the importance of descriptors, such as ATSC6e, VE1_Dt, PetitjeanNumber, SpMin1_Bhs, MATS8c, VR3_Dzp, ASP-7 SpMin6_Bhi, AATSC8c, VE1_Dzv and SpMin3_Bhs. The QSAR study revealed that the tri-methoxy substitution on the A-ring was unfavourable for the antiproliferative activity (negative contribution of VE1_Dt), whereas the positive contribution of JGI10 suggested that the addition of electronegative atoms on the A-ring of pyrazolo-triazole hybrids leads to potent anti-cancer compounds. In the B-ring, trifluoromethyl and strong electronegative group substitutions were not suitable (negative contribution of AATSC8c and positive contribution of SpMin3_Bhs, respectively), but 3,4-OCH3 substitution into the pyrazolo-triazole hybrid compound was preferable (positive contribution of ATSC6e) for anticancer activity. Thus, an electronegative substituent at the p-position in the A ring and a 3,4-OCH3 substituent in the B ring make compounds 11, 17, and 23 potent broad spectrum anticancer compounds against all of the tested cell lines. This study also presents a rationale for choosing a hybrid moiety for anti-cancer drug design and development.
Fig. 3 Structural requirements of pyrazolo-triazole hybrids for anti-cancer activity.
Supplementary File
Download MS Word (33.9 KB)Acknowledgements
S. Gayen thanks the University Grants Commission (UGC), New Delhi for awarding a UGC-Start up grant (No.F.30-106/2015-BSR). One of the authors (S.A. Amin) is grateful to the All India Council for Technical Education (AICTE) New Delhi for awarding a Post Graduate GPAT fellowship. We also express our thanks for the support from the Department of Pharmaceutical Sciences, Dr. Harisingh Gour University, Sagar, India.
Notes
Peer review under responsibility of Taibah University.
References
- S.MyersA.BakerDrug discovery – an operating model for a new eraNat. Biotechnol.192001727730
- W.L.JorgensenThe many roles of computation in drug discoveryScience303200418131818
- M.XiangY.CaoW.FanL.ChenY.MoComputer-aided drug design: lead discovery and optimizationComb. Chem. High Throughput Screen.152012328337
- S.ZhangComputer-aided drug discovery and developmentMethods Mol. Biol.71620112338
- Y.TangW.L.ZhuK.X.ChenH.L.JiangNew technologies in computer aided drug design: toward target identification and new chemical entity discoveryDrug Discov. Today Technol.32006307313
- W.L.JorgensenEfficient drug lead discovery and optimizationAcc. Chem. Res.422009724733
- J.BajorathIntegration of virtual and high-throughput screeningNat. Rev. Drug Discov.12002882894
- W.P.WaltersM.T.StahlM.A.MurckoVirtual screening – an overviewDrug Discov. Today31998160178
- C.W.YapPaDEL-Descriptor: an open source software to calculate molecular descriptors and fingerprintsJ. Comput. Chem.32201114661474
- S.PramanikK.RoyModeling bioconcentration factor (BCF) using mechanistically interpretable descriptors computed from open source tool “PaDELDescriptor”Environ. Sci. Pollut. Res. Int.21201429552965
- S.M.AlamS.SamantaA.K.HalderT.JhaQSAR modelling of pancreatic beta-cell KATP channel openers R/S – 3,4-dihydro-2,2-dimethyl-6-halo-4 – (substituted phenylamino-carbonylamino) – 2H-1-benzopyrans using MLR-FA techniquesEur. J. Med. Chem.442009359364
- S.GayenB.DebnathS.SamantaT.JhaQSAR study on some anti–HIV HEPT analogues using physicochemical and topological parametersBioorg. Med. Chem.12200414931503
- B.DebnathS.GayenS.SamantaA.BasuB.GhoshT.JhaQSAR study on some synthesized and biologically evaluated glutamine analogs as possible anticancer agentsIndian J. Chem.4520069399
- A.BasuS.GayenS.SamantaP.PandaK.SrikanthT.JhaQSAR modeling of neonicotinoid insecticides for their selective affinity towards drosophila nicotinic receptors over mammalian α4β2 receptorsCan. J. Chem.842006458463
- B.DebnathS.GayenS.K.NaskarK.RoyT.JhaQSAR study on some azidopyridinyl neonicotinoids insecticides for their selective affinity towards the Drosophila nicotinic receptor over mammalian α4β2 receptor using electrotopological state atom indexDrug Des. Discov.1820038189
- B.DebnathS.GayenS.BhattacharyaS.SamantaT.JhaQSAR study on some pyridoacridine ascididemin analogs as anti-tumor agentsBioorg. Med. Chem.11200354935499
- S.SamantaB.DebnathS.GayenB.GhoshA.BasuT.JhaQSAR Modeling of Dopamine D2 receptor binding affinity of 6–methoxy benzamides using atom type electrotopological state indexIL Farm.102005818825
- N.AdhikariA.K.HalderA.SahaK.D.SahaT.JhaStructural findings of phenylindoles as cytotoxic antimitotic agents in human breast cancer cell lines through multiple validated QSAR studiesToxicol. Vitr.29201513921404
- C.MondalA.K.HalderN.AdhikariA.SahaK.D.SahaS.GayenT.JhaComparative validated molecular modeling of p53-HDM2 inhibitors as antiproliferative agentsEur. J. Med. Chem.902015860875
- N.AdhikariA.K.HalderC.MondalT.JhaExploring structural requirements of aurone derivatives as antimalarials by validated DFT-based QSAR, HQSAR, and COMFA-COMSIA approachMed. Chem. Res.22201360296045
- S.SamantaK.SrikanthS.BanerjeeB.DebnathS.GayenT.Jha5-N-substituted-2-(substituted benzenesulphonyl) glutamines as antitumor agents II: synthesis, biological activity and QSAR studyBioorg. Med. Chem.12200414131423
- T.S.ReddyH.KulhariV.G.ReddyA.V.Subba RaoV.BansalA.KamalR.ShuklaSynthesis and biological evaluation of pyrazolo-triazole hybrids as cytotoxic and apoptosis inducing agentsOrg. Biomol. Chem.1320151013610149
- M.C.SharmaStructural requirements of N-aryl-oxazolidinone-5-carboxamide derivatives for anti-HIV protease activity using molecularmodelling techniquesJ. Taibah Univ. Sci.82014111123
- K.S.BhadoriyaM.C.SharmaS.V.Jain2,4-Dihydropyrano[2,3-c] pyrazole: discovery of new lead as throughpharmacophore modelling, atom-based 3D-QSAR, virtual screeningand docking strategies for improved anti-HIV-1 chemotherapyJ. Taibah Univ. Sci.92015521530
- A.GolbraikhA.TropshaPredictive QSAR based on diversity sampling of experimental datasets for the training and test set selectionMol. Divers.52002231243
- Chem 3D Pro Version 8.0.3 and Chem Draw Ultra Version 8.0.3 are software programs developed by Cambridge Soft Corporation, U.S.A.
- STATISTICA version 7 is statistical software of StatSoft, Inc., Tulsa, USA.
- M.SunY.ZhengH.WeiJ.ChenM.JiQSAR studies on 4-anilino-3-quinolinecarbonitriles as Src kinase inhibitors using robust PCA and both linear and nonlinear modelsJ. Enzym. Inhib. Med. Chem.24200911091116
- P.K.OjhaI.MitraR.N.DasK.RoyFurther exploring rm2 metrics for validation of QSPR models datasetChemom. Intell. Lab. Syst.1072011194205
- A.GolbraikhA.TropshaBeware of q2!J. Mol. Graph. Model.202002269276
- S.WoldL.ErikssonChemometrics Methods in Molecular Design1995Wiley-VCHWeinheim309318
- K.RoyOn some aspects of validation of predictive quantitative structure-activity relationship modelsExp. Opin. Drug Discov.2200715671577
- L.B.KierL.H.HallMolecular Connectivity in Chemistry and Drug Research1976Academic PressNew York
- R.TodeschiniV.ConsonniHandbook of Molecular Descriptors2000Wiley-VCHWeinheim, Germany
Appendix A
Supplementary data
Supplementary data associated with this article can be found, in the online version, at doi:10.1016/j.jtusci.2016.04.009.