
 ?Mathematical formulae have been encoded as MathML and are displayed in this HTML version using MathJax in order to improve their display. Uncheck the box to turn MathJax off. This feature requires Javascript. Click on a formula to zoom.
Abstract
The DFT-B3LYP method, with the base set 6-31G (d) was used to calculate electronic and charge descriptors. The present study was performed using principal component analysis (PCA), multiple linear regression analysis (MLR) and non-linear multiple regression analysis (MNLR) to predict unambiguous QSAR models of 46 substituted phenethylamines toward psychotomimetic activity. Results showed that the MLR and MNLR predict activity in a satisfactory manner. But among those models, we concluded that the latter one provides a better agreement between calculated and observed values of psychotomimetic activity. Also it shows very good stability towards data variations for the validation methods.
1 Introduction
Ideal psychotomimetics are those agents which produce changes in thought, mood, and perception, with little memory impairment, little stupor, narcissism or excessive stimulation, minimal autonomic side effects, and are not addicting, as they are defined by Hollister [Citation1]. Their psychotomimetic activity is expressed in relation to the chosen standard mescaline (UM) and defined as the ratio of the effective dose of mescaline to the effective dose of the tested compound [Citation2]. Among the well-known psychotomimetics are the phenethylamines [Citation3,Citation4], which will be the subject of the present study.
Table 1 Observed activities of studied phenethylamines.
The phenethylamine derivatives such as, amphetamine, methamphetamine, and mescaline that are known to display psychotomimetic activity, have been studied with different approaches so far [Citation5,Citation6]. As it is difficult to test this type of activity on humans being, theoretical research can circumvent these difficulties and allow obtaining precise data while taking advantage of the rapid progress of computing chemical quantum descriptors, which can be obtained easily from publicly available software. Those can be used to build a quantitative structure activity relationship (QSAR) model to enable calculation of the activity and prediction of the efficacy of new phenethylamines.
The QSAR of phenethylamine psychotomimetics still receives considerable attention because these agents represent a large family of abused substances and continue to be a source of new illicit drugs as witnessed over recent decades [Citation7]. Although QSAR of phenethylamines have previously been developed with steric and lipophilic descriptors [Citation1,Citation8] it is important to extend these with all available data.
The QSAR models described in the previosuly study [Citation8] focus on simple physico-chemical descriptors but are not sufficient for generating comprehensive structure–activity relationships. Electronic descriptors, which can be obtained by calculation, can describe defined molecular activities, and are not restricted to closely related compounds. Therefore, the development of QSAR models in which electronic descriptors are used has great potential [Citation9]. In recent years, some comparative QSAR studies have shown that employing the descriptors calculated using the density functional theory (DFT) method instead of the semi-empirical methods as AM1 or PM3, can improve the accuracy of the results and lead to more reliable QSAR models [Citation10]. Arulmozhiraja and Morita [Citation11] have studied relationships between the various DFT-based descriptors (absolute softness, electronegativity, and electrophilicity index) and the toxicity of 33 polychlorinated dibenzofurans (PCDFs), the results showed a moderate to satisfactory success for the DFT-based reactivity descriptors in the toxicological QSARs. Pasha et al. [Citation12] investigated quantum chemical reactivity descriptors based QSAR models on toxicity of phenol derivatives with AM1, PM3, PM5 and DFT methods, indicating that the DFT method is more reliable than other and has an improved predictive power.
This work is aimed at deriving correlation models, which explain the relationship between the psychotomimetic activity, and the structure of 46 phenethylamines compounds based on electronic, charge and physico-chemical descriptors using several chemometric methods such as principal component analysis PCA, multiple linear regression RML and non-linear regression MNLR.
2 Materials and methods
Psychotomimetic activities of 46 phenethylamines were taken from the literature [Citation2] the activity was expressed as MU (Mescaline Units) and is defined as mole mescaline/mole of the tested phenethylamine. and show the substituted structures of the studied compounds. For modeling, the data set was split into two sets. Thirty five molecules were chosen randomly to represent the quantitative model (Training set) and the rest were used to test the performance of the proposed model (test set). Additionally a leave-one-out protocol was performed on the training set for internal validation of the obtained models.
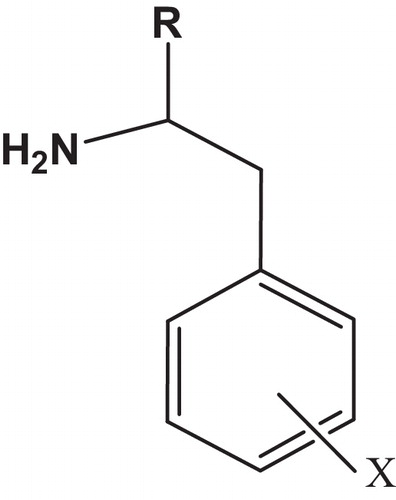
Fig. 1 The chemical structure of the studied compounds.
2.1 Molecular descriptors
To describe the compound structural diversity, a total of 13 descriptors encode three important properties have been calculated for each phenethylamine: (a) Charges descriptors, Qp: the net atomic charge on the para position; Qmin: the most negative net atomic charge; (b) electronic descriptors, ET (eV): the total energy; IP (eV): the ionization potential; EHOMO (eV): the highest occupied molecular orbital energy; ELUMO (eV): the lowest unoccupied molecular orbital energy; DM (Debye): the dipole moment and ɳ (eV): the absolute hardness [Citation13]; were calculated utilizing Gaussian 03 [Citation14] with the DFT calculations.
On the other hand, physico-chemical descriptors were calculated, namely: MW (g/mol): the molecular weight; D (g/cm3): the density; n: the refractive index; γ (dyne/cm3): the surface tension and (log P): the octanol/water partition coefficient, utilizing Chemsketch and ChemDraw softwares [Citation15]. Thus, descriptors data matrix of dimension of (46*13) was generated .
Table 2 The values of Molecular descriptors used in QSAR study.
2.2 Methodology
After the calculation of descriptors, a principal component analysis (PCA) [Citation16] was performed to eliminate the correlated descriptors (R > 0.8). The remaining descriptors were used to perform an MLR study with backward selection until a valid model including: the critical probability P-value <0.05 for all descriptors and for the complete model, The Fisher static, the coefficient of determination, the mean squared error and the multi-colinearity test. Later, the chosen variables in the best linear model were exploited to generate the applicability domain, then to evaluate a non-linear model.
2.3 Statistical analysis
In this study XLSTAT version 2013 [Citation17] was used to perform principal component analysis (PCA) multiple linear regression (MLR) and non-linear regression (MNLR).
The PCA is a mathematical technique used to reduce the dimensionality of a data set consisting of a large number of interrelated variables while retaining as much as possible of the variation present in the data set [Citation18], the method is mostly used as a tool in exploratory data analysis and for making predictive models.
Multiple linear regression (MLR) is a statistical method aimed to establish a mathematical relationship between a property of a given system and a set of descriptors that encode chemical information. Also it serves to select descriptors that are applied as input in multiple non-linear regression (MNLR).
2.4 Validation
The main objective of a QSAR study is to obtain a model with the highest predictive and generalization abilities. In order to evaluate the predictive power of the QSAR models developed, two principals (internal validation and external validation) were performed. For the internal validation the leave-one-out cross-validation (R2CV) was used to evaluate the stability and the internal capability of the models in the present paper. A high R2CV value means a high internal predictive power of a QSAR model and a good robustness. Nevertheless, the study of Globarikh [Citation19] indicated that there is no correlation between the value of R2CV for the training set and predictive ability of the test set, revealing that the R2cv is still inadequate for a reliable estimate of model's predictive power for all new chemicals. So, the external validation remains the only way to determine both the generalizability and the true predictive power of QSAR models for new chemicals. For this reason, the statistical external validation was applied to the models as described by Globarikh and Tropsha. Roy and Roy [Citation19–Citation21] using a test set.
3 Results and discussion
3.1 Data set for analysis
A QSAR Study was carried out for 46 phenethylamines as reported previously [Citation1,Citation8] in order to establish a quantitative relationship between their structures and the psychotomimetic activity. The values of the 13 calculated descriptors are listed in .
3.2 Principal component analysis
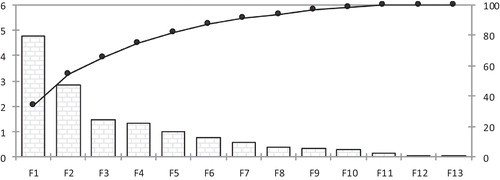
The principal component analysis (PCA) was performed to the 13 descriptors of the 46 molecules, 13 principal components were obtained (), the first four axis F1, F2, F3 and F4 represent respectively (34.1%; 20.3%; 10.6% and 9.6%) of the total variance and they estimate 74.7% of the total information.
Fig. 2 The principal components and their variances.
The PCA was performed to identify the correlation between the different descriptors. It is also helpful for understanding the distribution of the compounds [Citation22]. The correlation's matrix of the thirteen descriptors is shown in .
Table 3 Correlation matrix between different obtained descriptors.
The correlation coefficients in the obtained matrix provide the information about the high or low interrelationship between the descriptors. Generally good co-linearity (r > 0.5) [Citation23] was present between the majority of the variables. A high interrelationship was observed between γ and n (r = 0.951). Additionally, to decrease the redundancy existing in our data matrix, the descriptors that are highly correlated (R ≥ 0.8), were excluded.
3.3 Multiple linear regressions MLR
Based on the twelve remaining descriptors a mathematical linear model was proposed to predict quantitatively the physicochemical effects of substituents on the psychotomimetic activity of the 46 molecules by using backward regression. The best linear model using this method is only one contained five molecular descriptors: the total energy ET, the energy EHOMO, the energy ELUMO, the dipole moment (DM) and the surface tension (γ).
The following equation represents the QSAR model obtained using the backward regression linear multiple (RLM) method:(1)
(1)
R2 is the coefficient of determination, F is the Fisher statistic and MSE is the mean squared error. Higher coefficient of determination and lower mean squared error indicate that the model is more reliable. A P smaller than 0.05 means that the obtained equation is statistically significant at the 95% level. The obtained model was cross-validated by its applicable R2cvvalue (R2cv = 0.601) using the leave-one-out (LOO) method. A value of R2cv greater than 0.5 is the basic criteria to qualify a model as valid [Citation19].
The multi-collinearity between the above five descriptors were detected by calculating their variation inflation factors VIF as shown in ; Accordingly, it has been found that the descriptors used in the proposed model have very low-inter-correlation.The VIF [Citation24] was defined as 1/(1 − R2), where R is the coefficient of correlation between one descriptor and all the other descriptors in the proposed model. A VIF value greater than 5.0 indicates that the model is unstable, a value between 1.0 and 4.0 indicates that the model is acceptable.
Table 4 Multicolinearity test.
Negative values in the regression coefficients show that the indicated variables (ET, ELUMO, DM and γ) contribute negatively to the value of log UM, whereas positive value in the regression coefficient of variable (EHOMO) indicates that the greater the value of the variable, the greater the value of the log UM. Put differently, increasing the Total energy ET, the energy ELUMO, the dipole moment, (DM) and the surface tension (γ) will decrease the log UM. While the increase in the energy EHOMO will increase the log UM of the phenethylamines.
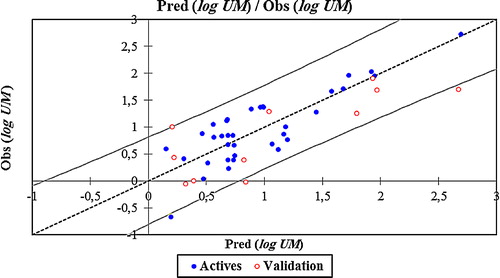
The correlations of the predicted and observed activities are illustrated in . The descriptors proposed in Eq. Equation(1)(1)
(1) by MLR are then used as the input parameters in the multiple nonlinear regressions (MNLR).
Fig. 3 Graphical representation of calculated and observed activity (log UM) values calculated by MLR model.
3.4 Multiples nonlinear regression (MNLR)
The nonlinear regression model was used also to improve the structure–activity in quantitative manner to evaluate the effect of the substituents on the psychotomimetic activity. Both training set and descriptors selected by MLR were used in this method to build the non-linear model. The best regression performance was selected according to the coefficient of determination R2 and the mean squared error MSE, a pre-programmed function in the XLSTAT was used to evaluate the nonlinear regression model as follows:where X1, X2, X3, X4, … represent the variables, and a, b, c, d, … represent the parameters.
The resulting equation is as follows:(2)
(2)
The obtained model Eq. Equation(2)(2)
(2) was cross-validated by its applicable R2cvvalue (R2cv = 0.635) using the leave-one-out (LOO) method. A value of R2cv greater than 0.5 is the basic criteria to qualify a model as valid [Citation19]. It can be seen clearly from the key statistical indicators, coefficient of determination R2, mean squared error MSE and, value of R2cv, that the predicting ability of this model is better than that of the linear model (MLR). The enhancement in the predictive ability was due to the involvement of the squared terms in the non-linear model.
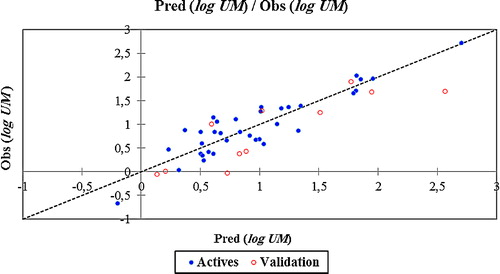
shows the correlation between the predicted and observed log UM values.
Fig. 4 Graphical representation of calculated and observed activity (log UM) values calculated by MNLR model.
3.5 Applicability domain
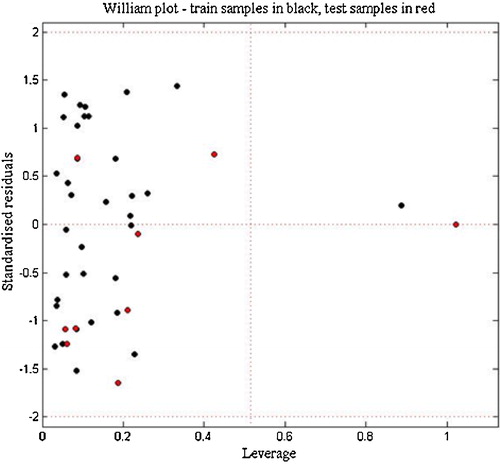
The utility of a QSAR model is its accurate prediction ability for new chemical compounds, so, once the QSAR model is built, its domain of applicability (AD) must be defined. A model is considered valid only within its training domain and only the prediction for new compounds falling within its applicability domain can be considered reliable and not model extrapolations. The most common method to define the AD, it is based on the determination of the leverage value of each compound [Citation21]. The Williams plot (the plot of standardized residuals versus leverage values (h)) is used in the present study to visualize the AD of the QSAR model.where the xi is the descriptor vector of the considered compound, X is the descriptor matrix derived from the training set descriptor values, the threshold is defined as:
where n is the number of compound in the training set, k is the number of the descriptors in the proposed model, a leverage (h) greater than the threshold (h*) indicates that the predicted response is an extrapolation of the model and, consequently, it can be unreliable.
The Williams plot of the presented MLR model is shown in the , the applicability domain is established inside a squared area within ±2 standard deviation and a leverage threshold h* of 0.51. As shown in the Williams plot the majority of the compounds in the data set are in this area, except one (compound 7) in test set exceeds the threshold and it is considered as an outlier compound, also, compound 1 in the training set is considered as an outlier because it exceeds the crucial hat value. These erroneous predictions could probably be attributed to the presence of the bromine on the para position in chemicals 1 and 7, whereas, the majority of compounds are substituted by alkyls, simple ether or thioether groups on this position.
Fig. 5 Williams plot for the training set and external validation for the psychotomimetic activity of phenethylamines compounds, listed in (h* = 0.51 and residual limits ±2).
3.6 External validation
To test the prediction ability of the obtained models: MLR and MNLR, it is required the use of a test set for external validation. Thus, the models generated on the training set using 35 phenethylamines were used to predict the activity of the 11 remaining molecules. The parameters of the performance of the generated models are shown in . It can be seen clearly that the MNLR is statically better than the MLR model.
Table 5 the statistical results of MLR and MNLR models with validation techniques.
Among the obtained models, the MNRL model has the highest determination coefficients for the training set (R2 = 0.825) and test set (R2test = 0.746), also the highest Cross-validation coefficient (R2CV = 0.635), all that support the applicability of the proposed MNLR prediction model, because the MNLR approach yields better results than those of MLR. However, both the results obtained by the MLR and MNLR should be regarded as satisfactory for predicting the psychotomimetic activity using the proposed descriptors.
4 Conclusion
To predict the psychotomimetic activity of substituted phenethylamines compounds, two unambiguous models were developed in this study. Good stability and great prediction ability were achieved by each model. Furthermore, the MNLR results are better, compared to those obtained from the MLR models. So, the MNLR model is considered as an effective tool to predict psychotomimetic activity of substituted phenethylamines based on the proposed descriptors.
The accuracy and predictability of the proposed models were checked based on the domain of applicability and by comparing key statistical indicators, such as the R or R2 of the obtained models using different statistical tools, as shown in . To validate these results, a test set was used, as shown in .
Table 6 Observed values and calculated values of log UM according to different methods.
Finally, we concluded that the electronic and physic-chemical descriptors used are able to encode the structural features of the studied compounds, and they could be used successfully with other descriptors for the development of unambiguous predictive QSAR models.
Acknowledgment
We are grateful to the “Association Marocaine des Chimistes Théoriciens” (AMCT) for its pertinent help concerning the programs.
Notes
Peer review under responsibility of Taibah University
References
- L.E.HollisterChemical Psychoses: LSD and Related Drugs1968Charles C. ThomasSpringfield, IL
- M.ThakurA.ThakurP.V.KhadikarQSAR studies on psychotomimetic phenylalkylaminesBioorg. Med. Chem.122004825831
- A.T.ShulginA.ShulginPIHKAL. A Chemical Love Story1991Transform PressBerkeley, CA
- R.A.GlennonClassical hallucinogensC.R.SchusterM.J.KuharPharmacological Aspects of Drug Dependence. Handbook of Experimental Pharmacology Series1996BerlinSpringer343371
- R.A.GlennonPharmacol. Biochem. Behav.6421999251
- R.A.GlennonG.C.LinR.A.GlennonHallucinogens an Update1994National Institute on Drug AbuseWashington, DC432
- R.A.GlennonT.L.LemkeD.A.WilliamsV.FRocheS.W.ZitoHallucinogens, Stimulants, and Related Drugs of Abuse2008Foye's principals of Medicinal ChemistryPhiladelphia631
- M.MracecL.KuruncziT.NusserZ.SimonG.Nàray-SzaboQSAR study with steric (MTD), electronic and hydrophobicity parameters on psychotomimetic phenylalkylaminesJ. Mol Struct. (Theochem)3671996139149
- E.ZvinavasheT.DuT.GriffH.H.van den BergA.E.SoffersJ.VervoortA.J.MurkI.M.RietjensQuantitative structure–activity relationship modeling of the toxicity of organothiophosphate pesticides to Daphnia magna and Cyprinus carpioChemosphere75200915311538
- E.ErogluH.TürkmenA DFT-based quantum theoretic QSAR study of aromatic and heterocyclic sulfonamides as carbonic anhydrase inhibitors against isozyme CA-IIJ. Mol. Graph. Model.262007701708
- S.ArulmozhirajaM.MoritaStructure–activity relationships for the toxicity of polychlorinated dibenzofurans: approach through density functional theory based descriptorsChem. Res. Toxicol.172004348356
- F.A.PashaH.K.SrivastavaP.P.SinghComparative QSAR study of phenol derivatives with the help of density functional theoryBioorg. Med. Chem.13200568236829
- H.ChermetteChemical reactivity indexes in density functional theoryJ. Comp. Chem.201999129154
- M.J.FrischGaussian 03 Revision B.012003Gaussian, Inc.Pitts-burgh, PA
- Advanced Chemistry Development, Inc., Toronto, Canada2009www.acdlabs.com/resources/freeware/chemsketch/
- M.LarifA.AdadR.HmamouchiA.I.TaghkiA.SoulaymaniA.ElmidaouiM.BouachrineT.LakhlifiBiological activities of triazine derivatives combining DFT and QSAR resultsArab. J. Chem.201610.1016/j.arabjc.2012.12.033465 (in press)
- XLSTAT Software2013XLSTAT Companyhttp://www.xlstat.com
- I.T.JolliffePrincipal Component Analysissecond ed.2002SpringerAberdeen
- A.GlobarikhA.TropshaBeware of q2!J. Mol. Graph. Model.202002269276
- P.P.RoyK.RoyOn some aspects of variable selection for partial least squares regression modelsQSAR Comb. Sci.272008302313
- P.GramaticaPrinciples of QSAR models validation: internal and externalQSAR Comb. Sci.262007694701
- S.ChtitaM.LarifM.GhamaliM.BouachrineT.LakhlifiDFT-based QSAR studies of dibenzo[a,d]cycloalkenimine derivatives for non competitive antagonists of N-methyl-d-aspartate based on density functional theory with electronic and topological descriptorsJ. Taibah Univ. Sci.922014143154
- M.GhamaliS.ChtitaR.HmamouchiA.AdadM.BouachrineT.LakhlifiThe inhibitory activity of aldose reductase of flavonoid compounds: combining DFT and QSAR calculationsJ. Taibah Univ. Sci.102016534542
- R.M.O’BrienA caution regarding rules of thumb for variance inflation factorsQ. Quantity412007673690