
 ?Mathematical formulae have been encoded as MathML and are displayed in this HTML version using MathJax in order to improve their display. Uncheck the box to turn MathJax off. This feature requires Javascript. Click on a formula to zoom.
Abstract
Two simple and sensitive spectrophotometric methods are described for the determination of ethionamide (ETM) in pure drug and tablets. The first method is based on the reduction of Folin–Ciocalteu (F–C) reagent by ETM in sodium carbonate medium to form a blue coloured complex, which was measured at 760 nm (Molybdenum–tungsten blue method). In the second method (Prussian blue method), iron(III) was reduced to iron(II) by ETM in HCl medium, in which iron(II) was complexed with ferricyanide, and the resulting Prussian blue was also measured at 760 nm. The absorbance measured in each case was related to the ETM concentration. The experimental conditions were carefully studied and optimised. Beer’s law was obeyed in concentration ranges of 1–40 μg/ml and 0.2–4.0 μg/ml with the Molybdenum-tungsten blue method and the Prussian blue method, respectively, with corresponding molar absorptivity values of 5.72 × 10³ and 3.18 × 10⁴ l/(mol·cm). The limits of detection (LOD) and quantification (LOQ) were 0.09 and 0.27 μg/ml for the Molybdenum-tungsten blue method and 0.01 and 0.04 μg/ml for the Prussian blue method. Within-day and between-day relative standard deviations (%RSD) at three different concentration levels were <3%, and the respective relative errors (%RE) were ≤2%, implying good accuracy and precision of the methods. The proposed methods were successfully applied to the determination of ETM in bulk powder and tablets, and the results demonstrated that the methods were as accurate and precise as the official method.
1 Introduction
Ethionamide (ETM), chemically known as 2-ethylthioisonicotinamide, is a second-line, orally administered drug for the treatment of multi-drug resistant tuberculosis (MDR-TB) [Citation1]. ETM is efficacious, relatively non-toxic, cheap, readily available, and has been in use since the 1960s [Citation2]. The drug is officially in the United States Pharmacopoeia [Citation3], which describes a UV-spectrophotometric method for its assay. In the British Pharmacopoeia (BP) [Citation4], the drug is identified by potentiometric titration with HClO4 in anhydrous acetic acid medium. Analytical methods reported for the determination of ETM in bodily fluids are generally based on chromatographic techniques, such as high performance liquid chromatography [Citation5–Citation10] and liquid-chromatography-tandem mass spectrometry [Citation11], because of the high sensitivity required in such matrices.
Published methods for the determination of ETM in bulk drug and tablets are based on some techniques such as titrimetry (with visual [Citation12] or potentiometric [Citation13,Citation14] end point detection), fluorimetry [Citation15] and visible spectrophotometry employing various chromogenic agents such as dichlone [Citation16,Citation17], iron(III) [Citation18], iron(III)-p-phenylenediamine [Citation19], sodium nitroprusside [Citation20,Citation21], pyridylazo-resorcinol-vanadium [Citation22], osmic acid [Citation23], alizarin violet 3B and alizarin brilliant violet R [Citation24], N-bromosuccinimide (NBS)-celestine blue (CB) [Citation25], permanganate [Citation26] and iodine [Citation27].
The indirect method [Citation25] based on the redox reaction requires the concentration of both the oxidant (NBS) and the dye (CB) to be accurately known. On the other hand, the other two methods [Citation26,Citation27] are based on the measurement of an absorbance change as a function time (kinetic), thus requiring careful control of all the experimental variables involved. The remaining spectrophotometric methods involve drastic experimental conditions, less sensitive and/or are applicable over narrow linear dynamic concentration ranges.
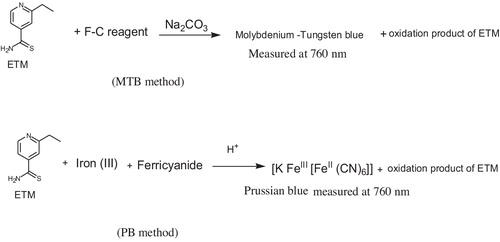
This paper describes two simple, sensitive and validated spectrophotometric methods based on a redox reaction employing reagents whose concentrations do not need to be accurately known. The methods are based on the reduction of either Folin–Ciocalteu (F–C) reagent by ETM in alkaline medium to molybdenum-tungsten blue (Molybdenum-tungsten blue method) or iron(III) to (II) in acid medium, which is subsequently complexed with ferricyanide to yield Prussian blue (Prussian blue method). The coloured product is measured at 760 nm in both methods. The reaction conditions were thoroughly studied, and under optimum conditions, the Prussian blue method provides a highly sensitive procedure for the determination of ETM in commercial drug products.
2 Experimental
2.1 Apparatus
A Systronics model 166 digital spectrophotometer (Systronics, Ahmedabad, Gujarat, India) with matched 1-cm quartz cells was used for absorbance measurements.
2.2 Materials and methods
A pure ethionamide (ETM) sample, certified to be 99.86% pure, was procured from Panacea Biotic Ltd., New Delhi, India, as a gift and was used as received.
ETM-containing tablets, i.e., Ethide (Lupin Ltd., Mumbai, India), Ethiokox (Radicura Private Ltd., New Delhi, India) and Myobid (Panacea Biotic, New Delhi, India), each contained 250 mg of active ingredient and were purchased from local commercial sources.
A Folin–Ciocalteu (F–C) reagent solution (1:1) was prepared by mixing 50 ml of the F–C reagent (Merck, Mumbai, India) with 50 ml of water in a 100 ml calibrated flask.
An iron(III) solution, i.e., a solution of 1% (w/v) FeCl3·6H2O, was prepared by dissolving 1 g of the chemical (S.D. Fine Chem. Ltd., Mumbai, India) in 100 ml of 0.1 M HCl (Merck, Mumbai, India).
A potassium ferricyanide solution, i.e., a solution of 0.5% (w/v) ferricyanide, was prepared by dissolving 0.5 g of the chemical (Glaxo Laboratory, Mumbai, India) in 100 ml of water.
A sodium carbonate solution, i.e., a solution of 20% (w/v) Na2CO3, was prepared by dissolving 20 g of the chemical (S.D. Fine Chem. Ltd., Mumbai, India) in 100 ml of water.
A standard stock ETM solution (100 μg/ml) was prepared by dissolving the calculated quantity of pure drug in 0.1 M HCl for use in the Molybdenum-tungsten method. The stock solution was diluted to 20 μg/ml with 0.1 M HCl for use in the Prussian blue method.
2.3 General procedures
2.3.1 Preparation of calibration curves
2.3.1.1 Molybdenum-tungsten blue method (MTB method)
Different aliquots (0.1, 0.2, 0.5, 1.0, 2.0, 3.0, 4.0 ml) of a 100 μg/ml standard ETM solution were accurately transferred into a series of 10 ml calibrated flasks. Subsequently, 1.5 ml of the Na2CO3 and F–C reagent solutions were sequentially added to each flask, and the volume was increased with water to the required mark; the solution was then mixed well. After 10 min, the absorbance of each solution was measured at 760 nm versus the reagent blank.
2.3.1.2 Prussian blue method (PB method)
Aliquots of the 20 μg/ml ETM solution (0.1, 0.2, 0.5, 1.0, 1.5, 2.0 ml) were placed in a series of 10 ml calibrated flasks. Two millilitres of both iron(III) and ferricyanide solutions were added to each flask, followed by the addition of 2.0 ml of concentrated HCl. The volume was brought to 10 ml with 0.1 M HCl and mixed well. The flasks were incubated for 30 min, and the absorbance was measured at 760 nm versus the reagent blank.
In each case, the standard graph was prepared by plotting the measured absorbance versus the concentration of ETM, and the concentration of the unknown was computed using the regression equation derived from Beer’s law data.
2.3.2 Procedure for tablets
Twenty tablets were accurately weighed and ground into a fine powder. A portion of the powder, equivalent to 20 mg of ETM, was accurately weighed and transferred into a 100 ml calibrated flask. Sixty millilitres of 0.1 M HCl were added, and the solution was shaken for 20 min. The volume was diluted to the mark with 0.1 M HCl and mixed well, and the insoluble residue was removed by filtration with Whatman 42 filter paper. The filtrate (200 μg/ml of ETM) was diluted to 100 and 20 μg/ml levels for the MTB method assay and the PB method assay, respectively. A one millilitre standard solution in five replicates were used for analysis in both the methods.
2.3.3 Procedures for method validation
All assay validation procedures were carried out according to current ICH guidelines [Citation28], which include linearity, limits of detection (LOD) and quantification (LOQ), intra-day and inter-day precision and accuracy, robustness and ruggedness, selectivity and recovery.
2.3.3.1 Linearity, LOD and LOQ
Linearity was assessed by analysing a set of seven/six calibration standards. Calibration curves were prepared as described above in the “Preparation of calibration curves” Section 2.3.1. The linearity of the methods was determined by plotting the absorbance (Y) against the theoretical concentration (X) of ETM. Calibration measurements were subjected to least square regression analysis to obtain information related to the slope, the Y-intercept, the correlation coefficient (r) and the back-calculated concentrations. The coefficient of correlation should be 0.9800 or greater. The LOD and LOQ values were calculated using the following formulas [Citation29]:where S is the standard deviation of replicate (n = 7) blank absorbances, and m is the slope of the calibration curve.
2.3.3.2 Precision and accuracy
To evaluate the precision and accuracy of the methods, a standard drug solution at three concentration levels was subjected to same day (intra-day) analysis in seven replicates, as well as on five consecutive days (inter-day analysis) by preparing all solutions a fresh each day. The mean and standard deviations (SD) were obtained by back-calculated drug concentration at each level. The accuracy and precision were evaluated in terms of relative error (RE) and relative standard deviation (RSD), respectively.
2.3.3.3 Robustness and ruggedness
Robustness was examined by evaluating the influence of small variations in method variables, including the amounts of analytical reagents and the reaction time, on the performance of the proposed methods. In these experiments, one parameter was changed while the others were kept unchanged, and the %RSD was calculated each time. Ruggedness was also tested by applying the proposed methods to determine ETM using the same experimental conditions by three analysts using the same instrument (inter-personnel) and also by a single analyst using three different instruments (inter-instrument). These assays were performed at three concentration drug levels.
2.3.3.4 Selectivity
The selectivity of the methods was examined using placebo blank and synthetic mixture analyses. A placebo blank, whose composition is 20 mg talc, 30 mg starch, 20 mg sucrose, 20 mg lactose, 10 mg gelatin, 20 mg sodium alginate, 30 mg magnesium stearate, and 20 mg methyl cellulose, was prepared by homogeneous mixing in a mortar. Ten milligrams of the placebo was placed in a 50 ml calibration flask, and its extract was prepared as described in Section 2.3.2. Two millilitres of the extract were analysed according to general procedures. Twenty milligrams of pure ETM was added to 10 mg of the previously prepared placebo blank, and the solution was thoroughly mixed. The mixture was quantitatively transferred to a 100 ml calibrated flask, and the steps described in Section 2.3.2 were followed.
3 Results and discussion
3.1 Absorption spectra
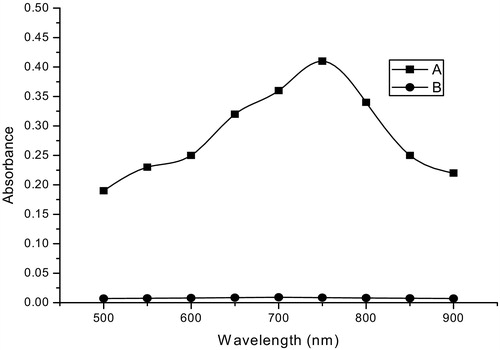
The quantitative determination of many phenolic and amino compounds of pharmaceutical importance using F–C reagent is well-known [Citation30–Citation37] and involves the reduction of the yellow molybdotungsto phosphoric acid heteropolyanion reagent by the phenols or amines and the measurement of the absorbance of the resultant molybdotungstrate blue [Citation38,Citation39]. In the present MTB method, F–C reagent was reduced by ETM in sodium carbonate medium to produce an intense, blue-coloured product [Citation38,Citation39] that peaks at 760 nm ().
Fig. 1 Absorption spectra of the MTB method: (A) Reaction product of ETM (15 μg/ml) with F–C reagent in Na2CO3 solution; (B) the blank.
In the PB method, due to the reducing nature of ETM, iron(III) was reduced to iron(II) in acid medium. Subsequently, the iron(II) formed in situ reacted with ferricyanide to form soluble Prussian blue, [KFeIII[FeII(CN)6]] similar to previous reports [Citation40–Citation45]. Prussian blue also absorbs maximally at 760 nm (). The possible reaction pathways are presented in .
Fig. 2 Absorption spectra of PB method: (A) Reaction product of ETM (2 μg/ml) with iron(III) and ferricyanide in HCl medium; (B) the corresponding blank.
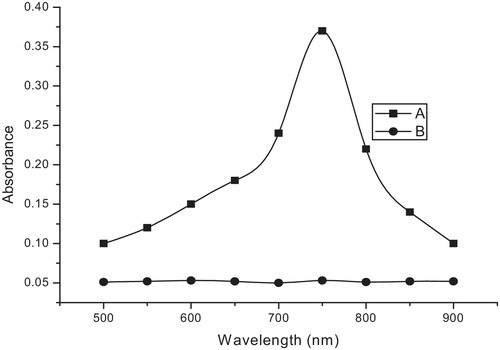
Fig. 3 Possible reaction pathways yielding coloured species.
3.2 Method development
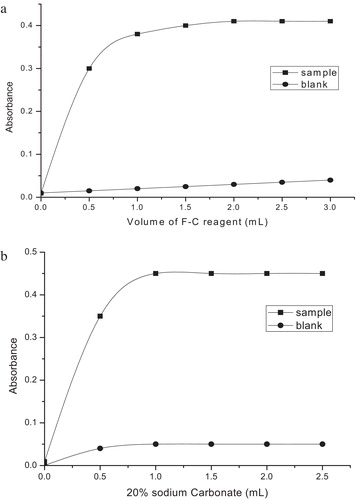
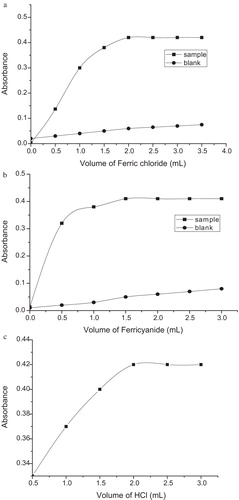
In the MTB method, the experimental variables, i.e., the contact time, the amount of F–C reagent and sodium carbonate, and addition order of the reactants, were carefully studied and optimised. Maximum absorbance was reached 10 min after mixing the reactants, and the colour remained stable for as long as 24 h. Equal volumes (1.5 ml each) of the F–C reagent (1:1) and sodium carbonate (20%) solutions were found to be optimal at a total volume of 10 ml, as shown in a and b. With respect to the addition order of reactants, the order indicated in the recommended procedure yielded coloured species with higher sensitivity and stability.
Fig. 4 (a) Effect of the F–C reagent concentration (ETM, 15 μg/ml). (b) Effect of 20% Na2CO3 (ETM, 15 μg/ml).
Blue colour formation in the PB method was found to be somewhat slow, and maximum colour intensity was achieved after 30 min, remaining stable for an addition 60 min under optimum conditions. Two millilitres of both iron(III) and ferricyanide solutions, as well as concentrated HCl, added sequentially, resulted in maximal sample colour intensity and minimal blank absorbance as indicated in a–c.
Fig. 5 (a) Effect of the iron(III) concentration (ETM, 2.0 μg/ml). (b) Effect of the potassium ferricyanide concentration (ETM, 2.0 μg/ml). (c) Effect of the HCl concentration (ETM, 2.0 μg/ml).
4 Method validation
4.1 Linearity and sensitivity
A linear correlation was found between the absorbance at λmax and the ETM concentration in the ranges given in . The graphs (a and b) showed a negligible intercept, as described by the regression equation:where Y is the measured absorbance, X is the concentration in μg/ml, and m and b are the slope and intercept, respectively. Regression analysis of Beer’s law data using the method of least squares was used to calculate the slope (m), the intercept (b) and the correlation coefficient (r) of each system. These values are presented in . Beer’s law ranges, molar absorptivity values and Sandell’s sensitivity values are shown in . The calculated values of limits of detection (LOD) and quantification (LOQ) are also included in , highlighting the high sensitivity of these methods.
Fig. 6 (a) Calibration curve for the Molybdenum-tungsten blue method. (b) Calibration curve for the Prussian blue method.
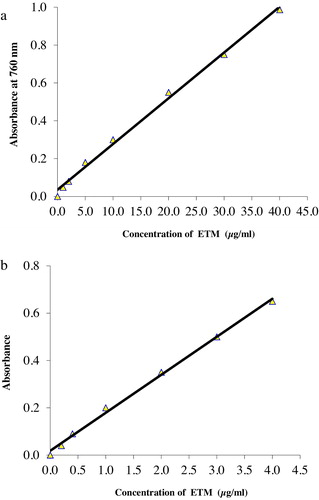
Table 1 Sensitivity and regression parameters.
4.2 Accuracy and precision
The results of intra-day and inter-day precision and accuracy for the proposed methods are presented in . The precision is expressed as the %RSD for the intra-day (reproducibility) and the inter-day (intermediate precision) assays. The precision for the intra-day and the inter-day assays were 1.6% and 2.5%, respectively. The accuracy, expressed as the percentage deviation between nominal and measured concentrations, was in the range of 0.8–2.0% for the intra-day and 1.5–2.0% for inter-day assays.
Table 2 Evaluation of intra-day and inter-day accuracy and precision.
4.3 Robustness and ruggedness
The results of this study, expressed as the intermediate precision (%RSD), are given in . Small alterations in method variables did not significantly affect the results, as shown by low values of %RSD (<3%). The results for person-to-person and instrument-to-instrument variations were also reproducible, with %RSD values of approximately 2%.
Table 3 Method robustness and ruggedness expressed as intermediate precision (% RSD).
4.4 Selectivity
Replicate analyses of the placebo blank showed absorbance almost equal to that of reagent blank. When the synthetic mixture was subjected to analyses at three concentration levels by the proposed methods, the percent recoveries of pure drug ranged from 98.56 ± 0.88 to 102.6 ± 1.17, indicating non-interference from the inactive ingredients.
4.5 Application to tablets
Three brands of 250 mg strength tablets were analysed by the proposed methods, and the results are presented in . The same tablets were also analysed by the reference method [Citation4] for comparison. The reference method involved the potentiometric titration of acetous solution of tablet with acetous HClO4. The results revealed that there is close agreement between the results obtained by the proposed methods and those of the reference method. Indeed, the results are close to the label claim. When the results were statistically evaluated by applying Student’s t-test for accuracy and variance ratio F-test for precision, the calculated t- and F-values did not exceed the tabulated values at the 95% confidence level and for four degrees of freedom. This suggested that the new methods and the reference method have similar accuracy and precision.
Table 4 Results of analysis of tablets by the proposed methods and statistical comparison of the results with the official method.
4.6 Accuracy by recovery study
Accuracy of the proposed methods was further confirmed by recovery study following the standard-addition procedure. Pre-analysed tablet powder was spiked with pure ETM at three concentrations, and the total amount was determined by the proposed methods. The percent recovery values of pure drug added to tablet powder are shown in . These results unambiguously demonstrate that inactive ingredients such as talc, gelatin, starch, magnesium stearate, sodium alginate, methylcellulose, etc., do not interfere with the determination of the active ingredient.
Table 5 Results of recovery experiment through standard-addition method.
5 Conclusion
The spectrophotometric methods described in this study were found to be simple and did not involve any critical experimental variables compared to most reported methods. The methods were demonstrated to be both accurate and precise, as well as robust and rugged. Both systems have wide linear dynamic ranges of applicability. Furthermore, the Prussian blue method had an ɛ value of 3.18 × 10⁴ l mol−1 cm−1, which is the most sensitive one ever reported for ETM (). The reference method [Citation4] requires a rigorous anhydrous medium for accurate endpoint detection, as well as the generation of a large quantity of organic solvent as waste. This creates a waste disposal problem; therefore, it is not a green method. Additionally, the reference method is applicable to a macro scale (300 mg drug per trial). In contrast, the proposed methods seldom employ organic solvents and are applicable over a micro scale (μg/ml). These advantages, coupled with the use of cheap and readily available chemicals and simple instrumentation, make the methods suitable for use in quantity control laboratories in developing and underdeveloped countries that can ill-afford the expensive techniques such as HPLC.
Table 6 Comparison of the proposed and the existing spectrophotometric methods.
Acknowledgements
The gift sample of Ethionamide by Panacea Biotec Ltd. is gratefully acknowledged. Prof. K. Basavaiah wishes to thank the University Grants Commission, New Delhi. India, for the BSR faculty fellowship award. The first author is thankful to the UGC New Delhi, India, for financial assistance through a Junior Research Fellowship.
Notes
Peer review under responsibility of Taibah University.
References
- J.E.ConteJ.A.GoldenM.McquittyJ.KippsE.T.LinE.ZurlindenEffect of AIDS and gender on steady-state plasma and intrapulmonary ethionamide concentrationsAntimicrob. Agents Chemother.44200013371341
- V.A.OngayaW.A.GithuiH.MemeC.KiiyukiaE.JumaHigh ethionamide resistance in Mycobacterium tuberculosis strains isolated in KenyaAfr. J. Health Sci.2020123741
- United States Pharmacopeia, USP 32-NF 27 P 2324, Pharmacopeial Forum: Vol. 33, p. 648.
- British Pharmacopeia Volume I & II Monographs: Medicinal and Pharmaceutical Substances2009EthionamideLondon, UK
- A.U.MadniM.AhmadN.AkhtarM.AshrafZ.A.ShujaAn improved HPLC method for the determination of ethionamide in serumJ. Chem. Soc. Pak.302008449452
- C.A.PeloquinG.T.JamesE.McCarthyImproved high-performance liquid chromatographic assay for the determination of ethionamide in serumJ. Chromatogr. B5631991472475
- M.J.RuseR.H.WaringHPLC analysis of ethionamide and their sulfoxidesMed. Sci. Res.1819905354
- A.M.HarnanansinghL.EidusMicro method for the determination of ethionamide in serumInter. J. Clin. Pham. Ther. Toxi.31970128131
- M.I.WalashA.M.El-BrashyM.E.S.MetwallyA.A.AbdelalFluorimetric determination of carbocisteine and ethionamide in drug formulationActa Chem. Slov.512004283291
- C.J.BhanushaliA.S.ZidanZ.RahmanM.J.HabibIon-pair chromatography for simultaneous analysis of ethionamide and pyrazinamide from their porous microparticlesAAPS Pharm. Sci. Tech.14201313131320
- A.Y.DeshpandeS.GuravR.PundeV.ZambreR.KulkarniS.PandeyA.MungantiwarR.MullangiDevelopment and validation of a highly sensitive LC–MS/MS method for simultaneous quantitation of ethionamide and ethionamide sulfoxide in human plasma: application to a human pharmacokinetic studyBiomed. Chromatogr.252011985994
- B.S.ReddyR.R.KrishnaC.S.P.SastryTitrimetric determination of some antitubercular drugs by sodium nitrite and N-bromosuccinimide (NBS) using internal indicatorsIndian Drugs.2019822829
- W.CiesielskiA.KrencU.ZlobinskaPotentiometric titration of thioamides and mercaptoacids with iodine in alkaline mediumChem. Anal. (Warsaw, Poland)502005397405
- S.I.ObtemperanskayaM.M.BuzlanovaI.V.KarandkiPotentiometric determination of some drugs and other physiologically active substances using a silver sulfide ion-selective electrodeJ. Anal. Chem.511996419423
- M.I.WalashA.M.El-BrashyM.E.S.MetwallyA.A.AbdelalFluorimetric determination of ethionamide in pharmaceutical preparations and biological fluidsChin. Chem. Soc.51200410591064
- M.M.BedairUse of 2,3-dichloro-1,4-naphthoquinone for the spectrophotometric assay of five thio compounds of pharmaceutical importanceAlexandria J. Pharm. Sci.519916467
- M.B.DevaniC.J.ShishooH.J.ModyP.K.RajaDetection of thioamides: determination of ethionamide with 2,3-dichloro-1,4-naphthoquinoneJ. Pharm. Sci.63197414711473
- A.K.ShahY.K.AgrawalS.K.BanerjeeSpectrophotometric method for the rapid determination of microgram amount of ethionamideAnal. Lett.14198114491464
- M.S.El-DinF.BelalS.HassanSpectrophotometric determination of some pharmaceutically important thione-containing compoundsZentralbl. Pharm. Pharmakother. Laboratoriumsdiagn.1271988133135
- F.A.IbrahimColorimetric estimation of certain thione compounds of pharmaceutical importanceMansoura J. Pharm. Sci.101994334344
- M.B.DevaniC.J.ShishooK.DoshiA spectrophotometric determination of ethinamide in tabletsIndian J. Pharm. Sci.431981149150
- H.Sikorska–TomickaSpectrophotometric determination of ethionamide and thionicotinamide with 4-(2-pyridylazo) resorcinol and vanadiumChem. Anal. (Warsaw, Poland)381993745751
- H.Sikorska-TomickaSpectrophotometric determination of ethionamide and thionicotinamide with osmic acidMikrochem. Acta31986151157
- B.S.ReddyC.S.P.SastryIon-pair extraction method for ethambutol, ethionamide and rifampicin determinationJ. Inst. Chem. (India)5519836970
- C.S.P.SastryK.R.SrinivasK.M.M.PrasadSpectrophotometric determination of drugs in pharmaceutical formulations with N-bromosuccinimide and Celestine blueMikrochem. Acta12219967786
- M.I.WalashA.M.El-BrashyM.E.S.MetwallyA.A.AbdelalSpectrophotometric and kinetic determination of some sulphur containing drugs in bulk and drug formulationsBull. Kor. Chem. Soc.252004517524
- M.I.WalashM.E.S.MetwallyA.M.El-BrashyA.A.Abdelalkinetic spectrophotometric determination of some sulfur containing compounds in pharmaceutical preparations and human serumIl Farmaco58200313251332
- International Conference on Harmonization of Technical Requirements for Registration of Pharmaceuticals for Human Use, ICH Harmonisation Tripartite Guideline, Validation of Analytical Procedures: Text and Methodology: Q2 (R 1), Complementary Guideline on Methodology dated 06 November 1996, London, incorporated in November 2005.
- J.C.MillerJ.N.MillerSignificance Tests in Statistic in Analytical Chemistry3rd ed.1993Ellis HorwoodChichester (Chapter 3)
- N.P.SanderH.JacobsApplication of the Folin–Ciocalteu reagent to the determination of salbutamol in pharmaceutical preparationsTalanta42199513851388
- A.V.PrasadP.A.DeviC.S.P.SastryU.V.PrasadAssay of minocycline and tylosin using – Folin–Ciocalteu reagentEast Pharm.220036768
- K.BasavaiahH.C.PrameelaSpectrophotometric determination of diclofenac sodium using Folin–Ciocalteu reagent in bulk drug and in dosage formEast Pharm.120026163
- K.B.VinayH.RevenasiddappaA.M.SameerSensitive spectrophotometric determination of tramadol hydrochloride in pharmaceuticals using Folin–Ciocalteu reagentTurk. J. Pharm. Sci.1020135768
- C.S.P.SastryA.R.M.RaoApplication of Folin–Ciocalteu reagent for the spectrophotometric determination of some nonsteroidal anti-inflammatory agentsJ. Pharmaco Methods191988117125
- A.S.AhmadN.RahmanF.IslamSpectrophotometric determination of ampicillin, amoxicillin, and carbenicillin using Folin–Ciocalteu phenol reagentJ. Anal. Chem.592004119123
- S.A.PatelN.M.PatelM.M.PatelSpectrophotometric estimation of cefotaxime and ceftriaxone in pharmaceutical dosage formIndian J. Pharm. Sci.682006101103
- D.K.SinghB.SrivastavaA.SahuSpectrophotometric determination of ajmaline and brucine by Folin Ciocalteu’s reagentJ. Serb. Chem. Soc.682003685690
- V.L.SingletonJ.A.RossiColorimetry of total phenolics with phosphomolybdic phosphotungstic acid reagentsAm. J. Enol. Vitic.161965144158
- K.SlinkardV.L.SingletonTotal phenol analysis: automation and comparison with manual methodsAm. J. Enol. Vitic.2819774955
- P.NagendraSpectrophotometric estimation of paracetamol in bulk and pharmaceutical formulationsE-J. Chem.82011149152
- N.PadmarajaiahD.D.NandipuraM.M.G.NetkalS.R.KanchugarakoppalA simple spectrophotometric determination of some phenothiazine drugs in pharmaceutical samplesAnal. Sci.16200011271131
- K.BasavaiahU.ChandrashekarSensitive micro analysis of frusemide (furosemide) in bulk drug and formulations by visible spectrophotometry and high performance liquid chromatography (HPLC)Indian J. Chem. Tech.122005401406
- L.GuoY.ZhangQ.LiSpectrophotometric determination of perphenazine with the detection system of potassium ferricyanide-Fe (III) in pharmaceutical and serum samplesSpectrochim. Acta A: Mol. Biomol. Spectrosc.742009307311
- B.HemmateenejadR.MiriR.KamaliA kinetic spectrophotometric method for determination of amlodipine and nifedipine in pharmaceutical preparationsJ. Iranian Chem. Soc.62009113120
- A.RiyadA.AkheelNew and highly sensitive spectrophotometric method for the determination of paracetamol in performulation and dosage formsInt. J. Anal. Bioanal. Chem.22012209213