
 ?Mathematical formulae have been encoded as MathML and are displayed in this HTML version using MathJax in order to improve their display. Uncheck the box to turn MathJax off. This feature requires Javascript. Click on a formula to zoom.
Abstract
Artemether–lumefantrine is the most widely used artemisinin-based combination therapy for malaria. The present work aims to develop and validate a simple, accurate, precise and rapid ratio first order derivative spectrophotometric method for the simultaneous estimation of artemether and lumefantrine in a fixed dose combination tablet. The first step in development of the method was to derivatize artemether. As artemether does not show absorption in the UV region, it was derivatized using hydrochloric acid as the derivatizing agent. The derivatizing conditions were further optimized by full factorial multivariate approach, where the independent variables were volume of concentrated hydrochloric acid and time taken for artemether derivatization at room temperature. Furthermore, based on the statistical analysis, derivatizing conditions were optimized i.e. 1.3 ml of conc. HCl at room temperature for 30 min. At this condition, the artemether was found to absorb in the UV region satisfactorily, and the absorbance of lumefantrine was found to remain unaffected. The developed method showed good calibration data in the range of 5–30 μg/ml for artemether and 2–12 μg/ml for lumefantrine. The mean % recovery values were found to be 99.96–100.49% and 99.48–100.31% for artemether and lumefantrine, respectively. Additionally, the developed method was effectively applied in the estimation of artemether and lumefantrine in a commercial tablet (ARH-L DS tablets), suggesting that it can be practically applied for quality control of routinely examined drugs in combined dosage forms with the reduced expenditure of time.
1 Introduction
Malaria is a leading global cause of morbidity and mortality. According to the latest estimates, released in December 2014 by WHO, there were approximately 198 million cases of malaria in 2013 and an estimated 584,000 deaths. The children living in Africa are on the verge of great danger, where a child dies every minute from malaria. Currently, the main pillars for the treatment of malaria and for slowing the spread of resistance are such drugs as chloroquine and sulfadoxine–pyrimethamine, a non-alkaloidal artemisinin-type antimalarial drug (artemisinin and its derivatives), as well as combinations of other drugs. Additionally, WHO recommends use of artemisinin-based combination treatments (ACT) as first line therapy in treatment of acute uncomplicated Plasmodium falciparum malaria [Citation1–Citation3].
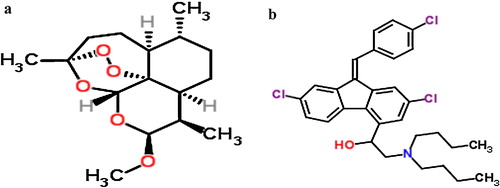
The combination of artemether and lumefantrine tablets is a fixed-dose combination ACT therapy added to the WHO Essential Medicines list in 2002. Artemether (ARM) (decahydro-10- methoxy-3, 6, 9-trimethyl-3, 12-epoxy-12H-pyrano [4.3-j]-1, 2- benzodioxepin) (a) is more active than the parent compound artemisinin. Artemether is practically insoluble in water, very soluble in dichloromethane and acetone, and freely soluble in ethyl acetate and dehydrated ethanol, and it shows higher stability when dissolved in oils. Lumefantrine (LUM) is a racemic fluorene derivative with the chemical name (1RS)-2-(dibutylamino)-1-{(9Z)-2, 7-dichloro-9-[(4-chlorophenyl)methylene]-9H-fluorene-4-yl}ethanol (b) [Citation4,Citation5].
Fig. 1 Chemical structure of (a) Artemether; (b) Lumefantrine.
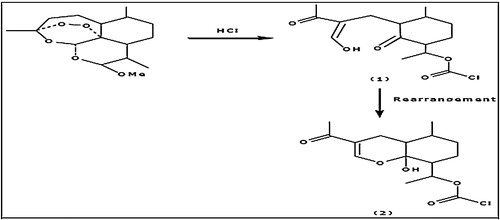
The quantification of ARM and LUM in commercial pharmaceutical products is principally important for both quality control and consumer safety. ARM does not show any significant absorption in the effective wavelength region of the UV–visible spectroscopy and also lacks specific chemical groups which can easily react with certain reagents to yield coloured products. The reviewed literature indicates that adding a chromophoric group to artemether can be performed by acid or base treatment converting it into more reactive compounds, such as enolate/carboxylates or α,β-unsaturated decalones, and can cause absorption of UV radiation. This transformation had been used as the basis for the determination of this drug in dosage forms using spectrophotometry. The reaction between artemether and hydrochloric acid is shown in and involves rearrangement of groups and the addition of a free carboxylate group [Citation6–Citation13].
Fig. 2 Chemical rearrangement reaction between artemether and hydrochloric acid [Citation20].
ARM is an official drug used in Indian Pharmacopoeia, British Pharmacopoeia and United State Pharmacopoeia [Citation14–Citation18], whereas LUM is official in USP SALMOUS [Citation18]. Several methods including UV and HPLC, used for the estimation of ARM [Citation19–Citation27] while UV, HPLC, HPTLC and tandem techniques used for the estimation of LUM [Citation28–Citation32] have been described in previous literature. However, existing methods involving the simultaneous estimation of ARM and LUM in pharmaceutical dosage form focuses on chromatographic techniques, i.e., HPLC and HPTLC [Citation33–Citation40]. Regarding the simple and economical UV method, only one method that is derivative of spectrophotometric analysis has been reported, in which artemether is derivatized using hydrochloric acid at 60 ± 2 °C, but the reaction time reported is 3 h, making it time-consuming [Citation13].
Hence, in the present study, an attempt was made to establish derivatizing conditions for artemether while reducing time investment and without affecting the absorption property of lumefantrine in order to make it a suitable candidate for concurrent estimation by ratio first order derivative spectrophotometric method. In the present study, an experimental approach was designed for optimizing the derivatizing conditions and minimizing the number of trials. Experimental design is the multidimensional combination and interaction of input variables (e.g., material attributes) and process parameters that have been demonstrated to provide assurance of quality [Citation41–Citation43]. It is more efficient in multifactor optimization because one factor at a time approach (OFAT) can easily miss the optima, while the design of experiment approach (DOE) is a powerful instrument to generate, apply and interpret scientific experiments in an effective way. It offers the maximum information about how the factors influence the response evaluated while requiring minimum investment of time, making it possible to rank each independent variable according to its significance based on studied responses [Citation44–Citation50].
The aim of the present work was to employ an experimental design approach for optimizing the derivatizing conditions for artemether in the presence of lumefantrine using concentrated hydrochloric acid as the derivatizing reagent and to develop a validated, simple, rapid, sensitive and reliable analytical method for the simultaneous determination of ARM and LUM in combined pharmaceutical dosage form.
2 Materials and methods
2.1 Materials
Analytically pure drug samples of ARM and LUM were obtained from Baroque Pharmaceuticals, Khambhat, India as a gift sample. Marketed tablet formulation used for the analysis was ARH-L DS tablet (Artemether 80 mg and Lumefantrine 480 mg) manufactured by Lincoln Pharmaceuticals Ltd., Ahmedabad, India procured from the local market. All solvents and chemicals were of analytical grade and used without further purification.
2.2 Instruments and software
ARM and LUM quantification was performed using double beam UV–visible spectrophotometer (Shimadzu Corporation, model UV 1800) having two matched quartz cells with 1 cm optical pathlength in the wavelength range from 200 to 800 nm. Other equipment used included ultrasonic bath (Amkette Industries Pvt. Ltd., India) and electronic analytical balance (AUW 220, Shimadzu Corp. Japan). UV Probe Software version 2.35 (Shimadzu 1800, Japan) was used for method development and validation of spectrophotometric method. Data investigation of experimental design was performed by the Design-Expert trial version 9.0.0.1 (Stat-Ease Inc., Minneapolis, USA) statistical software. The rest of the calculations were performed with the help of Microsoft Excel 2010 software (Microsoft Corporation, USA).
2.3 Preparation of solutions for optimization of reaction conditions
An accurately weighed 50 mg of standard ARM and LUM were transferred to two separate 50 ml volumetric flasks, dissolved in 25 ml of methanol, and the volume was increased to the mark with methanol for obtaining 1000 μg/ml stock solution. Furthermore, 25 ml of stock solution was diluted to 50 ml with methanol to obtain 500 μg/ml working standard solution and was used for optimization of volume of concentrated hydrochloric acid (conc. HCl) and reaction time for derivatization of ARM.
2.4 Optimization of reaction conditions using 32 full factorial design
As ARM does not contain a chromophoric group, it was derivatized such that the structure of artemether rearranges and transforms into a UV–visible absorbing compound. Based on a review of the literature, hydrochloric acid was used as a derivatizing agent for ARM [Citation30]. Preliminary study was carried out using 0.1 M, 0.5 M, 1 M, and 2 M methanolic HCl at room temperature and at elevated temperature. In the present study, it was observed that artemether was not reacting with the methanolic HCl at room temperature. Hence, it was concluded that concentrated HCl is required to derivatize ARM at room temperature. The studies were further carried out using a multivariate experimental design approach. A three-level full-factorial design encompassing every possible combination of factors at the designated levels having five centre points was used to study two independent variables, i.e., volume of conc. HCl and reaction time affecting the derivatization of the ARM. The selection of critical factors and ranges examined for optimization of derivatization conditions was based on preliminary univariate studies.
The design domain was constructed as having nine experimental runs with five centre points with two independent variables, volume of conc. HCl (A) and reaction time (B), and absorbance of ARM was recorded as a response, as depicted in . Centre points were repeated five times to estimate the experimental error. The investigated range of volume of conc. HCl was maintained between 1.0 and 1.6 ml while reaction time between 10 and 50 min. The significance of the relevant factors was calculated using Fisher’s statistical test for analysis of variance (ANOVA) model, which was estimated. All experiments were conducted in a randomized order to minimize the bias effects of uncontrolled variables.
Table 1 Observed responses in 32 full factorial design with 14 analytical trials.
2.5 Ratio first derivative spectrophotometric method
Stock solutions of 1000 μg/ml of ARM and LUM were prepared by dissolving an accurately weighed quantity of 100 mg of stated drugs separately into 100 ml volumetric flasks; each drug was dissolved and diluted up to the mark with methanol. Further dilutions were performed after the addition of the optimized volume of conc. HCl, and both drugs were allowed to react with conc. HCl for the optimized reaction time. Subsequently, a working standard solution of 100 μg/ml of ARM and LUM was prepared with appropriate dilution with methanol.
At increasing concentrations of ARM in methanolic HCl, the ratio spectra were computed. Here, the ratio first order derivative spectra were traced by transforming zero order spectra by taking Δλ = 8 nm and then dividing each absorbance reading by the stored zero order spectrum of 15 μg/ml of LUM. Similarly, the ratio first order derivative spectra of LUM was recorded by dividing each concentration of LUM by zero order spectrum of 6 μg/ml of ARM using Δλ = 8 nm. The wavelength maxima observed for ARM and LUM was found to be 246.04 nm and 237.47 nm, respectively [Citation51,Citation52].
2.6 Method validation
The method was validated with respect to linearity, accuracy, precision and specificity in accordance with ICH Q2 (R1) guidelines [Citation53].
2.6.1 Linearity
The linear relationship between concentration and absorbance of both drugs was evaluated over the concentration range of 5–30 μg/ml and 4–12 μg/ml for ARM and LUM, respectively. The linearity ranges for ARM and LUM were replicated five times. The homoscedasticity of the variances along the regression line of both drugs was verified using Bartlett’s test [Citation53,Citation54].
2.6.2 Sensitivity
The sensitivity of method was measured in terms of limit of detection (LOD) and limit of quantification (LOD). LOD and LOQ of the developed method were calculated from the standard deviation of the response (σ) and slope of the calibration curve (S) of each drug using the formula, limit of detection = 3.3*σ/S; Limit of quantitation = 10*σ/S.
2.6.3 Precision
The precision of the developed method was evaluated by performing intra-day and inter-day precision studies. Intra-day precision was carried out by performing three replicates (at morning, afternoon and evening) at three different concentrations (10, 20 and 30 μg/ml for ARM; 4, 8, 12 μg/ml for LUM) on the same day, and percent relative standard deviation (%RSD) was calculated. Inter-day precision study was assessed by mentioned concentrations of ARM and LUM on three different days in triplicate, and % RSD was calculated.
2.6.4 Accuracy
To ascertain the accuracy of the proposed method, recovery studies were carried out using a standard addition method by adding a known amount of standard (5, 10 and 15 μg/ml for ARM and 2, 4 and 6 μg/ml) to the marketed tablet (10 μg/ml ARM and 4 μg/ml LUM) at 50, 100 and 150% level. The mean % recovery was calculated. Additionally, accuracy was expressed as the bias, i.e. the difference between the results obtained and the reference value. Recovery studies were performed in triplicate [Citation53,Citation55].
2.7 Analysis of marketed formulation
Twenty ARH-L DS tablets (Artemether-80 mg and Lumefantrine 480 mg) manufactured by Lincoln Pharmaceuticals Ltd., Ahmedabad were accurately weighed and finely powdered. A quantity equivalent to 25 mg of ARM and 150 mg of LUM was transferred to a 25 ml volumetric flask and mixed with 15 ml of methanol. The solution was sonicated for 30 min, and the volume was later made up with the same solvent. The solution was filtered through Whatman filter paper No. 42. Then, 1 ml filtrate was taken and transferred to another 10 ml volumetric flask and further derivatized using optimized derivatizing conditions, i.e., optimized volume of conc. HCl (1.3 ml) and reaction time (30 min). Then, volume was increased to the mark with methanol. For analysis of both of the above drugs, solution was appropriately diluted to obtain a concentration of 10 μg/ml for ARM and 6 μg/ml for LUM. Sample solutions were prepared in triplicate and analyzed according to the procedure mentioned in Section 2.5.
3 Results and discussion
The first order ratio derivative spectrophotometric method was developed and validated for the simultaneous estimation of ARM and LUM after derivatization of ARM with hydrochloric acid using an experimental design.
3.1 Optimization of derivatization conditions
3.1.1 Preliminary studies
ARM quantification is difficult because ARM lacks a chromophoric group. Based on the existing literature, the derivatization of ARM was accomplished using hydrochloric acid which yields decomposition product α-β unsaturated decalones, which absorbs strongly at 254 nm [Citation18]. The reviewed literature shows that ARM was detected using 0.1 M methanolic HCl as a derivatizing agent, but it required 3 h of heating at 60 ± 2 °C, which again was a time-consuming process. Thus, in order to derivatize ARM at room temperature, ARM was derivatized using methanolic hydrochloric acid, but it was observed that ARM was not detected in UV at room temperature. Additionally, as molar concentration of methanolic hydrochloric acid increased from 0.1 M to 2 M, UV absorbance was obtained, indicating the possibility that ARM was not derivatized.
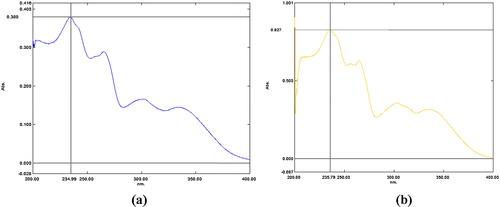
These trials of UV spectroscopy revealed that derivatizing ARM methanolic HCl at room temperature using the aforementioned molar concentrations was found to be unsuccessful, but the present study revealed that the addition of conc. HCl for derivatization of ARM at room temperature significantly increased the UV absorbance of ARM. LUM, which has a chromophoric group, may be analyzed spectrophotometrically. In the simultaneous estimation of ARM and LUM in the proposed method, conc. HCl is used as a derivatizing agent. In this experiment, a UV spectrum of LUM was not affected by conc. HCl, as shown in .
Fig. 3 (a) UV spectra of LUM in absence of conc. HCl and (b) UV spectra of LUM in presence of conc. HCl.
Thus, there was a need to optimize the volume of conc. HCl and reaction time of conc. HCl with ARM to produce the acid decomposition product of ARM (α,β unsaturated decalone) at room temperature, which absorbs strongly at 254 nm using 32 full factorial design.
3.1.2 Optimization of reaction conditions using 32 full factorial design
Optimization using a factorial design is a highly efficient and systematic tool that shortens the time required for the development of method and improves research and development work. Factorial designs are one of the major tools used for optimization in which all the studied factors in all their possible combinations are considered in order to determine the most efficient factors in estimating the influence of individual variables and their interactions using minimal experiments [Citation46–Citation50]. The application of factorial design for optimization of reaction condition has played a key role in understanding the relationship between the independent variables and the responses. The independent variables can be controlled, whereas responses are totally dependent.
In this study, the selection of factors examined for optimization was based on preliminary experiments and prior knowledge from the literature. A 32 full factorial design was performed using 14 experimental runs, including five centre points. The factors selected for the optimization process, such as volume of conc. HCl (A) and reaction time (B), and absorbance of ARM in all 14 design experimental runs are summarized in . Experimental results were computed by Design Expert Trial version 9.0.0.1 software. During model selection, it was observed that the best-fitted model for absorbance of ARM was a quadratic model based on lowest PRESS value and adjusted R2 value nearer to 1.
The model was validated by analysis of variance (ANOVA) and the results are presented in . A value of adequate precision (signal to noise ratio) greater than 4 is desirable; a value of coefficient of variation (% CV) (reproducibility of the model) less than 10% is desirable [Citation56–Citation58]. Fisher F-ratio was used to measure the significance of the model under investigation with respect to the variance of all the terms included in the error term at a P-value equal to 0.05 (). The P-value of the model (P-value < 0.05) was in desirable limits. In this instance, the adjusted R2 values were well within the acceptable limits of R2 ≥ 0.80, indicating that the experimental data were a good fit to the polynomial equation (). The final equation, in terms of actual components and factors, is shown in . In this table, a positive sign indicates a synergistic effect, while a negative sign indicates an antagonistic effect between factors and the response.
Table 2 Predicted response models and statistical parameters obtained from ANOVA for FFD.
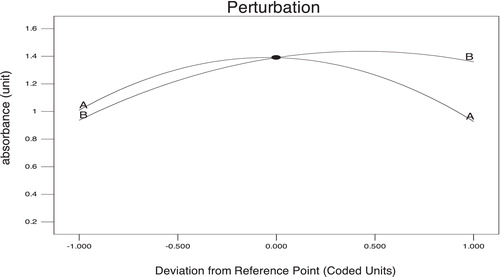
Additionally, the predicted model is presented in the form of a perturbation plot for a better understanding of the results (). This graph provides some idea about how the absorbance changes as the volume of conc. HCl and reaction time changed. Absorbance increases as the volume of conc. HCl increases, but after a certain level absorbance decreases, even though volume is increased. However, in relation to reaction time, absorbance initially increases as the time increases but after a certain point absorbance value stays constant. From the perturbation plot, it is evident that factor B (reaction time) had a more significant effect on absorbance value compared to factor A (volume of conc. HCl).
Fig. 4 Perturbation plot showing the effect of both factor on absorbance of ARM.
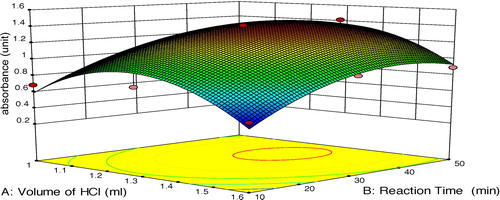
shows a 3D response surface plot for the variation of response as a function of A and B. It depicts that absorbance increased as the volume of conc. HCl increased, but only up to a certain volume of conc. HCl. Afterward, absorbance decreased. Furthermore, in the case of factor B (reaction time), initially absorbance increased, but after 30 min, absorbance was constant.
Fig. 5 Response surface methodology plot for study of the effect of volume of conc. HCl and reaction time on absorbance.
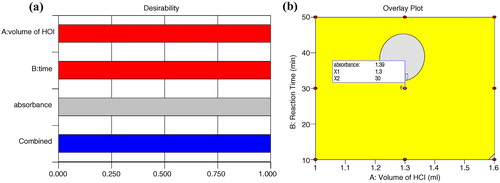
To identify the optimum derivatizing conditions, numerical optimization in Design Expert software was attempted by setting various constraints for factors and responses. According to the criterion set, 10 different solutions having the desired value of the response were provided by the software. Among these solutions, two conditions were selected that had desirability near to 1 or 1. The response surface obtained for the maximum Derringer’s desirability function is presented in a.
Fig. 6 (a) Derringer’s desirability plot; (b) Overlay plot for optimum region.
In order to examine the validity of the proposed model, the agreement between experimental and predicted responses for both predicted optimums (i.e., optimums 1 and 2), as shown in , was checked, while the optimum values of the variables were obtained from the Design-Expert software. The percentage of prediction error was then calculated using the formula shown below:
Table 3 Comparison of experimental and predictive values of different experimental runs under optimum conditions.
The observed value of optimum condition 1 was relatively closer to the predicted value, resulting in less % predicted error and high desirability as shown in b, where the graphical optimization displays the area of feasible response values in the factor space. Thus, the optimized derivatizing conditions for ARM was achieved with 1.3 ml volume of conc. HCl and 30 min of reaction time at room temperature. This resulted in an optimum absorbance of ARM in UV spectrometry without affecting the LUM estimation during method development.
3.2 Ratio first derivative spectrophotometric method
The standard solutions of ARM and LUM were prepared using the above specified optimized conditions. The maximum wavelength of absorption was found to be 234 nm and 254 nm for ARM and LUM, respectively, in zero order overlay spectra after derivatization, as shown in a. For method development, the zero order spectrums of 6 μg/ml of ARM and 15 μg/ml of LUM were considered as appropriate for the determination of LUM and ARM, respectively, as divisor. The Δλ found as optimum for the first derivative of their ratio spectra was 8 nm.
Fig. 7 (a) Zero order overlay spectra of ARM and LUM; (b) Ratio absorbance spectra of ARM (5–30 μg/ml), LUM 15 μg/ml as a divisor; (c) Ratio first derivative spectra of ARM (5–30 μg/ml), Wavelength: 246.04 nm, scaling factor: 40; (d) ratio absorbance spectra of LUM (2–12 μg/ml), ARM 6 μg/ml as a divisor; (e) Ratio first derivative spectra of LUM (2–12 μg/ml), Wavelength: 237.47 nm, scaling factor: 40.
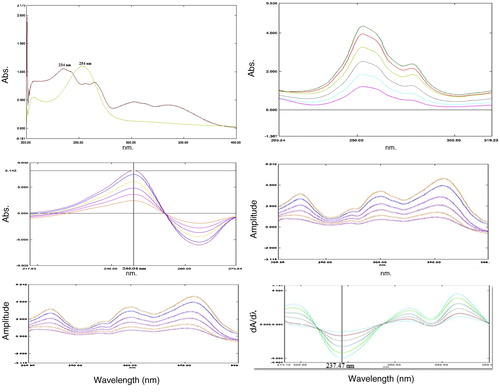
The ratio spectra of different ARM standards ranging from 5 to 30 μg/ml in methanolic HCl were obtained by dividing each with the zero order spectrum of 15 μg/ml standard solution of LUM, and the first derivative of these spectra were traced keeping the value of Δλ at 8 nm as shown in b and 7c, respectively. Similarly, the ratio derivative spectra for the solutions of LUM of different concentration from 2 to 12 μg/ml in methanolic HCl were traced using zero order spectrum of 6 μg/ml standard solution of ARM as a divisor, as shown in d and e. From c and e, wavelength maxima of 246.04 and 237.47 nm were selected for the determination of ARM and LUM, respectively [Citation51,Citation52].
3.3 Method validation
3.3.1 Linearity
The calibration range for ARM and LUM was established through consideration of the practical range necessary according to Beer–Lambert’s law. ARM and LUM showed a good determination coefficient (R2) between amplitude of ratio spectra and concentration in range of 5–30 μg/ml for ARM and 2–12 μg/ml for LUM, as shown in . Homoscedasticity of variance was confirmed by Bartlett’s test and the response of amplitude for both drugs showed homogenous variance that was exemplified by a χ2 value less than the tabulated value () [Citation53,Citation54].
Table 4 Analytical parameters of ratio first derivative spectrophotometric method.
3.3.2 Sensitivity
LOD and LOQ were determined based on the standard deviation of response (intercept) and slope of the calibration curve according to ICH guideline. LOD and LOQ of the developed method were found to be 0.349 and 1.057 μg/m, respectively, for ARM and 0.046 and 0.139 μg/ml, respectively, for LUM, indicating the sensitivity of the proposed method () [Citation53].
3.3.3 Precision
The experiment was repeated three times within a day (intra-day precision) and the average %RSD values of the results were calculated. Similarly, the experiment was repeated on three different days (inter-day precision) and the average % RSD values for amplitude of ARM and LUM were calculated. The developed method is found to be precise as the % RSD values for intra-day and inter-day precision were less than 2% as shown in [Citation53].
3.3.4 Accuracy
The accuracy of the method was assured by applying the standard addition technique where good mean recoveries were found between 99.96 to 100.49% for ARM while 99.48 to 100.31% for LUM (). % RSD values of both drugs were found to be less than 2% confirming the accuracy of the proposed method. Percentage bias for ARM at 50%, 100% and 150% was found to be 0.49, −0.040 and 0.12, respectively, while for LUM at 50%, 100% and 150%, it was found to be 0.312, −0.519 and −0.180, respectively. The accuracy results obtained for ARM and LUM were within the acceptability criteria for bias, ±5%, indicating the accuracy of the method [Citation55].
3.4 Method application in dosage form analysis
The analysis of the marketed tablet exhibited good recovery of 99.87 ± 1.07% and 99.63 ± 0.73% for ARM and LUM, respectively with % RSD value less than 2 indicating that the method can be applicable in the routine quality control testing of bulk drugs and for marketed formulations in combined dosage form.
4 Conclusions
The proposed method for the simultaneous estimation of artemether and lumefantrine by ratio first order derivative spectrophotometric method was observed to be rapid, simple, sensitive, novel, easy and accurate. The proposed method requires simple measurements and also facilitates higher values of analytical signals, eliminating the need of working on zero crossover point. Artemether strongly lacks absorbing chromophore, so its derivatization with conc. HCl as the derivatizing agent for the determination by UV spectrophotometer was found to be very advantageous for routine analysis. Optimization of the reaction conditions for derivatization were carried out by 32 full factorial design, which proved suitable for understanding the relationship between the independent and dependent variables at every possible combination at the designated levels. Lumefantrine, which has a chromophoric group, was analyzed spectrophotometrically in the presence of conc. HCl under optimized conditions for artemether. Hence, the proposed method for the simultaneous estimation of artemether and lumefantrine is a useful alternative to chromatographic techniques in routine analysis of the drugs, decreasing both instrument cost and time consumption.
Acknowledgement
We would like to express our gratitude to Baroque Pharmaceuticals, Khambhat, India for providing gift samples of standard artemether and lumefantrine.
Notes
Peer review under responsibility of Taibah University.
References
- WHO Factsheet on the World Malaria Report2014http://www.who.int/malaria/media/world_malaria_report_2014/en/
- World Malaria Report2014WHO Library
- The World Wide Antimalarial Network2014Journal.Pmed
- H.P.RangM.M.DaleJ.M.RitterR.J.FlowerRang and Dale’s Pharmacology6th ed.2007ElsevierChurchill Livingstone536
- Martindale: The Complete Drug Reference, London36th ed.2009 pp. 598–599, 605
- O.A.AdegokeA.O.OsoyeDerivatization of artesunate and dihydroartemisinin for colorimetric analysis using p-dimethylaminobenzaldehydeEurasian J. Anal. Chem.62011104
- C.P.BabalolaI.OluwalanaO.A.KotilaO.A.AdegokeY.T.KoladeS.J.AmehA novel derivatization ultraviolet spectrophotometric method for the determination of dihydroartemisinin using p-nitroanilineTrop. J. Pharm. Res.1312014127133
- C.DebnathE.HaslingerW.LikussarA.MichelitschDetermination of the antimalaria drug artemether in pharmaceutical preparations by differential pulse polarographyJ. Pharm. Biomed. Anal.412006638643
- J.L.FelhoferK.ScidaM.PenickP.A.WillisC.D.GarciaSimultaneous solid phase extraction and derivatization of aliphatic primary amines prior to separation and UV-absorbance detectionTalanta1152013688693
- J.N.PawarR.T.SheteA.B.GangurdeDevelopment of amorphous dispersions of artemether with hydrophilic polymers via spray drying: physicochemical and in silico studiesAsian J. Pharm. Sci.112016385395
- C.AgboC.UmeyorF.KenechukwuJ.OgbonnaS.ChimeC.LovelynO.AgubataK.OfokansiA.AttamaFormulation design, in vitro characterizations and anti-malarial investigations of artemether and lumefantrine-entrapped solid lipid microparticlesDrug Dev. Ind. Pharm.2016114
- The International Pharmacopoeia2015 Available at http://apps.who.int/phint/en/p/docf/
- A.ShrivastavaP.SainiR.IssaraniNew simple and economical spectrophotometric method for estimation of artemether in pharmaceutical dosage formsAsian J. Res. Chem.120081921
- Government of India, Ministry of Health and Family Welfare6th ed.Indian Pharmacopoeia, Monograph of Artemethervol. II2010 p. 836
- British Pharmacopoeia, Version 11.0, Appendices: XII A, XII G, XVII G2007
- United States Pharmacopoeia and National Formulary (USP 31-NF26)2008US PharmacopoeiaRockville, MD683687
- Monographs for Antimalarial Drug. International Pharmacopoeia, pp. 187–196. Available from: http://whqlibdoc.who.int/publications/2003/9241545364_ part 4.pdf (assessed 19.07.07).
- USP’s SALMOUS Standards Guideline. Lumefantrine and Artemether Tablets2009The United States Pharmacopeial ConventionTwinbrook Parkway, Rockville
- Monographs for Antimalarial Drugsvol. 52006International Pharmacopoeia185
- P.Y.PawarM.P.ChavanG.K.GhanwatM.A.RaskarH.P.BhosaleValidated spectrophotometric method for quantitative determination of Artemether in pharmaceutical formulationDer Pharma Chem.332011135139
- D.S.CesarG.A.PianettiQuantitation of artemether in pharmaceutical raw material and injections by high performance liquid chromatographyBraz. J. Pharm. Sci.452009737742
- K.VandercruyssenM.D.HondtV.VergoteH.JansenC.BurvenichB.D.SpiegeleerUV/MS quality analytics of paediatric artemether formulationsJ. Pharm. Anal.2013116
- L.WiesnerK.GovenderS.A.MeredithJ.NormanP.J.SmithA liquid–liquid LC/MS/MS assay for the determination of artemether and DHA in malaria patient sampleJ. Pharm. Biomed. Anal.552011373378
- C.SouppartN.GauducheauN.SandrenanF.RichardDevelopment and validation of a high-performance liquid chromatography–mass spectrometry assay for the determination of artemether and its metabolite dihydroartemisinin in human plasmaJ. Chromatogr. B7742002195203
- L.HuangA.L.JayewardeneF.MarzanP.S.LizakF.T.AweekaDevelopment and validation of a high-performance liquid chromatography/tandem mass spectrometry method for the determination of artemether and its active metabolite dihydroartemisinin in human plasmaJ. Pharm. Biomed. Anal.502009959965
- A.ShrivastavaR.IssaraniStability indicating high-performance liquid chromatography method for the estimation of artemether in capsule dosage formsJ. Young Pharm.220107984
- N.G.TayadeM.S.NagarsenkerValidated HPTLC method of analysis for artemether and its formulationsJ. Pharm. Biomed. Anal.432007839844
- S.SharmaM.C.SharmaSimultaneous UV spectrophotometric method for the estimation of lumefantrine in pharmaceutical dosage formsWorld J. Chem.620117579
- R.ArunA.S.AntonDevelopment of analytical method for lumefantrine by UV spectrophotometryInt. J. Res. Pharm. Sci.12010321324
- R.PrasannaD.SaravananJ.PadmavathyMethod development and validation for the determination of lumefantrine in sold dosage form by RP-HPLCInt. J. Pharm. Res. Dev.820108490
- I.F.KhalilU.AbildrupL.H.AlifrangisD.MaigaM.AlifrangisL.HoegbergI.C.BygbjergMeasurement of lumefantrine and its metabolite in plasma by high performance liquid chromatography with ultraviolet detectionJ. Pharm. Biomed. Anal.12011168172
- N.S.KoturS.SivasamyS.SrinivasanAnalytical method development and validation for estimation of lumefantrine in pharmaceutical dosage forms by HPLCJ. Pharm. Sci. Res.42012162167
- R.ArunA.A.SmithSimultaneous HPLC-UV method for the estimation of artemether and lumefantrine in tablet dosage formJ. Pharm. Biomed. Anal.482011951954
- J.SunilM.S.NathM.U.SambaHPLC method development and validation for simultaneous estimation of artemether and lumefantrine in pharmaceutical dosage formsInt. J. Pharm. Sci.4201047
- C.CostaF.HenriqueA.NogueiraSimultaneous determination of artemether and lumefantrine in fixed dose combination tablets by HPLC with UV detectionJ. Pharm. Biomed. Anal.482008951954
- B.SridharR.K.HanumanthaT.V.SrinivasM.V.SeshuK.MadhuriJ.V.SeshagiriA validated reverse phase HPLC method for the simultaneous estimation of artemether and lumefantrine in pharmaceutical dosage formsInt. J. Adv. Pharm. Sci.12010
- T.M.KalyankarR.B.KakdeReversed-phase liquid chromatographic method for simultaneous determination of artemether and lumefantrine in pharmaceutical preparationInt. J. ChemTech. Res.3201117221727
- D.ParasharA.KumarR.M.RayasaSimultaneous estimation of artemether and lumefantrine in pharmaceutical dosage forms using derivative spectrophotometryAsian J. Res. Chem.62013226
- T.M.KalyankarM.S.AttarS.D.DeosarkarDevelopment UV–visible spectrophotometric method for simultaneous estimation of artemether and lumefantrineAnal. Chem. Ind. J.12201383
- P.K.SajniR.M.SinghS.C.MathurG.N.SinghC.L.JainR.K.KharA.A.HafeezA simple and sensitive HPTLC method for quantitative analysis of artemether and lumefantrine in tabletsJ. Planar Chromatogr.232010119122
- G.A.LewisD.M.RogerP.LuuPharmaceutical Experimental Design1999Marcel Dekker, Inc.New York2
- A.SetiaS.KansalN.GoyaliDevelopment and optimization of enteric coated mucoadhesive microspheres of duloxetine hydrochloride using 32 full factorial designInt. J. Pharm. Investig.32013141150
- J.AntonyFull Factorial Designs, Design of Experiments for Engineers and Scientists2014Elsevier Ltd
- N.BarkaM.AbdennouriA.BoussaoudA.GaladiM.BaalalaM.BensitelA.Sahibed-DineK.NohairM.F.SadiqFull factorial experimental design applied to oxalic acid photocatalytic degradation in TiO2 aqueous suspensionArab. J. Chem.72014752757
- R.A.CazarOptimization of a UV–visible spectrophotometer response using a fractional factorial designAvances322011A1A4
- L.KumarR.M.SreenivasaR.S.ManaguliK.G.PaiFull factorial design for optimization, development and validation of HPLC method to determine valsartan in nanoparticlesSaudi Pharm. J.232015549555
- J.M.LeitaoD.E.SilvaFactorial analysis optimization of a Diltiazem kinetic spectrophotometric quantification methodAnal. Chim. Acta6092008112
- H.PatelH.PatelM.GohelS.TiwariDissolution rate improvement of telmisartan through modified MCC pellets using 32 full factorial designSaudi Pharm J.2015
- F.S.RojasC.B.OjedaA.JesusR.SanchezM.E.BoschUse of experimental design for calibration and validation of ascorbic acid and citric acid mixturesJ. Mex. Chem. Soc.522008229234
- U.TezcanF.AtesN.ErginelO.OzcanE.OduncuAdsorption of disperse orange 30 dye onto activated carbon derived from Holm Oak (Quercus Ilex) acorns: A 3k factorial design and analysisJ. Environ. Manag.15520158996
- D.R.VananiS.D.DesaiK.G.PatelP.A.ShahApplication of ratio derivative spectrophotometry for simultaneous Determination of Mometasone furoate and salicylic acid in semisolid dosage formInt. J. Anal. Bioanal. Chem.320136771
- A.R.RotelP.D.BarilRatio spectra derivative and zero-crossing difference spectrophotometric determination of olmesartan medoxomil and hydrochlorothiazide in combined pharmaceutical dosage formAAPS PharmSciTech102009
- Validation of analytical procedures: text and methodologyInternational Conference on Harmonization, ICH Q2 (R1) ICH Secretariat, Geneva2005
- J.H.ZarBiostatical Analysis5th ed.2010Pearson Education Inc.New Jersey
- T.SivakumarR.ManavalanK.ValliappanDevelopment and validation of a reversed-phase HPLC method for simultaneous determination of domperidone and pantoprazole in pharmaceutical dosage formsActa Chromatogr.182007130142
- T.B.SolankiP.A.ShahK.G.PatelCentral composite design for validation of HPTLC method for simultaneous estimation of olmesartan medoxomil, amlodipine besylate and hydrochlorothiazide in tabletsIndian J. Pharm. Sci.762014179187
- G.MustafaA.AhujaS.BabootaJ.AliBox-Behnken supported validation of stability-indicating high performance thin-layer chromatography (HPTLC) method: an application in degradation kinetic profiling of ropiniroleSaudi Pharm. J.21201393102
- V.Sree JanardhananR.ManavalanK.ValliappanChemometric technique for the optimization of chromatographic system: simultaneous HPLC determination of rosuvastatin, telmisartan, ezetimibe and atorvastatin used in combined cardiovascular therapyArab. J. Chem.2012110