
 ?Mathematical formulae have been encoded as MathML and are displayed in this HTML version using MathJax in order to improve their display. Uncheck the box to turn MathJax off. This feature requires Javascript. Click on a formula to zoom.
Abstract
An Anton Par Model 55 densimeter was used to measure the densities of copper sulphate solutions in H2O and EtOH–H2O at 298.15 K, 303.15 K, 308.15 K, and 313.15 K. The acquired information was used to ascertain the apparent molar volumes, limiting partial molar volumes, and transfer partial molar volumes of copper sulphate. These computed parameters were utilized to decipher the solute–solute and solute–solvent interactions of copper sulphate in an aqueous ethanol solution. The ion solvation behavior of copper sulphate in water and aqueous ethanol over the range of 298.15–313.15 K was studied using the electrical conductivity principle. The Kraus–Bray and Shedlovsky models of conductivity were used to analyze the obtained conductance data. From the obtained data, the limiting molar conductance λ°m, association constant KA, energy of activation of the rating process (Ea), and related thermodynamic parameters were determined. The Walden product (λ°mη0) was determined. The standard thermodynamic parameters of association (ΔG°A, ΔH°A) were calculated and discussed. Increased ion–solvent and solvent–solvent interactions are indicated by limiting molar conductance values with an increasing amount of ethanol. The negative ΔG°A values indicate that the association processes in all of the studied systems are spontaneous processes. The negative estimation of (ΔH°A) demonstrates that the association processes is exothermic in nature.
1 Introduction
Significant data provided from the physicochemical properties of salts in aqueous solutions explain (solute + solute) and (solute + solvent) interactions that are crucial for the dependability of these systems and are used in some biochemical and physiological procedures in a living cell. The existence of numerous interactions makes the determination of the physical and chemical properties of organic solvents + inorganic salts solutions (partially solvated melts) over a wide concentration range very difficult. Strong ion–ion interactions are dominant in concentrated solutions. The influence of ion–dipole interactions between solvent molecules and solute ions increases with dilution. In extremely dilute solutions, a predominant weak dipole–dipole interaction is present. In diluted solutions within the range of validity of the Debye–Hückel law, most of the properties of the systems, such as conductivity [Citation1], viscosity [Citation2] and volumetric properties [Citation3], have been calculated. Because of their commercial uses in many technological areas, the ion solvation process and equilibrium involved in many concentration sections in water as well as non-aqueous media have been of great importance. The existence of ions, solvated ions, and free solvent depends on the concentration area [Citation4]. Hence, the investigation of volumetric properties over a wide electrolyte concentration range in different solvents is essential. The present work investigates the volumetric properties of copper sulphate in aqueous ethanol to explain the nature of solute–solvent interactions in a diluted and concentrated copper sulphate solution. Copper sulphate (CuSO4) has been widely used for algal growth control and treatment of human copper deficiency. Ethanol, which is a colorless liquid at room temperature, is a polar solvent with a high relative permittivity of 24.4. This feature of ethanol allows the study of its volumetric properties in solutions with a high copper sulphate concentration. Ethanol is a commercial solvent that is primarily used in the pharmaceutical industry as well as in many organic syntheses. Because of the possibility of H-bond formation, ethanol solutions are often used as model systems to study the interaction of peptides and proteins [Citation5]. A wide range of dielectric constants (ɛ) and viscosities (η) and a high amount of hydrogen bonding at different temperatures are possible in aqueous ethanol solutions. Through determination of the conductivity, many interactions between water and ethanol can be studied by mixing them at various ratios over the mixing range. Suitable conductivity measurements offer a useful prediction of ion–solvent interactions, proton–anion and proton–solvent associations, and solvent structures.
2 Experimental
Copper sulphate with a mass fraction >99% was obtained from the Shanghai Chemical Co., China, and used without further purification. Ethanol of a purity better than 99%, which was purchased from Aldrich, was dried under reduced pressure at 323 K before use. Water was distilled twice before use; all of the investigated solutions were newly prepared. The weight of samples was determined by a Mettler AE 200 balance with a sensitivity of ±0.0002 g. Ultrasonic waves were used to degas the prepared solutions, which were used within 12 h of preparation. The solution densities were determined within ±0.00001 g cm−3 using an Anton Paar DMA 55 digital densimeter (Austria). Twice-distilled water and dried air were used to calibrate the used densimeter. The temperature was kept constant at ±0.05 K using a HAAKEC thermostatic bath (German). Conductance measurements of the prepared salt solutions were conducted using a Jenway Conductivity Bridge with a cell constant value 1 cm−1 and a deviation of ±0.12 μS cm−1. Potassium chloride solutions were used to accurately determine the cell constant of the used conductivity electrode. The conductivity bridge was connected to a MLW 3230 ultra-thermostat to maintain the temperature at the required temperature (±0.006 °C). Ethanol–water mixed solvents with alcohol mass fractions of 0%, 20%, and 40% were prepared by applying the following equation:(1)
(1) where ρ1 and ρ2 are the densities of alcohol and water, respectively; V1 is the volume of alcohol that will be added to the volume V2 of water to obtain the mixture of the required percentage. The salts under examination, with concentrations of (5 × 10⁻², 4 × 10⁻², 3 × 10⁻², 2 × 10⁻², and 1 × 10⁻² mol dm−1), were prepared by taking a certain volume of the prepared standard solution of the salt and performing a serial dilution to the necessary volume for measurements before preparing the mixed solvents [Citation6]. The properties of the solvents are supplied in Table S1 (Supplementary Materials).
3 Results and discussion
3.1 Apparent molar volume
presents the densities (ρ) of copper sulphate solutions in water and in ethanol–water was at 298.15 K, 303.15 K, 308.15 K, and 313.15 K, where msolute is the CuSO4 molarity in the EtOH–H2O solutions. The apparent molar volumes (Vϕ) of copper sulphate were calculated from the equation:(2)
(2) where m is the molarity (mol dm−1) of the solute (copper sulphate), M is the relative molar mass of solute (kg mol−1), and ρ and ρ0 are the densities (g cm−3) of solution and solvent, respectively. The uncertainty of m was ±0.001 mol dm−1. The calculated values of Vϕ are also presented in . By using the calculated value of Vϕ, which is a function of the molality of the solute, interactions between the solute and solute can be predicted. show that the values of Vϕ increase with the elevated concentration of solute.
Table 1 Densities and apparent molar volumes of solutions of copper sulfate in aqueous ethanol at different temperatures.
3.2 Limiting apparent molar volume
The limiting apparent molar volumes (Vϕ°) were obtained by least-squares fitting to the Masson equation [Citation7]:(3)
(3) where Vϕ° is the intercept, which is free from solute–solute interactions by definition and therefore provides an indication of solute–solvent interactions, whereas the experimental slope, BV, provides information regarding solute–solute interactions. The evaluated values of Vϕ° and BV are listed in . The values of Vϕ° as reported in are positive for copper sulphate in water and in aqueous ethanol solutions, indicating the presence of strong solute–solvent interactions in these systems. This trend of Vϕ° values is due to their hydration behavior [Citation8,Citation9], which is composed of the following interactions in this system: (I) salt, Cu+2 and SO4−2 are hydrated in an electrostatic faction and (ii) the volume change results from the overlap of hydrated co-spheres of two groups and the adjacent groups. shows that the values of Vϕ° increase with the increase of temperature; this observation indicates that the solute–solvent interactions are favored at higher temperatures. Vϕ° increases with the addition of organic solvent, which can be attributed due to a low surface charge density. As a result, the electrostatic attraction is greater in a medium with a low relative permittivity. Therefore, the ion–solvent interaction would also be increased and, subsequently, will be larger.
Table 2 Limiting apparent molar volumes (Vϕ°) and experimental slopes (BV) of copper sulfate in water, and aqueous ethanol solutions at different temperatures.
3.3 Transfer volume
The transfer limiting apparent molar properties provide both qualitative and quantitative information regarding solute–solvent interactions without considering the impact of the solute–solute interactions. The standard partial molar volumes of transfer (ΔtrVϕ0) from water to aqueous ethanol solutions were calculated using Eq. Equation(4)(4)
(4) [Citation10,Citation11]:
(4)
(4)
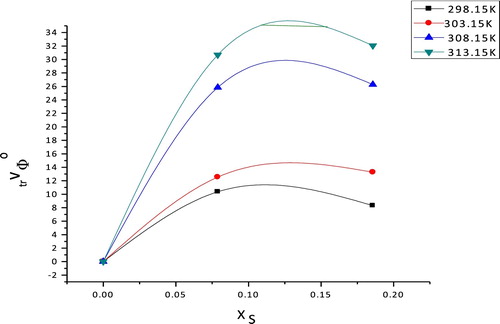
shows the variation of the ΔtrVϕ0 of copper sulphate with the mole fraction of ethanol. The ΔtrVϕ0 values of copper sulphate are positive and increase with increasing concentrations of ethanol. The difference in the ΔtrVϕ0 values in aqueous ethanol solutions is primarily due to the influence of the organic solvent, which reflects the change in the structure of the interaction between the solute and [Citation12,Citation13] solvent. The detected positive increase of the volumes of transfer for copper sulphate indicate that in the ternary system (copper sulphate + ethanol + water), the ionic–hydrophilic interactions are between the ethanol OH groups and CuSO4 ionic sphere, leading to a positive contribution ΔtrVϕ0, which is the predominate interaction.
Fig. 1 CuSO4 partial molar volumes of transfer from H2O to EtOH–H2O solutions at different temperatures.
3.4 Calculation of the different volumes
Based on the density of copper sulphate in water and aqueous ethanol, the molar volumes [Citation14] are calculated using Eq. Equation(5)(5)
(5) :
(5)
(5) where the molar mass of the used salt is denoted by M and the density of the solution is denoted by d. For large molecules (more than 40), the relation between the Van der Waals volumes and partial molar volumes (the packing density) is found to be constant. Therefore, it is possible to calculate the Van der Waals volumes (Vw) of copper sulphate in (EtOH–H2O) mixtures at different temperatures (298.15, 303.15, 308.15 and 313.15 K) by applying Eq. Equation(6)
(6)
(6) [Citation15,Citation16]:
(6)
(6)
The volume of electrostriction (Ve), which is the volume of the solute compressed by the effect of electric field of solvent, is calculated by using Eq. Equation(7)(7)
(7) :
(7)
(7)
The solvated radii [Citation17] of the organic–aqueous mixtures (EtOH–H2O) at different temperatures were calculated using Eq. Equation(8)(8)
(8) by allowing the spherical form of the solvated ions.
(8)
(8)
The values of V, Vw, Ve, and solvated radii of copper sulphate in (EtOH–H2O) mixtures at different temperatures are listed in . By comparing the data of solvation of the substance used, it is observed that the increase in values of the molar volume by increasing the organic solvent content in the mixtures is due to the increase in the volume of organic solvent [Citation18] compared to water. The electrostriction volumes are calculated for copper sulphate in (EtOH–H2O) mixtures that have negative values. The electrostriction volumes increase in negativity by increasing the percentages of the organic solvent, indicating that more work (energy) is done by the solvent on the solvation sheaths of the salts. The solvated radii are increased as the organic solvent content increases and as the temperature increases.
Table 3 Molar volume (V), Van der Waals volume (Vw), electrostriction volume (Ve) in (Cm3 mol−1) and solvated radii (ro) of copper sulfate in (EtOH–H2O) mixed solvents at different temperatures.
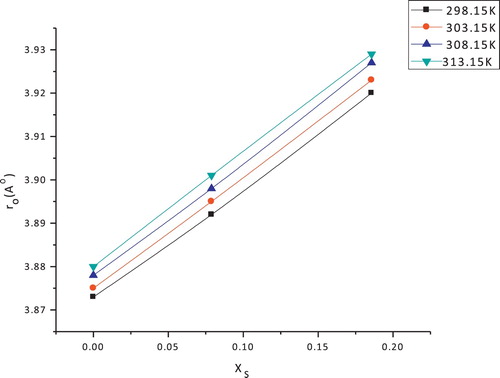
This observation may be due to the excess solvation processes and higher solvated radii of the organic solvent used compared to those of water and the increase in the electronic clouds around the solvated molecules as a result of the increase in their vibration and rotation motions with increasing temperature. The solvated radii of copper sulphate in water and in aqueous ethanol solutions at different temperatures are given in and are illustrated in .
Fig. 2 Copper sulfate solvated radii in H2O and EtOH–H2O at different temperatures.
3.5 Limiting molar conductance
The specific conductance values of solutions of copper sulphate over a concentration range of (0.001–0.01) mol L−1 in 0%, 20%, and 40% (EtOH–H2O) at 298, 303, 308 and 313 K were measured. The molar conductance for all of the studied systems was calculated using Eq. Equation(9)(9)
(9) .
(9)
(9) where C is the ordinary concentration and Ks is the measured specific conductance of the used solution, from which the specific conductance of the used solvent was deducted. The experimental molar conductivities were analyzed as per the Kraus–Bray conductivity equation [Citation19].
(10)
(10)
The limiting molar conductance, Λm°, and the dissociation constant, Kc were obtained from the intercept and slope of the plot 1/Λm vs ΛmC. However, this model does not include any correction for inter-ionic effects or for the activities of the ions. Therefore, the Shedlovsky [Citation20] relationship was used to evaluate the absolute limiting molar conductance and the association constant KA.(11)
(11)
The symbol γ denotes the activity coefficient of the electrolyte. Λm° and KA was obtained from the intercept and slopes of the plot of 1/SΛm vs. CΛmSγ2. The values of limiting molar conductance at the used temperatures are estimated using the conductivity models of Kraus–Bray and Shedlovsky; the values are presented in .
Table 4 Limiting molar conductance (Λ°m) for copper sulfate in aqueous ethanol from T = 298.15–313.15 K.
The limiting molar conductance (Λm°) was found to be higher in water and was subsequently reduced by adding ethanol. This behavior may be due to the formation of hydrogen bonds between ethanol and water molecules, resulting in the association of ethanol and water molecules, thereby leading to a decrease in the mobility of solvated ions and reducing the limiting molar conductance values by increasing the percentage of organic solvent in the solvent medium. The difference in viscosity (η) is not the only factor controlling the ionic mobility, which is shown by the Walden product. The limiting molar conductance of copper sulphate increased with increasing temperatures from 298.15 K to 313.15 K for all percentages of mixed solvents as a result of the increase in ionic mobility. Hydrogen bonding of water is broken by increases in thermal energy, leading to smaller solvated ionic size and increases of the mobility of ions.
3.6 Association constant
The calculated values of the association constant are presented in . The values of KA of the studied salt at the same temperature were found to increase as the fraction of the ethanol solvent increases with water. The extent of ion association depends on the nature of the ion–ion interaction in the solution, the dielectric constant of the medium, and the intermolecular hydrogen bonding between the solvent molecules. The values of KA increased with the increase of EtOH in water. The association constant for the studied salt was found to decrease with the increase in temperature; increased thermal motion probably breaks a large number of bonds between ions, leading to a large distance between each ion and solvation. Therefore, the movements of ions must increase. This requirement may account for the decrease in KA with increasing temperature.
Table 5 Association constant KA and changes in Gibb’s energy (ΔG°A) for used salt in water + EtOH at different temperatures.
3.7 Walden product
According to Stokes’ law, the ionic mobility depends on the bulk viscosity; as a result, the Walden products [Citation21,Citation22] appear to be inversely proportional to the ionic radius. The differences in the Walden product as a function of the solvent composition and temperature can then be discussed by varying the ion solvation alone.(12)
(12) where the value of the electronic charge is denoted by e0, the Faraday constant is denoted by F; the ionic charge is denoted by Z; and the effective Stokes molecular (ionic radius) is denoted by r.
The most satisfactory interpretation of the Walden products is based on the structure of the H2O–ethanol mixtures and the effect of ions on this structure. The thermodynamic, kinetic, ultrasonic and transport data indicate that the addition of simple alcohols to water initially enhances the structure of the solvent water [Citation23].
The Walden products should decrease with an increase in temperature. This prediction is in agreement with the Walden products, as depicted in .
Fig. 3 Plots of Walden product Λm°ηo/(S cm2 mol−1 kg m−1 s−1) against volume fraction φv for copper sulfate in water + ethanol from T = 298.15–313.15 K.
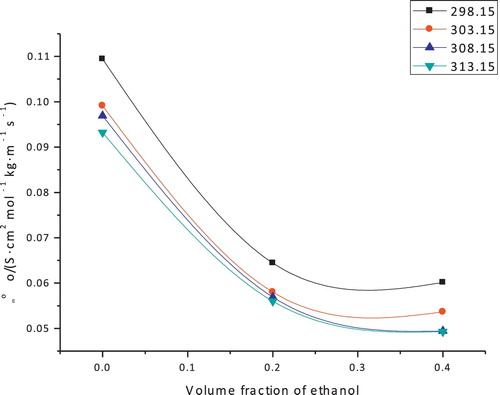
The values of the Walden product are clearly decreased with increasing temperature. This Walden product negative temperature coefficient might be related to the expansion of the size of solvated ions in the solutions as the temperature rises as a consequence of the difference between the proportion of the organic solvent and H2O molecules in the sheath of solvation with temperature [Citation24]. The limiting molar conductance and viscosity are two compelling variables in the Walden product, in which the viscosity is contrarily related to temperature, whereas the limiting molar conductance specifically corresponds to the temperature. This observation indicates that the involvement of the viscosity value is the most effective variable in the relative behavior of the Walden product with temperature. The values of the Walden product were found to decrease as the proportion of ethanol solvent increases in the following order: 0% > 20% > 40%; this observation might be related to a decrease in the molar conductance at an infinite dilution. This implies that the impact of an elevation in the limiting molar conductance is higher than the impact of a decrease in the viscosity of the medium.
3.8 Thermodynamic parameters
The standard free energy of association (ΔG°A) was calculated for salt under study using Eq. Equation(13)(13)
(13) ; its values are listed in .
(13)
(13)
The values of the standard enthalpy (ΔH°A) and the standard entropy (ΔS°A) of the association process were calculated from the van’t Hoff equation dlnK/dT = ΔH°A/RT2 via the plots of (log KA) versus (1/T), where the slope is equal the value of (−ΔH°A/2.303R), while the entropies of association (ΔS°A) for the electrolytes were calculated via the use of the Gibbs–Helmholtz equation ΔG°A = ΔH°A − TΔS°A.
The values of the standard enthalpy (ΔH°A) and standard entropy (ΔS°A) of association process are tabulated in .
Table 6 Entropy change of association (ΔS°A) and enthalpy change of association (ΔH°A) for copper sulfate in used solvents at different temperature.
The negative ΔG°A values indicate that the association processes in all of the studied systems are spontaneous processes. The negative estimation of (ΔH°A) demonstrates that the association processes is exothermic in nature. Many concepts in numerous solvents [Citation25,Citation26] are in good agreement with the values of (ΔH°A) and (ΔS°A). The small values of the entropy of association (ΔS°A) in all of the studied systems suggest that less disorderliness of the system is required for the formation of ion-associations of all of the thermodynamic functions describing the ion association and solvation processes.
3.9 Activation energy of the transfer process
Because the conductance of an ion depends on its mobility [Citation22,Citation27], it is quite reasonable to treat the rating process with the disparity of temperature on the basis of Eq. Equation(14)(14)
(14) [Citation28]:
(14)
(14) where A is the frequency factor, R is the gas constant, and Ea is the Arrhenius activation energy of the transfer process. The Ea values can be determined from the plot of (log Λ0) vs. (1/T). The estimations of the Arrhenius activation energy of the transfer process of the CuSO4 in the utilized solvents are presented in . The behavior of the activation energy change is the inverse that of Λ0. However, the lack of a definitive order of the activation energy of transfer is possibly due to the effect of many interfered factors on the association processes and consequently on the activation energy of transfer.
Table 7 Activation energy (Ea) for copper sulfate in EtOH–H2O solvents.
4 Conclusions
The volumetric properties of copper sulphate in EtOH–H2O solvents were described. The standard partial molar volumes of transfer for copper sulphate were determined. The different solvation volumes were determined. The difference of the volumetric properties reflects the significant influence of solvent and temperature on the salt behavior. The nature of the ion–solvent interaction that takes place in solution controls the extent of ion-pairing in the salt solutions under study. In addition, the ion-pairing depends on the dielectric constant and different properties of the medium. The association decreases as the temperature increases and increases as the proportion of organic solvent increases.
Supplementary data
Download MS Word (18.5 KB)Notes
Peer review under responsibility of Taibah University
Related Research Data
References
- J.F.CastelE.S.AmisJ. Chem. Eng. Data1719725559
- D.FeakinsD.J.FreemantleK.G.LawrenceJ. Chem. Soc. Faraday Trans. I701974795806
- I.Y.KlugmanJ. Electrochem.382002415420
- Y.MarcusIon Solvation1986John Wiley & SonsChichester, UK
- A.WahabS.MahiuddinCan. J. Chem.79200112071212
- E.A.GomaaM.A.TahoonJ. Mol. Liq.21420161923
- T.S.BanipalG.SinghJ. Solut. Chem.3220039971015
- D.P.KharakozJ. Phys. Chem.95199156345642
- C.ZhaoP.MaJ.LiJ. Chem. Thermodyn.3720053742
- VranesMilanSanjaDozicVesnaDjericSlobodanGadzuricJ. Chem. Thermodyn.542012245249
- WangXuRanranFuYuhuaGuoRuisenLinJ. Mol. Liq.19720147376
- J.E.DesnoyersM.AerlG.PerronC.JolicoeurJ. Phys. Chem.73196933463351
- C.VisserG.PerronJ.E.DesnoyersJ. Am. Chem. Soc.99197758945900
- F.J.MilleroJ. Phys. Chem.729196832093214
- E.J.KingJ. Phys. Chem.7319691220
- J.I.KimE.A.GomaaBull. Soc. Chim. Belg.901981391
- J.PadovaI.AbrahamerJ. Phys. Chem.717196721122116
- E.A.GomaaThermochim. Acta911985235241
- C.A.KrausW.C.BrayJ. Am. Chem. Soc.35191313151434
- T.ShedlovskyJ. Frankl. Inst.2251938739743
- P.WaldenZ.AnorgAllg. Chem.113119208597
- J.I.BhatM.K.ShettyJ. Mol. Liq.1602011140143
- F.FranksD.J.G.IvesQ. Rev. Lond.201966144
- R.A.RobinsonR.H.StokesElectrolyte Solutions2nd ed.1965ButterworthLondon
- G.H.NacollasInteractions in Electrolyte Solutions1st ed.1966ElsevierAmsterdam
- T.HashitamiT.R.TamamushiThermodynamic of electrolyte solutions in ions and solventsKagaku Sosetsu, Chem. Soc. Japan Tokyo1976
- F.I.El-DossokiN.E.Y.AbdallhS.E.T.ElmaslyJ. Mol. Liq.1632011135140
- Esam A.GomaaMohamed A.TahoonA.ShokrIonic association and solvation study of CoSO4 in aqueous-organic solvents at different temperaturesChem. Data Collect.201610.1016/j.cdc.2016.06.005
Appendix A
Supplementary data
Supplementary data associated with this article can be found, in the online version, at doi:10.1016/j.jtusci.2016.08.007.
Appendix A
Supplementary data
The following are the supplementary data to this article: