
 ?Mathematical formulae have been encoded as MathML and are displayed in this HTML version using MathJax in order to improve their display. Uncheck the box to turn MathJax off. This feature requires Javascript. Click on a formula to zoom.
Abstract
Simple and precise HPTLC methods were developed for the simultaneous estimation of two anti-inflammatory drugs (curcumin and galangin). The method was tailored to analyze both drugs in their commercial dosage form (capsules) with no interference from ingredients. Chromatographic separation was performed over precoated TLC plates (60 F254, 20 cm × 10 cm, 250 μm thickness, Merck, Darmstadt, Germany) via a linear ascending technique using n-hexane, ethyl acetate, acetic acid, and methanol as the mobile phase. Detection and quantification was achieved at 404 nm through spectro-densitometric analysis. Analytical performance of the proposed HPTLC method was validated according to the ICH guidelines with respect to the linearity, accuracy, precision, detection and quantitation limits, robustness and specificity. The calibration curves were linear with the limits of 80–450 and 200–1200 ng/spot for CU and GA, respectively, with correlation coefficients (r2) >0.9998. The limits of detection were 18.31 and 40.50 ng/spot for CU and GA, respectively. The validated HPTLC method was successfully applied to the simultaneous determination of CU and GA in the commercial polyherbal formulation.
1 Introduction
Natural products contain a wide range of active chemical compounds, including flavonoids, glycosides, triterpenoids, lipids, oils, steroids and organic acids, which may account for their widespread pharmacological activity. The large variety in chemical compounds poses a challenge for analysis, authentication and fast separation with acceptable accuracy and precision and reproducibility [Citation1,Citation2].
Various sophisticated analytical techniques are described in the literature to analyze, authenticate and separate very complex chemical mixtures. Each technique has its own restrictions. For example, liquid chromatography (LC) involves a complex function to change from one mobile phase to another because of the challenge of high back pressure and miscibility [Citation3]. Chromatographic fingerprint investigation has been demonstrated to be a realistic and practical method for quality assessment and species authentication of various traditional medicines. This chromatographic fingerprint of natural products can then be used to identify the presence or absence of markers of concern as well as the ratio of all detectable compounds. Although high performance thin layer chromatography (HPTLC) has a few restrictions, such as a low plate efficiency and narrow developing distance compared with GC and HPLC, it remains a valuable tool for quality assessment of natural products due to its ease, low cost and few requirements, and it has been profitably utilized to develop a chromatographic fingerprint for various natural products, herbal drugs, and commercial herbal formulations. Moreover, the colourful pattern and quantification at the micron and nanogram levels helps to differentiate various samples on the same plate [Citation4–Citation6].
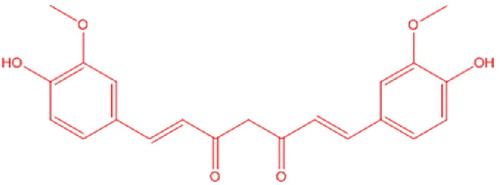
Curcumin (CU) is a well-known polyphenolic moiety that is present in the rhizomes of Curcuma longa Linn. and belongs to the Zingiberaceae family. () It has a wide range of pharmacological and biological actions. This compound shows various therapeutic actions, including antioxidant, hepatoprotective, antirheumatic, antibacterial, antiprotozoal, anti-inflammatory, anti-cancer, anti-HIV, and neuro-protection. Additionally, the safety of CU at very high doses has been verified in numerous human and animal investigations [Citation7–Citation9]. Numerous techniques have been reported in the scientific literature for determining the CU, including UV spectrophotometry [Citation10], HPTLC [Citation11,Citation12], high performance liquid chromatography (HPLC) [Citation13,Citation14] and LC–MS/MS [Citation15] for quantitative determination of CU in the pharmaceutical dosage form, bulk drug and plasma. Moreover, some fluorimetric and NMR methods have also been used for the rapid determination and quantitation of CU [Citation16,Citation17].
Fig. 1 Structure of Curcumin.
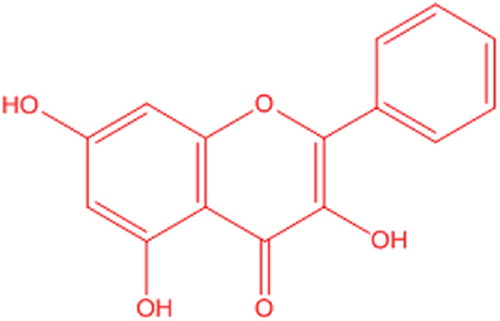
Galangin (GA) is a 3,5,7-trihydroxyflavone that is isolated from rhizomes of the Alpinia galanga and belongs to the Zingiberaceae family. () The plant is commonly known as galangal. It is commonly known for its anti-inflammatory, antipyretic, abortifacient, aphrodisiac, carminative and emmenagogue properties. It is used to treat various diseases, such as heart diseases, kidney disorders, rheumatism, bronchitis, chronic enteritis and renal calculus. GA is also a well-known phytoconstituent of propolis. It shows good antibacterial activity against both Gram-positive and -negative bacteria [Citation18–Citation20]. The identification and quantification of GA in various extracts, biological samples and formulations was addressed in some reports. The analytical methodology in these scientific reports involved the use of HPTLC-densitometric analysis [Citation21], HPLC-UV [Citation22], reversed phase high performance liquid chromatography-diode array detection (RP-HPLC-DAD) [Citation23] and LC–MS/MS [Citation24].
Fig. 2 Structure of Galangin.
To the best of our knowledge, no efforts have yet been made to examine this drug combination by any HPTLC method. The objective of the present investigation is the development of a simple, precise and reproducible HPTLC method for the simultaneous estimation of CU and GA in the pure form and a commercially marketed formulation. As method validation is an essential constraint in analytical method development, the presented method has been validated following the guidelines of the ICH.
2 Experimental
2.1 Chemicals and reagents
Standard curcumin and galangin were purchased from Natural Remedies Pvt. Ltd., Bangalore, India. The herbal drug formulation (Antarth, Millenium Herbal Care Pvt. Ltd., Pune, India) used in this investigation was obtained from the local market. All other chemicals and reagents were analytical grade.
2.2 Chromatographic conditions
The samples were spotted in the form of bands (6 mm width) with a Hamilton microliter syringe (100 μl) under a controlled nitrogen stream using a Cammag Linomat V sample applicator (Switzerland). The slit dimension was kept at 5 mm × 0.45 mm and a scanning speed 10 mm/s. Precoated TLC silica gel aluminium Plates 60 F254 (20 cm × 10 cm, 250 μm thickness, Merck, Darmstadt, Germany) were utilized. Precoated TLC were pre-washed with methanol and activated at 110 °C for 5 min prior to the sample application. Method development was executed in a Cammag twin trough a glass chamber (20 cm × 20 cm) saturated with the mobile phase. The 10 mL mobile phase consisted of n-hexane:ethyl acetate:acetic acid:methanol (7:2:0.5:0.5, v/v/v). Prior to study, the chamber was saturated with the mobile phase for 30 min at room temperature (25 ± 5 °C) at a relative humidity of 60 ± 5%. Densitometric scanning was achieved over a Cammag TLC scanner III operated using win CATS software (V 1.44 CAMAG). The source of radiation used was a UV spectrophotometer. The obtained bands were scanned at a wavelength of 404 nm.
2.3 Preparation of solutions
2.3.1 Standard stock solutions
A standard stock solution of 1000 μg/mL was prepared by dissolving 10 mg of each marker in 10 mL of a volumetric flask containing HPLC grade methanol. Prepared solutions were further diluted with HPLC grade methanol to obtain final concentrations of 100 μg/mL. These stock solutions were used for later studies.
2.3.2 Sample stock solution
A total of 5 capsules were weighed and powdered. To accurately weigh the quantity of the powder equivalent to 8.3 mg of CU and 10 mg of GA, methanol was added, and the mixtures were sonicated for 15 min and then filtered through Whatman filter paper no. 42 into a 10-mL volumetric flask.
3 Validation of the method
The proposed analytical method was validated as per the International Conference on Harmonization (ICH) guidelines Q2 (R1) [Citation25].
3.1 Linearity
Prepared standard stock solution was diluted to obtain linearity standard solutions containing CU and GA in the concentration range of 80–450 and 200–1200 ng/spot, respectively. Three sets of such solutions were evaluated. Every set was analyzed to obtain a calibration curve. The standard deviation (SD), coefficient of determination (r2), slope and intercept of the calibration curves were estimated to determine the method linearity.
3.2 Precision
The present method was validated for intraday and interday precision. Intraday precision was determined in triplicate with the same method on the same day for three different concentrations of CU (100, 250 and 400 ng/spot) and GA (300, 700 and 1100 ng/spot). The interday precision of the method was verified by performing a similar method on different days under the same set of experimental situations. The repeatability of the sample application and calculation of the peak area for the analyte were articulated in terms of the % RSD.
3.3 Robustness
To determine the robustness of the present method, small changes in the chromatographic conditions were intentionally made, which may have affected the performance of the method, such as TLC plate development and developing distance, mobile-phase composition and chamber saturation time.
3.4 Specificity
To verify the method specificity, CU and GA standard and sample solutions were applied to a HPTLC plate, and the plate was developed and scanned as described above. The peak purity of CU and GA was measured by evaluating the spectra of marker compounds at the peak apex, peak start and peak end positions of the spot.
3.5 Accuracy
Accuracy was estimated through the % recoveries of known quantities of the combination of CU and GA added to solutions with marketed preparation. The marketed preparation was spiked with a known quantity of standard markers, and the % ratios between the recovered and expected concentrations were calculated. The analyzed samples were spiked with 80, 100 and 120% of 500 ng/spot of both CU and GA. The accuracy was calculated from the following equation:
3.6 Limit of detection and limit of quantitation
The limit of detection (LOD) is the lowest level of analyte that can be detected in a sample, but not necessarily quantified, under the stated experimental conditions. The limit of quantification (LOQ) was identified as the lowest amount of analyte that can be detected and quantified with acceptable accuracy, precision, and variability. The LOD and LOQ are calculated by the signal to noise method.
4 Analysis of marketed product
To determine the contents of CU and GA in the capsule to an accurately weighed quantity of formulation equivalents of 8.33 mg of CU and 10 mg of GA, 7 mL of methanol was added, followed by sonication for 15 min. The volume of the resulting solution was 10 mL with methanol. The % assay was determined. The possibility of the chemical constituent’s interference with analysis was examined.
5 Results and discussion
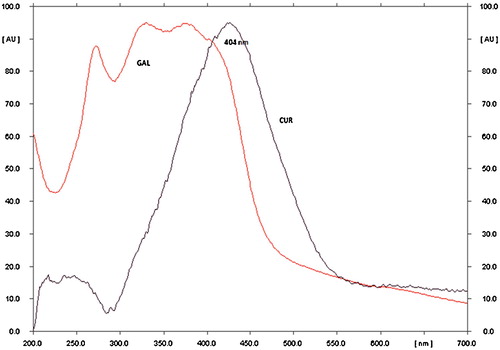
Chromatographic separation was performed on standard solutions of CU and GA. Briefly, spots of the standard samples were applied on TLC plates. The TLC plates were developed by linear ascending development using various solvents, such as acetone, benzene, chloroform, ethyl acetate, methanol and toluene. Based on the observations of these primary trials, various binary, ternary and quaternary mixtures of solvents were evaluated to determine the optimum resolution between CU and GA in their respective solvent mixtures under study. Initially, n-hexane and ethyl acetate were evaluated at several ratios, but inadequate separation between CU and GA occurred, even with the addition of a small quantity of acetic acid to the mobile phase. In these earlier examinations (8:1.5:0.5), CU was clearly separated; however, GA was not satisfactorily resolved. Again, the addition of a small quantity of acetic acid to the aforementioned mobile phase did not improve the separation. Conversely, the addition of methanol to the aforementioned mobile phase produced considerable perfection in both the peak characteristics and separation. The optimized mobile phase consisting of n-hexane:ethyl acetate:acetic acid:methanol (7:2:0.5:0.5, v/v/v) showed satisfactory resolution. Densitometric measurements were achieved with Cammag TLC scanner III that was operated by win CATS software (V 1.44 CAMAG). At a wavelength of 404 nm (), the optimized mobile phase showed the highest sensitivity for quantification of both drugs.
Fig. 3 UV spectra of CU and GA.
Other chromatographic conditions, such as the sample application rate and volume, sample application positions, chamber saturation time, total run length and distance between tracks, were also optimized to give accurate, precise and reproducible Rf values, a symmetrical peak shape and better resolution for both drugs. The optimized chamber saturation time for the given mobile phase was found as 30 min at room temperature (25 + 5 °C) with a relative humidity of 60 + 5%. The total run length of the chromatogram run was approximately 80 mm. The distance between the two tracks was 10 mm. The peak shape was more symmetrical and spots appeared more compact when the TLC plates were pre-treated with methanol and activated at 110 °C for 5 min. After the run, the TLC plates were dried in air for 5–6 min. The slit dimension and scanning speed were 5 mm × 0.45 mm and 10 mm/s, respectively. The optimized chromatographic conditions are mentioned in .
Table 1 Linear regression data for calibration plots of the analyzed drugs using the proposed HPTLC methods.
5.1 Validation of the proposed method
Validation of the proposed methods was performed in accordance with the International Conference on Harmonization (ICH) guidelines (2005).
5.1.1 Linearity
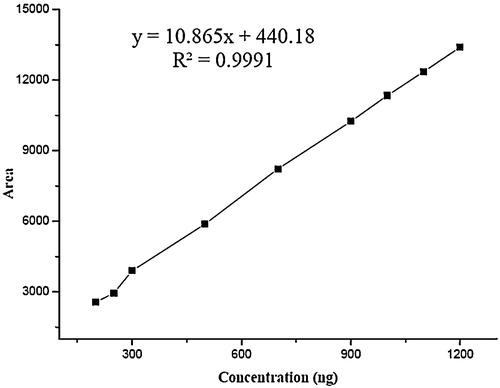
The linearity of the presented HPTLC method was estimated by analysing a series of different concentrations for each of the analytes. Under the optimized state mentioned above, the calculated peak areas at 404 nm were found to be proportional to concentrations of CU and GA. denotes the statistical parameters, including linearity ranges, correlation coefficients, slopes, intercepts and % RSD of the slopes. The linearity graph of CU and GA is shown in and respectively.
Fig. 4 Calibration curve for standard curcumin.
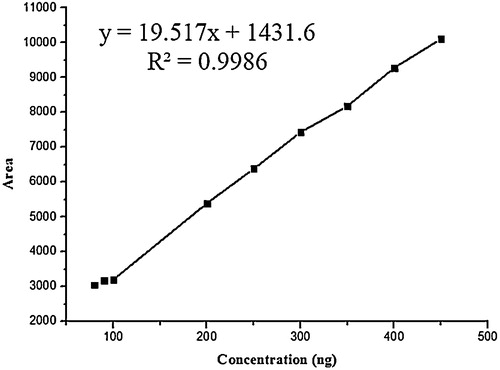
Fig. 5 Calibration curve for standard galangin.
5.1.2 Precision
Both intra-day and inter-day repeatability of the presented method are calculated for each drug. The outcomes of intra-day and inter-day repeatability are shown in , which shows % RSD; this value did not exceed 1% for CU and GA, representing the high level of precision of the given method ().
Table 2 Intra-day and inter-day precision of CU and GA.
5.1.3 Robustness
The parameters of the optimized methods were intentionally varied. Each examined factor was charged at three levels (−1, 0 and 1). Each time a factor was subjected to change, the changes in the responses for both drugs were noted. The summary of the robustness study is given in . The values of the % RSD of the peak areas for both CU and GA in the analysis did not surpass 0.5%. The satisfactory low values of the % RSD of peak areas and unaffected Rf values suggested the robustness of the proposed method.
Table 3 Robustness evaluation of the method for CU.
5.1.4 Specificity
The peak purity of CU and GA was assessed by comparing their respective spectra at the peak apex, peak start and end positions of the peak. A good correlation (r2 value more than 0.999) was obtained for both drugs. Good correlation values and satisfactory peak purity suggest that there is no interference in the quantification of CU and GA in sample solutions. This verifies that the method is specific.
5.1.5 Accuracy
Results from accuracy studies, provided in , were in an acceptable range (94.68–99.91%), indicating that the recovery of the proposed method was good. Additionally, a low % RSD value demonstrated the ruggedness of proposed method.
Table 4 Accuracy studies of CU and GA at 80%, 100% and 120% addition by the proposed TLC densitometric method.
5.1.6 Limit of detection and limit of quantitation
The limit of detection (LOD) values for CU and GA were 18.31 and 40.50 ng, respectively, and the limit of quantification (LOQ) values were 55.50 and 122.74 ng, respectively, which shows the adequate sensitivity of the method ().
5.2 Analysis of marketed product
The developed HPTLC method was used to assay commercial formulation viz. Antarth®. Both drugs were eluted at their specific Rf values. No interfering peaks were observed from any of the inactive ingredients. The % recovery and % RSD are given in . It is clear from these observations that the proposed method is applicable for analysing CU and GA in their combined commercial formulations with accuracy and precision ().
Fig. 6 Densitogram of CU and GA.
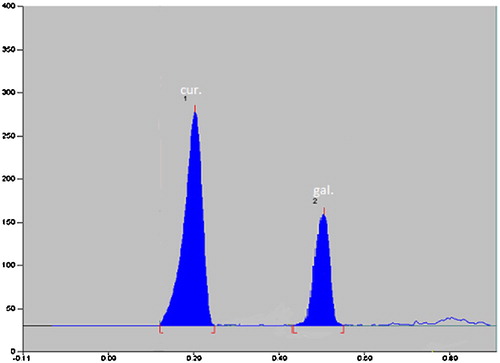
Table 5 Application of the proposed HPTLC method for determination of the analyzed drugs in commercial formulation.
6 Conclusion
The present study illustrates a simple, accurate and precise HPTLC method for the simultaneous estimation of CU and GA. Additionally, the proposed method does not necessitate a complex treatment or sophisticated analytical units, which are usually associated with HPLC and LC–MS/MS analyses. Reliability was ascertained by testing a range of validation parameters of the proposed method. Finally, the proposed method was sensitive and specific; hence, it can be suggested for use for the routine analysis of the cited phytochemicals, either in bulk form or in their combined dosage forms.
Notes
Peer review under responsibility of Taibah University.
Related Research Data
References
- JyotshnaP.SrivastavaB.KilladiK.ShankerUni-dimensional double development HPTLC-densitometry method for simultaneous analysis of mangiferin and lupeol content in mango (Mangifera indica) pulp and peel during storageFood Chem.17620159198
- P.MehtaR.ShahL.SathiyanarayananK.MahadikPharmacokinetic profile of phytoconstituent(s) isolated from medicinal plants – a comprehensive reviewJ. Tradit. Complement. Med.52015207227
- A.PetruczynikM.Waksmundzka-HajnosT.PlechT.TuzimskiM.HajnosG.JozwiakM.GadzikowskaA.RompalaTLC of alkaloids on cyanopropyl bonded stationary phases: Part II. Connection with RP18 and silica platesJ. Chromatogr. Sci.462008291297
- D.RatheeS.RatheeP.RatheeA.DeepS.AnandjiwalaD.RatheHPTLC densitometric quantification of stigmasterol and lupeol from Ficus religiosaArab. J. Chem.82015366371
- A.KambojA.SalujaDevelopment of validated HPTLC method for quantification of stigmasterol from leaf and stem of Bryophyllum pinnatumArab. J. Chem201310.1016/j.arabjc.2013.10.006
- Z.SheikhS.ShakeelS.GulA.ZahoorS.KhanF.ZaidiK.UsmanghaniA novel HPTLC method for quantitative estimation of biomarkers in polyherbal formulationAsian Pac. J. Trop. Biomed.52015955959
- S.SweetmanMartindale: The Complete Drug Reference36th ed.2009Pharmaceutical PressUK
- E.ParkC.JeonG.KoJ.KimD.SohnProtective effect of curcumin in rat liver injury induced by carbon tetrachlorideJ. Pharm. Pharmacol.522000437440
- P.AnandA.KunnumakkaraR.NewmanB.AggarwalBioavailability of curcumin: problems and promisesMol. Pharm.42007807818
- K.SharmaS.AgrawalM.GuptaDevelopment and validation of UV spectrophotometric method for the estimation of curcumin in bulk drug and pharmaceutical dosage formsInt. J. Drug Dev. Res.42012375380
- K.AshrafM.MujeebA.AhmadM.AmirN.MallickD.SharmaValidated HPTLC analysis method for quantification of variability in content of curcumin in Curcuma longa L. (turmeric) collected from different geographical region of IndiaAsian Pac. J. Trop. Biomed.22012S584S588
- V.ThakkerV.ShahU.ShahM.SutharSimultaneous estimation of gallic acid, curcumin and quercetin by HPTLC methodJ. Adv. Pharm. Educ. Res.120117080
- W.WichitnithadN.JongaroonngamsangS.PummanguraP.RojsitthisakA simple isocratic HPLC method for the simultaneous determination of curcuminoids in commercial turmeric extractsPhytochem. Anal.202009314319
- G.JayaprakashaL.RaoK.SakariahImproved HPLC method for the determination of curcumin, demethoxy-curcumin, and bis-demethoxy-curcuminJ. Agric. Food Chem.50200236683672
- P.RamalingamY.KoA validated LC–MS/MS method for quantitative analysis of curcumin in mouse plasma and brain tissue and its application in pharmacokinetic and brain distribution studiesJ. Chromatogr. B: Anal. Technol. Biomed. Life Sci.9692014101118
- F.WangW.HungY.WangFluorescence enhancement effect for the determination of curcumin with yttrium(III)-curcumin-sodium dodecyl benzene sulfonate systemJ. Lumin.1282008110116
- A.GorenS.CikrikciM.CergelG.BilselRapid quantitation of curcumin in turmeric via NMR and LC-tandem mass spectrometryJ. Food Chem.113200912391242
- J.PatelS.KetkarS.PatilJ.FearnleyK.MahadikA.ParadkarPotentiating antimicrobial efficacy of propolis through niosomal-based system for administrationIntegr. Med. Res.4201594101
- D.KaushikJ.YadavP.KaushikD.SacherR.RaniCurrent pharmacological and phytochemical studies of the plant Alpinia galangaJ. Chin. Integr. Med.9201110611065
- F.ChenY.TanH.LiZ.QinH.CaiW.LaiX.ZhangY.LiW.GuanY.LiJ.ZhangDifferential systemic exposure to galangin after oral and intravenous administration to ratsChem. Cent. J.92015110
- V.KaleA.NamdeoHPTLC densitometric evaluation by simultaneous estimation of galangin in Alpinia galanga and Alpinia officinarumDer Pharm. Lett.72015158164
- L.TaoZ.WangE.ZhuY.LuD.WeiHPLC analysis of bioactive flavonoids from the rhizome of Alpinia officinarumS. Afr. J. Bot.722006163166
- S.VerzaC.PaveiG.BorreA.SilvaG.OrtegaP.MayorgaDetermination of galangin in commercial extracts of Alpinia officinarum by RP-HPLC-DADLat. Am. J. Pharm.302011576579
- L.KoseL.GulcinA.GorenJ.NamiesnikA.Martinez-AyalaS.GorinsteinLC–MS/MS analysis, antioxidant and anticholinergic properties of galanga (Alpinia officinarum Hance) rhizomesInd. Crops Prod.742015712721
- International Conference on HarmonizationICH Q2 (R1): Validation of Analytical Procedures: Text and Methodology2005ICH SecretariatGeneva