
 ?Mathematical formulae have been encoded as MathML and are displayed in this HTML version using MathJax in order to improve their display. Uncheck the box to turn MathJax off. This feature requires Javascript. Click on a formula to zoom.
Abstract
The ACD/ChemSketch, MarvinSketch, and ChemOffice programmes were used to calculate several molecular descriptors of 51 odorant molecules (15 alcohols, 11 aldehydes, 9 ketones and 16 esters). The best descriptors were selected to establish the Quantitative Structure-Property Relationship (QSPR) of the retention/release property of odorant molecules in pectin gels using Principal Components Analysis (PCA), Multiple Linear Regression (MLR), Multiple Non-linear Regression (MNLR) and Artificial Neural Network (ANN) methods We propose a quantitative model based on these analyses. PCA has been used to select descriptors that exhibit high correlation with the retention/release property. The MLR method yielded correlation coefficients of 0.960 and 0.958 for PG-0.4 (pectin concentration: 0.4% w/w) and PG-0.8 (pectin concentration: 0.8% w/w) media, respectively. Internal and external validations were used to determine the statistical quality of the QSPR of the two MLR models. The MNLR method, considering the relevant descriptors obtained from the MLR, yielded correlation coefficients of 0.978 and 0.975 for PG-0.4 and PG-0.8 media, respectively. The applicability domain of MLR models was investigated using simple and leverage approaches to detect outliers and outside compounds. The effects of different descriptors on the retention/release property are described, and these descriptors were used to study and design new compounds with higher and lower values of the property than the existing ones.
1 Introduction
Pectin is a natural product that can be found in the cell walls of all higher plants, and it has long been used for its gel-forming, thickening and stabilizing properties in a wide range of applications, from food to the pharmaceutical and cosmetic industries. Pectin is a natural part of the human diet, being present in fruits and vegetables, but it does not contribute significantly to nutrition. Pectin passes through the small intestine more or less intact. Pectin is therefore a highly sophisticated stabilizer recognized globally by consumers as label friendly and as one of the most important sources of dietary fibre.
Table 3 Molecular topological descriptors computed by ChemOffice software.
Table 4 Molecular topological descriptors computed by ChemSketch and MarvinSketch.
Consumption of pectin has been shown to reduce blood cholesterol levels. The mechanism appears to be an increase in viscosity in the intestinal tract, leading to reduced absorption of cholesterol from bile or food. In the large intestine and colon, microorganisms degrade pectin and liberate short-chain fatty acids that have a positive influence on health (prebiotic effect).
Odorant molecules, which are commonly known as aroma compounds, play a crucial role in the organoleptic quality of food and its acceptability by consumers [Citation1]. Thus, the formulation of new fat-free food products (with pectin) requires an understanding of the physicochemical properties that control the retention/release of odorant molecules. Therefore, any modifications to a food matrix generate changes in the flavour retention/release balance, which are dependent on the compositions and concentrations of the volatile compounds in foods and the composition of the food matrix [Citation2].
The purpose of this work is to study the retention/release property of odorant molecules in pectin gels (two pectin concentrations: 0.4% and 0.8% w/w) by varying their chemical class and molecular structure (linear, branched and/or unsaturated) using the quantitative structure property relationship (QSPR) chemical modelling methods.
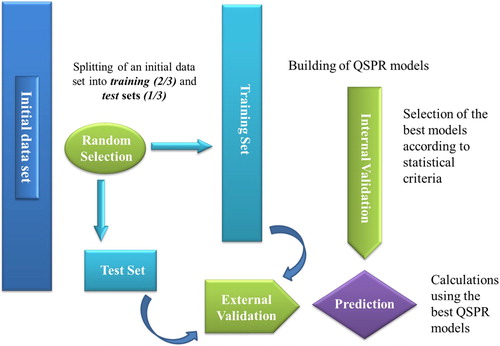
The methodology used in this QSPR study is as follows ().
Fig. 1 Flow chart of the methodology used in this work.
2 Material and methods
2.1 Experimental data
In this study, we selected 51 odorant molecules with properties reported in the literature [Citation3] to provide a diversified set of chemical families (alcohols, aldehydes, ketones and esters) and chemical structures (linear, unsaturated and unsaturated-branched). The fragrant molecules were selected by their structures without considering their organoleptic qualities. The list of molecules and their Log(1/K) values are displayed in .
Table 1 List of aroma compounds.
The retention/release property of the selected odorant molecules was examined using pectin gels, and this property was quantified by the vapour-liquid partition coefficient K and more precisely by the Log(1/K) values [Citation3].
The two pectin gels are denoted by PG-0.4 and PG-0.8 according to their final pectin concentrations (0.4% w/w and 0.8% w/w, respectively) [Citation4].
A total of 37 molecules were placed in the training set to build the QSPR models, whereas the remaining 14 molecules constitute the test set. The division was carried out by random selection using the SPSS 19.0 statistical package [Citation5].
2.2 Calculation of molecular descriptors
A wide variety of molecular descriptors were calculated using ACD/ChemSketch, MarvinSketch and ChemOffice software [Citation6–Citation8] to predict the correlation between these descriptors and the retention/release property of the molecules studied in pectin gels (). Tables 3 and 4 provide the values of these descriptors for each molecule studied.
Table 2 Calculated topological molecular descriptors.
2.3 Statistical analysis
In this step, Principal Components Analysis (PCA) was used to determine the non-linearity of variables (descriptors) and select the descriptors correlated with the property [Citation9].
Consequently, Multiple Linear Regression (MLR) is used to study the relationship between a dependent variable and several independent variables; it minimizes the differences between actual values and predicted values and has been used to select the descriptors to be used as inputs in Multiple Non-Linear Regression (MNLR) and Artificial Neural Network (ANN) (Multi-Layer Perceptron (MLP) and Radial Basis Function Network (RBF) types). Multiple linear and nonlinear regressions were used to predict the effects on the property, and the equations were justified by the correlation coefficient (r), the mean square error (MSE), the Fisher value (F) and the significance level (p) [Citation10].
PCA, MLR, MNLR, and ANN (MLP and RBF types) are generated using the SPSS 19.0 statistical package [Citation5].
3 Results and discussion
3.1 Data set for analysis
A QSPR study was carried out for a series of 51 odorant molecules, as indicated above, to determine a quantitative relationship between the structure and the property studied. The values of the 26 descriptors are shown in Tables 3 and 4.
3.2 Principal components analysis
A total of 26 descriptors of 51 molecules studied were subjected to PCA. The first five main axes are sufficient to describe the information provided by the data matrix. The percentages of the variance are 47.116%, 24.968%, 9.751%, 7.927% and 4.354% for the F1, F2, F3, F4 and F5 axes, respectively. The total information is estimated as 94.116%.
PCA was conducted to identify the link between the different variables. The correlations between the twenty-six descriptors are shown in as a correlation matrix.
Table 5 Matrix of correlation.
The matrix obtained provides information on the high or low interrelationship between the variables. In general, good co-linearity (r > 0.5) [Citation11] was observed between most of the variables. High interrelationship was observed between O% and C% (r = −0.975), and low interrelationship was observed between W and I (r = −2.567.10−4).
3.3 Multiple Linear Regression (MLR)
The results of the PCA analysis are used to select the input data of the MLR. Thus, at the beginning, we have eliminated all variables (descriptors) whose correlations are small (not significant, r ≤ 0.3) with respect to the dependent variable (Log(1/K)). To reduce the redundancy existing in our data matrix, the highly correlated descriptors (r ≥ 0.9) and those that have a low correlation coefficient value in relation to the dependent variable have been excluded ().
The Variance Inflation Factor (VIF) was defined as 1/(1-r2), where r is the multiple correlation coefficient for an independent variable against all other descriptors in the model. The models with a VIF greater than 5 were unstable and thus eliminated; the models with VIF values between 1 and 4 may be accepted.
At this stage, VIF values greater than 5 were found; then, to improve the results (), the highly correlated descriptors (r ≥ 0.8) and those that have a low value of correlation coefficient with the dependent variable were eliminated ().
Table 6 Multicollinearity statistics.
The relationship obtained using this method corresponds to the linear combination of these descriptors: Heat of formation (H°), Henry’s law constant (KH), Index of refraction (n) and Balaban index (J).
The resulting equation for the PG-0.4 medium is as follows:(1)
(1) N = 37; r = 0.960; r2 = 0.921; MSE = 0.016; F = 93.305; P < 0.0001.
The resulting equation for the PG-0.8 medium is as follows:(2)
(2) N = 37; r = 0.958; r2 = 0.917; MSE = 0.018; F = 88.165; P < 0.0001.
In these equations, N is the number of compounds, r is the correlation coefficient, r2 is the coefficient of determination, MSE is the mean squared error, F is the Fisher's criterion, and P is the significance level.
It is observed that the correlation coefficient r is very high and that the mean squared error value (MSE) is low, which makes it possible to indicate that the model is more reliable. A P value much smaller than 0.05 indicates that the regression equations are statistically significant, and we can conclude, with confidence, that the model provides a significant amount of information [Citation12].
The predicted Log(1/K) values calculated from equations Equation(1)(1)
(1) and Equation(2)
(2)
(2) are given in in comparison to the observed values.
Table 7 Comparison of the observed values with those calculated by MLR, MNLR and ANN (MLP and RBF types) methods in PG-0.4 and PG-0.8 medias.
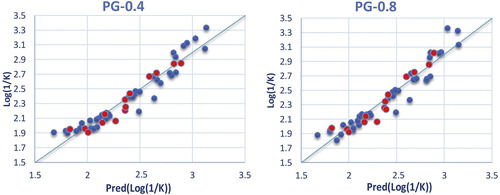
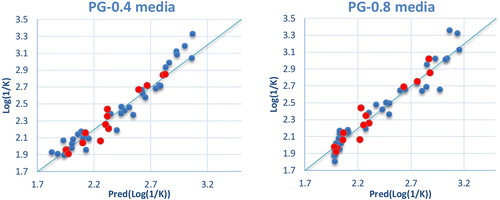
The correlations between the predicted and observed Log(1/K) values in PG-0.4 and PG-0.8 media are shown in . The descriptors proposed in the equations by MLR are therefore used as input parameters in the multiple nonlinear regressions (MNLR) and the artificial neural network (ANN) [Citation13].
Fig. 2 Graphical representation of calculated and observed property values calculated by MLR in PG-0.4 and PG-0.8 medias (training set in blue; test set in red).
3.4 Multiples nonlinear regression (MNLR)
We also used the multiple nonlinear regression model technique to quantitatively improve the structure–property relationships by accounting for several parameters. MNLR is the most commonly used tool for the study of multidimensional data. We applied it to the data matrix constituted from the descriptors proposed by the MLR corresponding to the set of 37 molecules [Citation14].
The resulting equation for the PG-0.4 medium is as follows:(3)
(3) N = 37; r = 0.978; r2 = 0.956; MSE = 0.010; F = 89.894; P < 0.0001.
The resulting equation for the PG-0.8 medium is as follows:(4)
(4) N = 37; r = 0.975; r2 = 0.950; MSE = 0.012; F = 78.176; P < 0.0001.
The predicted Log(1/K) values calculated from equations Equation(3)(3)
(3) and Equation(4)
(4)
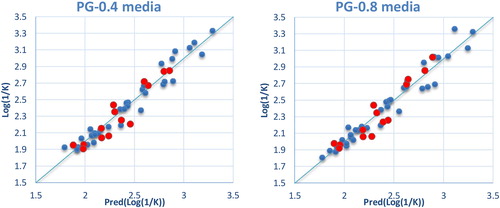
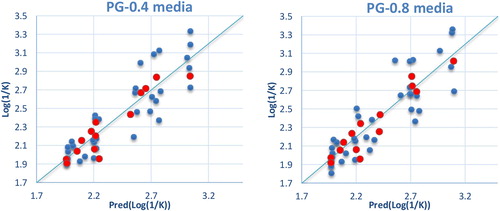
(4) are given in in comparison to the observed values. The correlations between the predicted and observed Log(1/K) values in PG-0.4 and PG-0.8 media are shown in .
Fig. 3 Graphical representation of calculated and observed property values calculated by MNLR in PG-0.4 and PG-0.8 medias (training set in blue; test set in red).
3.5 Artificial neural networks (ANN)
To increase the probability of a good characterization of the molecules studied, Artificial Neural Networks (ANN) can generate a predictive model of the QSPR relationship between the descriptors obtained from the MLR and the observed property.
In this study, we used two types of artificial neural networks: Multi-Layer Perceptron (MLP) and Radial Basis Function Networks (RBFs).
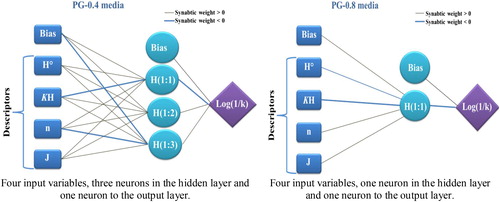
Multi-Layer Perceptron (MLP): The ANN model has received great interest because its universal function approximators can map any linear or nonlinear function. The multi-layer perceptron (MLP) neuronal network model is a supervised neural network based on the original simple perceptron model with back propagation for training the network. It commonly consists of an input layer of source nodes, an output layer and one or more hidden layers of computation nodes (neurons) that increase the learning power of the MLP model. The number of hidden neurons determines the learning capacity of the MLP network. It is most recommended to select the network that performs best with the least possible number of hidden neurons.
The property models computed by the MLP methods were developed using the properties of several molecules studied (). The correlations between the predicted and observed Log(1/K) values in PG-0.4 and PG-0.8 media are shown in .
Fig. 4 The architectures of the MLP methods used, in PG-0.4 and PG-0.8 medias.
The predicted Log(1/K) values calculated by MLP methods are given in for comparison to the observed values.
Radial Basis Function Networks (RBFs): RBF neural networks are neural networks based on localized basis functions and iterative function approximation. In terms of structure, an RBF is composed of three layers, namely, an input layer, an output layer, and a hidden layer (). These types of networks are of fixed architecture with a single hidden layer; in comparison, an MLP may have more than one hidden layer. Indeed, an RBF represents a special case of MLP [Citation15]. Owing to their simple design, extremely strong tolerance to input noises, and fast yet pervasive training capabilities, these networks have attracted a great deal of attention. In RBF, there is a single input layer wherein no processing is undertaken. The hidden layer, however, contains radial basis functions, with the output layer solely containing collectors. In fact, the output layer linearly combines all outputs from neurons in the hidden layer to generate the network output. Compared to MLP networks, this type of network requires a larger number of neurons even though they enjoy shorter designs, with the principal distinction being the application of activation functions to be used by neurons [Citation16].
Fig. 5 Graphical representation of calculated and observed property values calculated by MLP methods in PG-0.4 and PG-0.8 medias (training set in blue; test set in red).
The property models computed by the RBF methods were developed using the properties of several molecules studied (). The correlations of the predicted and observed property values in PG-0.4 and PG-0.8 media are illustrated in . The predicted Log(1/K) values calculated by RBF methods are given in in comparison to the observed values.
Fig. 6 The architectures of the RBF methods used, in PG-0.4 and PG-0.8 medias.
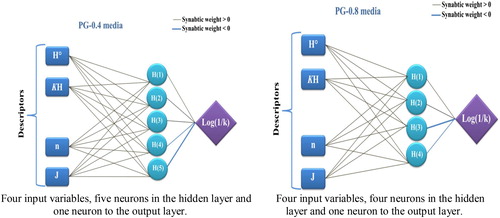
Fig. 7 Graphical representation of calculated and observed property values calculated by RBF methods in PG-0.4 and PG-0.8 medias (training set in blue; test set in red).
3.6 Internal Validation
Cross-Validation: The Cross-Validation statistical procedure can be used to evaluate the predictive power of QSPR models. The Leave-One-Out procedure successively removes one molecule from the training set containing n molecules. A QSPR model is constructed on an “n-1” set of compounds, and the molecule removed is predicted by the model. This procedure is repeated “n” times to predict the property of all molecules.
The QSPR models expressed by the equations of the MLR and MNLR methods in PG-0.4 and PG-0.8 media are validated by its appreciable values of r2cv () obtained using the Leave-One-Out (LOO) procedure. An r2cv value greater than 0.5 is the basic condition for qualifying a QSPR model as valid.
Table 8 r2cv values obtained by the leave-one-out (LOO) method.
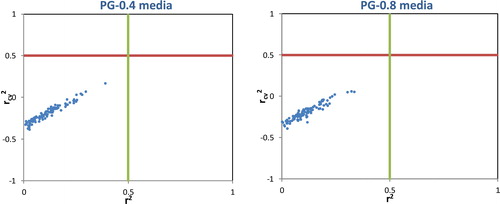
y-Randomization test: To ensure that the developed QSPR models are robust and not derived due to chance, the y-randomization test was performed on the training set data as recommended [Citation17]. In this test, MLR models are generated by randomly scrambling the dependent variable (property data) while keeping the independent variable (descriptors) unchanged. The resulting models are expected to have significantly low r2 and cross-validated r2cv values for several trials, which confirms that the developed models are robust. We performed 100-y-randomization tests and observed that, for all the models, the values of r2 and r2cv were <0.5 (). This test confirms that the developed models (in PG-0.4 and PG-0.8 media) are robust and not derived merely due to chance.
Fig. 8 y-Randomization plot of MLR models.
3.7 External Validation
To estimate the predictive power of the MLR, MNLR and ANN (MLP and RBF types) models, we must use a set of compounds that have not been used in the training series to establish the QSPR model. The models established in the calculation procedure using the odorant molecules are used to predict the property of the remaining 14 molecules. The main performance parameters for the four models in PG-0.4 and PG-0.8 media are shown in .
Table 9 Comparison of MLR, MNLR and ANN (MLP and RBF types) models.
The results obtained by the MLR, MNLR and ANN (MLP and RBF types) models are sufficient to conclude the performances of models; this is confirmed by the test conducted with the 14 compounds ().
A comparison of the quality of the MLR, MNLR and ANN (MLP and RBF types) models shows that the four approaches have better predictive capability and thus yield better results. MLR, MNLR and ANN established a satisfactory relationship between the molecular descriptors and the retention/release property of the studied compounds in PG-0.4 and PG-0.8 media ().
The MSE obtained during the training process of the RBF network was significantly larger than that in the MLP network. However, the MLP network was more able to predict the retention/release property of odorant molecules in PG-0.4 and PG-0.8 media than the RBF network.
3.8 Domain of applicability
Evaluation of the applicability domain of the QSPR model is considered an important step to establish that the model is reliable enough to make predictions within the chemical space for which it was developed [Citation18]. There are several methods for defining the applicability domain of a QSPR model, but we used the most commonly used leverage approach in this study [Citation19]. Leverage of a given chemical compound hi is defined as:where xi is the descriptor row of the query compound and X is the descriptor matrix of the training set compounds used to develop the model. As a prediction tool, the warning leverage h* is defined as:
where n is the number of training compounds and p is the number of descriptors in the model.
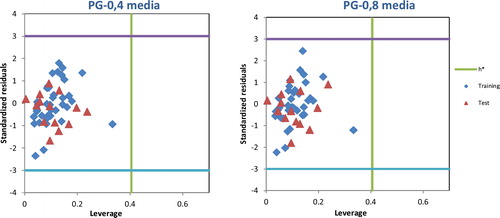
The test compounds with leverages hi < h* are considered to be reliably predicted by the model. The Williams plot is used to interpret the applicability domain of the model. The domain of reliable prediction for external test set compounds is defined as compounds that have leverage values within the threshold (hi < h*) and standardized residuals no greater than 3 units (±δ). Test set compounds for which hi > h* are considered to be unreliably predicted by the model due to substantial extrapolation. For the training set, the Williams plot is used to identify compounds with the greatest structural influence (hi > h*) on the development of the model.
From the Williams plot (), it is obvious that all compounds in the test set in PG-0.4 and PG-0.8 media fall inside the domain of the MLR models (the warning leverage limit is 0.405). For all the compounds in the training and test sets for PG-0.4 and PG-0.8 media, their standardized residuals are smaller than three standard deviation units (3 ± δ). Therefore, the predicted retention/release property by the developed MLR models is reliable in two media (PG-0.4 and PG-0.8).
Fig. 9 Williams plot to evaluate the applicability domain of MLR models in PG-0.4 and PG-0.8 medias.
3.9 Proposed novel compounds
QSPR correlates property data with the physicochemical properties of a group of compounds. It has been frequently used to predict proprieties of new compounds and to design compounds with desired properties.
The developed equations Equation(1)(1)
(1) and Equation(2)
(2)
(2) can be used for the design of new odorant molecule derivatives with improved retention/release property (Log (1/k)).
A comparison of t-test and standardized coefficient values of descriptors indicates that the influences of the Henry’s law constant KH on Log (1/k) are stronger than those of the others in PG-0.4 and PG-0.8 media.
Equations Equation(1)(1)
(1) and Equation(2)
(2)
(2) of the RLM methods indicate the positive correlation of the Henry’s law constant KH.
The obtained results show that, to increase the retention property of odorant molecules, the Henry’s law constant KH should be increased. Moreover, to increase the release property, we will decrease the Henry’s law constant KH of these molecules by adding suitable substituents and calculating their property using equations Equation(1)(1)
(1) and Equation(2)
(2)
(2) .
The structures of the designed compounds and their parameter values calculated by the same methods, as well as the Log(1/k) values theoretically predicted by the MLR models, are listed in .
Table 10 Values of descriptors, retention/release property (Log(1/K)) in PG-0.4 and PG-0.8 medias, and leverages (h) for the new designed compounds.
From the predicted proprieties, it has been observed that the designed compounds X1, X2, X3, X4 and X5 have higher Log (1/k) values than the existing compounds. Additionally, the designed compounds Y1, Y2, Y3, Y4, Y5, Y6, Y7, Y8 and Y9 have lower Log (1/k) values than the existing compounds in the case of the 51 studied compounds in PG-0.4 and PG-0.8 media ().
The leverage values (h) for the newly designed compounds are displayed in ; only three compounds (X2, X3 and Y6) are defined as outliers (in PG-0.4 and PG-0.8 media), and consequently they are not considered because they have leverages that are greater than h* (h* = 0.405) [Citation20].
3.10 Comparison of the results of the two media
The results of this work allow us to conclude that the concentration of pectin has an effect on the balance of retention/release of odorant molecules. Indeed, as observed in and , the effects of increasing the pectin concentration vary according to the molecules: the increase in pectin concentration increases the retention of certain molecules but increases the release of other molecules. This can be explained by equations Equation(1)(1)
(1) and Equation(2)
(2)
(2) of the MLR models. Indeed, an increase in the values of the Heat of formation (H°) and Henry’s law constant (KH) variables (descriptors) increases the retention of the molecules in the two media (PG-0.4 and PG-0.8), while an increase in the values of the Index of refraction (n) and Balaban index (J) variables increases the release of molecules in the two media. The difference between the two equations is observed between the values of the coefficients of these variables.
Then, to increase the concentration of pectin in a food matrix by preserving the properties of the aromatic compounds and consequently the organoleptic quality of the foods and their acceptability by consumers, the following inequality must be considered:(5)
(5) bLog(1/K) values in PG-0.4 medium; cLog(1/K) values in PG-0.8 medium.
Therefore, any increase in the concentration of pectin in a food matrix, the same as in this example, requires the proposition of new molecules that satisfy the following inequality obtained from equations Equation(1)(1)
(1) and Equation(2)
(2)
(2) and respect inequality Equation(5)
(5)
(5) :
(6)
(6)
4 Conclusion
Multiple linear and non-linear regression and artificial neural networks (MLP and RBF types) were used to construct quantitative structural property relationship models of odorant molecules for their retention/release property. The results show that the models proposed in this paper can predict the retention/release property accurately and that the selected parameters are pertinent. The accuracy and predictability of the proposed models were illustrated by comparison of the key statistical terms r or r2, and the predictive powers of the equations were validated by an internal test (cross-validation and 100-y-randomization) and external test set.
The results for all the used models have substantially good predictive capability, but MLR gave the most important interpretable results. The applicability domain of the MLR model was defined.
We conclude that the most important contribution of this research is that we have been able to design and propose various new compounds with higher or lower retention/release property values than the existing ones by adding suitable substituents and calculating their property values using regression equations. Consequently, the proposed models will reduce the time and cost of synthesis and determination of the retention/release property for odorant molecules.
Acknowledgment
We are grateful to the “Association Marocaine des Chimistes Théoriciens” (AMCT) for its pertinent help concerning the programmes.
Notes
Peer review under responsibility of Taibah University.
References
- J.E.SteinerD.A.StevensD.A.DooleyJ.D.LairdN.MausV.PudelFood acceptability1988Elsevier Science Publishers Ltd.London, UKhttp://refhub.elsevier.com/S0963-9969(14)00299-3/rf0235
- S.SecouardC.MalhiacM.GriselB.DecroixRelease of limonene from polysaccharide matrices: Viscosity and synergy effectFood Chem.822200322723410.1016/S0308-8146(02)00518-6
- C.AyedS.LubbersI.AndriotY.MerabtineE.GuichardA.TromelinImpact of structural features of odorant molecules on their retention/release behaviours in dairy and pectin gelsJ. Food Res. Int.62201484685910.1016/j.foodres.2014.04.050
- Y.MerabtineS.LubbersI.AndriotA.TromelinE.GuichardRetention/release equilibrium of aroma compounds in fat-free dairy gelsJ. Sci. Food Agric.909201014031409http://refhub.elsevier.com/S0963-9969(14)00299-3/rf0180
- SPSS 19.0. http://www.ibm.com/analytics/fr/fr/technology/spss/.
- ACDLABS 102015Advanced Chemistry Development, Inc.Toronto, ON, Canadahttp://www.acdlabs.com/
- MarvinSketch 5.11.42012Chem Axonhttp://www.chemaxon.com
- ChemBioOffice2010PerkinElmer Informaticshttp://www.cambridgesoft.com
- M.LarifA.AdadR.HmammouchiA.I.TaghkiA.SoulaymaniA.ElmidaouiM.BouachrineT.LakhlifiBiological activitiesof triazine derivatives combining DFT and QSAR resultsArab. J. Chem.102017S946S95510.1016/j.arabjc.2012.12.033
- S.ChtitaR.HmamouchiM.LarifM.GhamaliM.BouachrineT.LakhlifiQSAR Studies of toxicity towards monocytes with (1,3-benzothiazol-2-yl)amino-9-(10H)-acridinone derivatives using electronic descriptorsOrbital72201517618410.17807/orbital.v7i2.677
- M.GhamaliS.ChtitaA.OusaaB.ElidrissiM.BouachrineT.LakhlifiQSAR analysis of the toxicity of phenols and thiophenolsusing MLR and ANNJ. Taibah Univ. Sci.111201711010.1016/j.jtusci.2016.03.002
- R.HmamouchiM.LarifS.ChtitaA.AdadM.BouachrineT.LakhlifiPredictive modelling of the LD50 activities of coumarin derivatives using neural statistical approaches: Electronic descriptor-based DFTJ. Taibah Univ. Sci.104201645146110.1016/j.jtusci.2015.06.013
- S.ChtitaR.HmamouchiM.LarifM.GhamaliM.BouachrineT.LakhlifiQSPR studies of 9-aniliioacridine derivatives for their DNA drug binding properties based on density functional theory using statistical methods: Model, validation and influencing factorsJ. Taibah Univ. Sci.106201645146110.1016/j.jtusci.2015.04.007
- S.ChtitaM.LarifM.GhamaliM.BouachrineT.LakhlifiQuantitative structure-activity relationship studies of dibenzo[a,d]cycloalkenimine derivatives for non-competitive antagonists of N-methyl-d-aspartate based on density functional theory with electronic and topological descriptorsJ. Taibah Univ. Sci.92201514315410.1016/j.jtusci.2014.10.006
- R.J.SchalkoffArtificial Neural Networks1997McGraw-HillNew Yorkhttp://trove.nla.gov.au/version/18998022
- F.MariniArtificial neural networks in foodstuff analyses: Trends and perspectives A reviewAnal. Chim. Acta635200912113110.1016/j.aca.2009.01.009
- K.RoyI.MitraOn various metrics used for validation of predictive QSAR models with applications in virtual screening and focused library designComb. Chem. High Throughput Screen.142011450474http://refhub.elsevier.com/S0278-6915(14)00164-1/h0200
- L.ErikssonJ.JaworskaA.P.WorthM.T.D.CroninR.M.McDowellP.GramaticaMethods for reliability and uncertainty assessment and for applicability evaluations of classification and regression-based QSARsEnviron. Health Perspect.111200313611375
- P.GramaticaPrinciples of QSAR models validation: internal and externalQSAR Comb. Sci.262007694701http://refhub.elsevier.com/S0278-6915(14)00164-1/h0085
- S.ChtitaM.GhamaliR.HmamouchiB.ElidrissiM.BourassM.LarifM.BouachrineT.LakhlifiInvestigation of Antileishmanial Activities of Acridines Derivatives against Promastigotes and Amastigotes Form of Parasites Using Quantitative Structure Activity Relationship AnalysisHindawi Publ. Corp. Adv. Phys. Chem.201611610.1155/2016/5137289