 ?Mathematical formulae have been encoded as MathML and are displayed in this HTML version using MathJax in order to improve their display. Uncheck the box to turn MathJax off. This feature requires Javascript. Click on a formula to zoom.
Abstract
The aim of the present study, carried out in South Sumatra under conditions of high solar radiation and a rainfall of about 2500 mm per year, was to identify oil palm material suitable for planting at high densities. To that end, we monitored leaf expansion of tenera progenies descending from the pisifera male parent origins Ekona, Nigeria and Calabar, by fitting logistic growth curves through the area of the fully developed youngest leaf as a function of palm age. In addition, estimates were made of the (asymptotic) maximum leaf area attained (Lmax) and the time to reach 95% of Lmax (t0.95). During the first 5 years after planting when the canopy closes, i.e., Phase 1 of canopy expansion, the area of individual leaves was very similar among the three origins, although the leaf area of the origin Nigeria slightly exceeded that of the two other ones. During the second 5-year period (Phase 2), leaf expansion rate started to divert: Calabar already reached t0.95 at 6.9 years after planting compared with 7.4 years for Nigeria and 8.8 years for Ekona. During Phase 3, the final phase of stable leaf area, Calabar attained a lower Lmax (7.99 m2) than the two other origins: 9.63 and 10.11 m2 for Nigeria and Ekona, respectively. Logistic growth curves were also used to calculate leaf area index (LAI). For maximum yield per ha the optimal LAI was assumed to lie between 5.5 and 6.0. When planted at a standard density of 143 palms per ha, compared with the density of 135 palms per ha used in this study, LAI at mature canopy size (Phase 3) would be 5.6 for Ekona; 5.4 for Nigeria; and 4.5 for Calabar. Because the LAI of Calabar is far below the optimal range, it was concluded that the planting density of Calabar can be increased to 160 palms per ha, which gives an LAI of 5.0 at Phase 3. General Combining Ability (GCA) values, i.e., the additive genotypic effects (of parents), for bunch yield as well as Lmax varied considerably among individual pisifera male parents. In particular, some pisifera of the origin Nigeria combined high GCA values for yield with low GCA values for Lmax. Such an inverse relationship offers the possibility to select pisifera male parents for producing tenera material suitable for planting at high densities. The study further concludes that Lmax is a more suitable criterion for estimating optimal density than the conventional method based on mean leaf area.
Keywords:
1 Introduction
1.1 Canopy expansion in oil palms
During photosynthesis, sunlight provides the energy for producing dry matter. Competition for light among oil palms increases with planting density and also as a result of canopy expansion during the early years after planting. Canopy expansion can be conveniently divided into three distinct phases [Citation1]. Phase 1 is the period from planting until canopy closure and lasts, at a standard planting density, about 5 years. In Phase 2 the area of the fully expanded youngest leaves continues to increase until the new leaves attain a maximum and by and large stable value. Phase 3 is the period of stabilization. In favourable environments, canopy expansion lasts about 10 years, but this period becomes longer if growing conditions are suboptimal, such as, for example, in West Africa [Citation2].
1.2 Estimating leaf area
Conventionally, the mean leaf area has been used to estimate optimal planting density of a type of palm material in a certain environment [Citation2,Citation3]. Since the size of the mature canopy has an effect on photosynthesis during the main period of bunch production, estimating leaf area is particularly relevant when palms are older than 10 years. Frequent measurements are needed for a reliable estimate of mean leaf area, since the area of individual leaves may fluctuate considerably due to changes in growing conditions and/or the load of bunches that develop on the palms [Citation4]. So recording leaf area for some years at mature-canopy size is not a practical strategy for estimating planting density of palm material.
Once fully opened, the oil palm leaf stops growing. Breure [Citation5] found that oil palm progenies can differ markedly in rate of leaf area expansion, i.e., the increase in area of the youngest developed leaves as a function of time, as well as in final leaf size. The asymptotically attained area of individual leaves (Lmax) and the time to reach 95% of Lmax (t0.95) were estimated from a logistic growth curve fitted through the area of the youngest expanded leaf plotted against the number of years after planting, before leaf area had stabilized. Since this curve, albeit based on a restricted number of measurements, reliably estimates the area of mature individual leaves before the canopy attains its final size, Lmax is a strong alternative for estimating optimal planting density. The present paper follows this approach.
1.3 Optimal leaf area index in oil palms
The level of competition for light among palms is usually described by the leaf area index (LAI). In oil palm, LAI is estimated from the product of the number of palms per ha, the number of leaves per palm, and their mean leaf area. As Von Uexküll et al. [Citation6] pointed out, the optimum LAI value, i.e., the value giving the highest bunch yield per ha, is site-specific. For the high-solar radiation conditions of South-East Asia, it is generally accepted that the optimum LAI value lies between 5.5 and 6.0.
Clearly, early yields benefit when the optimum LAI is reached as soon as possible after field planting. An option is to plant the palms at a high density. Closer planting, however, may give rise to an LAI exceeding the optimum, resulting in a lower yield later on, as was illustrated in a diagram by Breure [Citation7]. Here, the production of dry matter components is depicted in the period of 6–9 years after planting ().
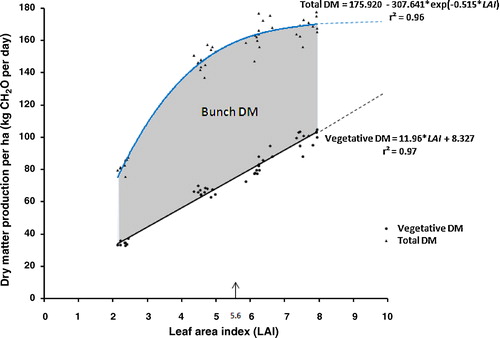
shows that total (above-ground) dry matter (DM) production per ha in terms of the amount of synthesized carbohydrate (CH2O per day) increases asymptotically as a function of LAI, and by and large stabilizes at LAI values higher than about 6. In contrast, vegetative DM production continues to increase linearly at LAI values higher than 6. also shows that the difference, i.e., the amount of CH2O that remains for bunch DM production, initially increases as a function of LAI until it reaches its maximum. In this is at LAI = 5.6, as indicated by the vertical arrow. Above this LAI value, bunch dry matter production decreases, as interpalm competition becomes a limiting factor for total DM production.
To minimize the negative effect of closer spacing, Breure [Citation5] suggested to develop palm material with a rapid canopy expansion (low t0.95 value) that attains a lower maximum area of the individual leaves (Lmax), and hence stabilizes at a lower LAI. Bunch DM production of such material, when planted at a higher density, is less subjected to interpalm competition during later years.
1.4 Objectives and approach
The question whether palms with these favourable characteristics can be found in commercial planting material was investigated in an experiment with tenera progenies descending from pisifera male parents from different origins. Whereas most seed producers use solely Deli dura female parents, the relatively low number of pisifera male parents is usually from various origins. ASD (Costa Rica), a well-known supplier of oil palm seed, uses a broad range of distinct pisifera origins.
From the three ASD origins Ekona, Nigeria and Calabar, yield, leaf area and LAI were recorded c.q. calculated. LAI values derived from the logistic curves were used to estimate the optimal planting density, and, in particular, to verify the finding in Guatemala that Calabar can be planted at a density of 160 palms per ha (F. Peralta, Personal communication). To complement the use of LAI for defining optimal densities, LAI values were also used to estimate light interception for closed canopies (Phases 2 and 3). Finally, the study was also aimed at the General Combining Ability (GCA) values, i.e., the additive genotypic effects of the parent on the performances of the tenera offspring. Hence, for each individual pisifera male parent, GCA values were estimated for bunch yield and Lmax. Our aim was to explore the prospects for selecting individual pisifera male parents that combine a high GCA value for yield with a low GCA value for Lmax in Phase 3.
2 Materials and methods
2.1 Plant material
The present paper is based on yield and growth data from a set of 425 tenera progenies generated by ASD in Costa Rica from dura × pisifera crosses. The crosses involved 200 dura female parents, all of the Deli type, originating from various breeding programmes in South-East Asia, and 50 pisifera male parents from six distinct ASD origins [Citation8]. Here we focus on three origins referred to as Ekona, Nigeria and Calabar, represented by 10, 6, and 8 pisifera palms, respectively. The tenera progenies descending from these pisifera parents are regarded as being ASD's superior plant material.
The crossing scheme for generating the progenies was according to an alpha design [Citation9] with incomplete blocks. Each dura palm was pollinated by two (individual) pisifera palms, and each pisifera palm by nine (individual) dura palms. Not all crosses were realized, while seed of some crosses failed to germinate. The present study involved 84, 51 and 64 progenies for Ekona, Nigeria and Calabar, respectively. They were planted in South Sumatra in January 1997 in three replications with 16 palms per plot (48 palms per progeny) at a density of 135 palms per ha. Solar radiation at the experimental site is high and rainfall is about 2500 mm per year.
2.2 Data collection and processing
Fruit bunch yield per palm was recorded for 6 years, from the start of production in June 1999. During the first 8 years after field planting, the area of the first fully expanded youngest leaf was annually estimated according to the method of Hardon et al. [Citation10]. For each origin a logistic growth curve was fitted through the mean area values of the fully expanded youngest leaf of the sets of progenies descending from each individual pisifera male parent. The leaf area values of this curve were estimated as A/[1 + B × exp (−C × T)], where T = years after planting and A, B and C are constants. Logistic growth curves were also fitted through leaf area values of individual progenies. The asymptotically maximum leaf area attained (Lmax) and the time required to reach 95% of Lmax (t0.95) were estimated as described by Breure and Verdooren [Citation11].
Total leaf area per palm in a certain year was calculated as the product of the number of leaves and their mean area. The number of leaves was adopted from the report of Gerritsma and Soebagyo [Citation12], in which, as in the present study, the conventional standards of leaf pruning for estates in Indonesia were followed. Leaf pruning (to provide access to the fruit bunches at harvest) in their study resulted in a by and large linear decrease in number of leaves as a function of palm age, ranging from about 60 leaves per palm at 2 years after planting to a stable number of about 38 leaves for palms older than 12 years. As also found by Corley et al. [Citation2], there was no effect of planting density on the number of green leaves per palm in the range of densities used in the present study.
In oil palm, annual leaf production diminishes gradually from about 42 leaves in the second year after planting to about 22 leaves for palms older than 10 years. The total leaf area of the canopy at a certain time was, therefore, calculated from the mean area of the leaves produced in the previous 18 months (these area values were obtained from the logistic growth curves). For estimating the mean area of the canopy per year, the average values of the canopy area at the start and of the canopy area at the end of the year were calculated. Since mean annual leaf production per palm during the period 2–8 years after planting of the three origins was similar (26.4, 26.3 and 26.0 leaves per year for Ekona, Nigeria and Calabar, respectively), the same method of estimating total leaf area per palm was followed for each of the three origins.
Total leaf area per palm established at a planting density of 135 palms per ha was used to estimate mean LAI for the more commonly used standard density of 143 palms per ha. Only for Calabar, also the LAI for 160 palms per ha was estimated.
The extrapolations from 135 to 143 palms per ha and to 160 palms per ha may be justified up to a certain point, i.e., until the area of individual leaves approaches its final size in Phase 2, which under the conditions of the present study is about 10 years after planting. During this period, leaf area is only significantly lower in the 10th year if planting density is increased to 160 palms per ha [Citation13]. But as found by Breure [Citation5], there is a clear negative trend in Lmax with an increment from 110 to 186 palms per ha. So if planting density is increased from 135 to 143 palms per ha and to 160 palms per ha, one may infer that the total leaf area per palm would hardly decrease during Phase 1 and Phase 2, whereas Lmax would be proportionally reduced. In other words, LAI values based on Lmax at the actual density of 135 palms per ha are overestimated at the assumed higher densities of 143 and 160 palms per ha.
Finally, fractional light interception (f) for Phase 2 and Phase 3 (after canopy closure) was calculated from the LAI values, where f is the inverse of the amount of light penetrating through the canopy. Calculations were made according to an equation established by Squire [Citation14] using a mean extinction coefficient (k) of 0.37 for the years 6–8, 0.44 for the years 9–11 and 0.35 for the years 12–15, as found by Breure [Citation7] in commercial plantings in Papua New Guinea and Indonesia:For each of the 10, 6 and 8 individual pisifera parents of, respectively, the Ekona, Nigeria and Calabar origins, the General Combining Ability (GCA) values, i.e., its additive genotypic effect on the performance (in terms of bunch yield and Lmax) of the tenera offspring, were estimated. To calculate the GCA values a linear model was used as described by Breure and Verdooren [Citation11]. To obtain values representing the actual performance of their tenera offspring, the general mean, calculated across all tenera families derived from the dura × pisifera crosses, was added to the GCA values.
From these values for yield per palm, an inference was made about the gain in yield if palm material was assumed to be planted at a higher density of 160 palms per ha, as with Calabar.
3 Results
3.1 Recorded data
For each origin, the logistic growth curve fitted very well the leaf area data for the first 8 years when plotted against the number of years after planting (r2 ranging from 0.89 to 0.92; see ). During Phase 1, the trend in canopy expansion was similar for the three origins, although Nigeria attained a slightly higher leaf area than the two other origins.
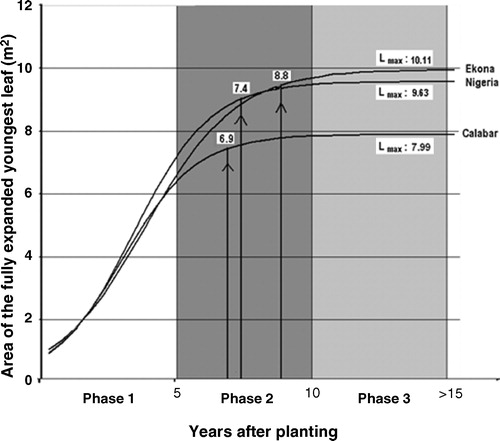
During Phase 2, the three origins reached 95% of maximum leaf area, which occurred 6.9 years after planting for Calabar, against 7.4 and 8.8 years for Nigeria and Ekona, respectively. Finally, Calabar attained an Lmax of only 7.99 m2 compared with 9.63 m2 for Nigeria and 10.11 m2 for Ekona.
Differences among the origins in mean Lmax and in mean leaf area, as presented in and , respectively, were highly significant.
Table 1 Mean maximum leaf area (Lmax) of the Ekona, Nigeria and Calabar origins planted at 135 palms per ha, along with the 95% confidence interval and level of statistical significance (p-value) of differences between origins.
Table 2 Mean leaf area (m2) of the Ekona, Nigeria and Calabar origins planted at 135 palms per ha, over the first 8 years after planting, along with the level of statistical significance (p-value) of differences between origins.
Whereas Lmax () and mean leaf area of Calabar () were both the lowest among the three origins, Lmax of Ekona was highest (10.11 m2) but mean leaf area was highest (6.24 m2) for Nigeria.
3.2 Calculated data and extrapolations
3.2.1 Leaf area index
shows the mean LAI values for the (estimated) density of 143 palms per ha, which is used more generally in commercial plantings than the actual density of 135 palms per ha used in the present study; the 95% confidence intervals are presented in . As a reference, in the optimal LAI range of 5.5–6.0 for maximum yield is indicated by a horizontal bar.
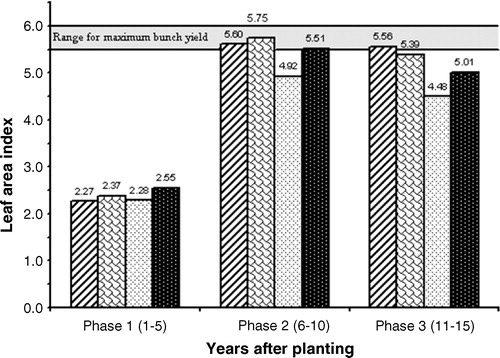
Table 3 Mean leaf area index (LAI) and 95% confidence Intervals of the means, during the three phases of canopy expansion, estimated for the origins Ekona, Nigeria and Calabar planted at a density of 143 palms per ha, and for Calabar* planted at 160 palms per ha.
As can be inferred from the logistic growth curves in , the three origins have by and large the same LAI in Phase 1. Note, however, that the LAI of Nigeria (2.37) was significantly higher than the LAI values of Calabar (2.28) and Ekona (2.27), as presented in and (for the statistical backing).
Table 4 Differences in leaf area index (LAI) of the origins Ekona and Nigeria vs. Calabar estimated for a density of 143 palms per ha, and vs. Calabar* estimated for 160 palms per ha, along with the level of statistical significance (p-value), during the three phases of canopy expansion.
In Phase 2, Nigeria as well as Ekona reached already the range of optimum LAI values for maximum yield. In contrast, Calabar did not even reach the generally accepted lower limit of 5.5 (within a 95% confidence interval of 4.79–5.05; see ).
More interesting may be the LAI pattern in Phase 3, when leaf size had reached its stable maximum. In this phase, the level of LAI influences the main period of mature bunch production (about 15 years compared with 5 years during Phase 2). For this reason, LAI during Phase 3 can be regarded as a reliable measure for establishing the optimum palm density for the type of planting material in a certain environment.
As shown in , the LAI values during Phase 3 were lower than those during Phase 2. The decline resulted from a lower number of leaves due to heavier leaf pruning needed for harvesting the bunches of the taller palms, along with a diminishing leaf production in Phase 3 [Citation12]. Still, the upper limit of the LAI's 95% confidence intervals of Nigeria and Ekona (5.56 and 5.69, respectively) falls within the optimum range. In contrast, the LAI of Calabar stabilizes below the level required for maximum yield per ha. To fully exploit its potential, Calabar should be planted at a higher density than the standard 143 palms per ha.
Let us now assume that the Calabar palms were planted at a density of 160 instead of 143 palms per ha. The numerical increase of 12% resulted in an increase in LAI from 4.48 to 5.01 in Phase 3 (). When comparing the LAI values of Phase 1, it is of interest to note that Calabar's LAI of 2.55 (at 160 palms per ha) is significantly higher than the LAI of the two other origins at 143 palms per ha (2.37 and 2.27 for Nigeria and Ekona, respectively; see ).
3.2.2 Light interception
shows per origin the percentage light interception by the oil palm canopy in Phase 2 and Phase 3. Clearly, light interception was higher in Phase 2 than in Phase 3, in spite of the more advanced age of the palms in Phase 3. Breure [Citation1] noted that two factors are responsible for the reduction in light interception during this phase: (1) leaf production in Phase 3 becomes lower, which together with heavier leaf pruning for harvesting the taller palms (see above), results in a lower LAI, and (2) at a given LAI level the fraction of intercepted light decreases. This decline in light interception (lower k values) can be attributed to a change in leaf angle in combination with more variation in palm height as a function of palm age. Both phenomena in the older palms lead to less mutual support among the leaves of neighbouring palms in Phase 3 than in Phase 2. Note that in Phase 2 the differences in light interception between the three origins were not statistically significant, but in Phase 3 Calabar (at 160 palms per ha) intercepted significantly less light than the two other origins ().
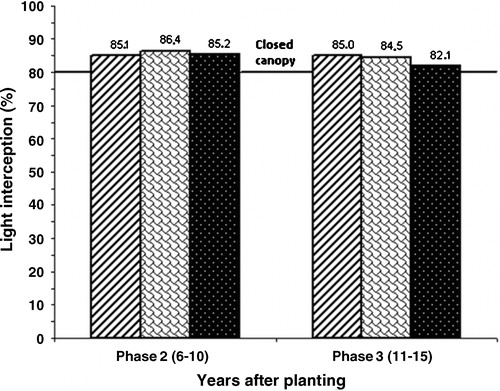
Table 5 Differences in percentage light interception between the origins Nigeria and Ekona, both estimated for 143 palms per ha, and of Ekona and Nigeria vs. Calabar* estimated for 160 palms per ha, along with the level of statistical significance (p-value), during Phases 2 and 3 of canopy expansion.
3.2.3 General Combining Ability
GCA values for Lmax of the pisifera palms ranged from 7.20 to 8.52 m2 for Calabar; from 9.05 to 11.49 m2 for Ekona; and from 8.59 to 10.32 m2 for Nigeria. Interestingly, these GCA values were not related to the corresponding GCA values for bunch yield. The relationship is even slightly negative (r = −0.36; statistically not significant) for the pisifera palms of the origin Nigeria ().
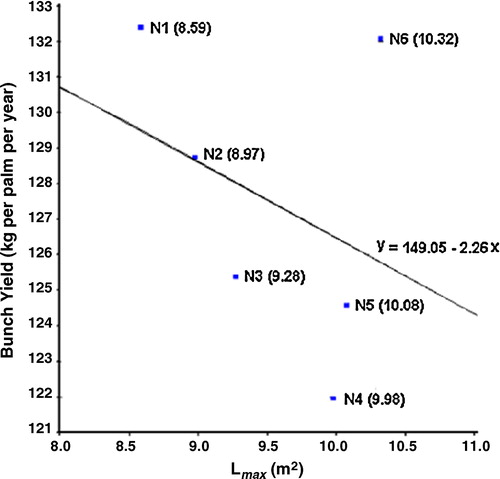
It is of particular interest that palm N1, with the highest GCA value for bunch yield of all palms, had the lowest GCA value for Lmax. On the other hand, palm N6 with a similar value for bunch yield had the highest Lmax value. Thus, selection for the most favourable combination of (high) bunch yield and (low) Lmax appears feasible.
4 Discussion
4.1 Leaf area
The present study shows that it is useful to calculate logistic growth curves that estimate the area of individual leaves during the entire lifespan of an oil palm planting. The curves reliably depict the leaf area during the period of mature canopy size (Lmax) as well as the rate of increase until this maximum is reached.
Mean leaf area values during the first 8 years after planting () reveal statistically significant differences among the three origins, but comparative data patterns of the origins appear to be a poor indicator of the leaf area of an origin at mature canopy size (Lmax in ). Two discrepancies between both measurements are obvious. First, the ranking orders of leaf area and Lmax are dissimilar (Nigeria (1), Ekona (2), Calabar (3) compared with Ekona (1), Nigeria (2), Calabar (3), respectively). Second, the mean leaf area values of Calabar (5.51 m2) and Ekona (5.97 m2) did not reflect the pronounced range in Lmax values of both origins (7.99–10.11 m2, respectively). An extra advantage over the more traditional data on mean leaf area is that the fitting of a reliable logistic curve requires only five data points (mean leaf area values of individual progenies per origin) to be collected at about 6, 12, 42, 66 and 90 months after planting, which is before the canopy reaches its maximum size [Citation11].
Breure (in preparation) calculated the 95% confidence intervals of Lmax for various sample sizes. As could be anticipated, a number of 30 progenies per origin, involving five pisifera, would be sufficient for statistical backing when comparing the three origins under study. Furthermore, by adopting a value of 38 leaves per palm at mature canopy size, along with Lmax, a reliable estimate can be obtained for LAI and, hence, for optimal planting density of palm material in a certain environment.
4.2 Optimal leaf area index
If one accepts the basic assumption of our study that an optimal LAI value for maximum yield lies between 5.5 and 6.0, it is evident that the tenera offspring of Calabar pisifera palms can be planted at a density of at least 160 palms per ha. In contrast, the origins Nigeria and Ekona should preferably not be planted beyond a density of 143 palms per ha.
Corley and Tinker [Citation15] pointed out that yield per palm during the first years of production may be more or less the same up to relatively high planting densities. More recently, Nazeeb et al. [Citation16] found that an increase in density from 143 to 160 palms per ha – for the standard palm material of their experiments – did not affect the yield per palm during the first 4 years of production. It is likely that for Calabar palms the same holds for an even longer period. This assumption is based on two factors: (1) shortly after canopy closure the new leaves of Calabar stop expanding, and (2) Lmax as a function of planting density decreases [Citation5]. As a consequence, the LAI value of Calabar, as estimated at mature canopy size, is expected to be lower than the value presented in . So we can reasonably conclude that an increase in density from 143 to 160 palms per ha will raise Calabar's annual bunch yield per ha by 12% during at least the first 5–6 years of production.
The superiority of the Calabar origin planted at the higher density can be indirectly derived from a recent study of Breure [Citation8], in which GCA values of pisifera male parents were obtained at a density of 135 palms per ha. During the first 5 years of bunch production the mean (adjusted) GCA values for bunch yield of the pisifera parents were 119 kg per palm for Calabar compared with 127 and 121 for Nigeria and Ekona, respectively. With a planting density increase from 143 to 160 palms per ha compared with a standard density of 143 palms per ha for the two other origins, Calabar is expected to produce annually 5% more than Nigeria and 10% more than Ekona.
In later years, the production of individual palms of the Calabar origin (at the higher density of 160 palms per ha) is expected to be somewhat less than in the study of Breure [Citation8]. But then the lower yield per palm is likely to be more than compensated for by the additional 25 palms per ha. Some support can be derived from the suboptimal LAI (5.01) estimated in the present study in Phase 3, considering that the optimal LAI for maximal yield lies between 5.5 and 6.0.
It is of interest to note that after canopy closure (Phase 2), in spite of the higher density, the LAI of Calabar does not exceed the LAI's of the two other origins. This outcome reflects a better light penetration of the canopy of the Calabar palms. Improved light penetration at this stage benefits the vegetation underneath the palms, reducing erosion and excessive surface run-off, as pointed out by Breure [Citation1].
4.3 General Combining Ability
The analysis of GCA values was fruitful. In particular, the inverse relationship between bunch yield and Lmax, as found for the Nigeria pisifera palms, which offers the possibility to select male parents that combine a low GCA for Lmax with a high GCA for yield potential. Palm material descending from such pisifera parents is particularly suitable for increasing yield per ha through planting at a high density. By cloning these pisifera parents – which is now feasible in oil palm – planting material with this desirable combination of traits can be produced on a large scale.
The favourable combination of a high bunch yield with a low Lmax value encourages us to proceed with improving the bunch yield per unit light-intercepting leaf surface. The prospects of this strategy have already been demonstrated by the development of compact palms [Citation17,Citation18]. ASD's compact pisifera and pisifera from sources identified in this study, such as Calabar, will soon be tested at the new seed garden project of PT Bakrie Sumatera Plantations in North Sumatra. To identify pisifera palms with high GCA values for yield per ha, the test cross families will be planted at densities of 135 and 160 palms per ha.
5 Conclusions
Fruit bunch production in oil palm starts at about 2.5 years after planting, which is well before the canopy reaches its maximum when the palms are 10 years old. Optimal planting density for maximum annual yield per ha decreases during the period of canopy expansion. Since the economic life of an oil palm plantation is about 25 years, a reliable estimate of optimal planting density is specially needed for the period of mature canopy size.
An earlier study [Citation5] revealed that leaf area values plotted against the number of years after planting fit a logistic growth curve. The maximum leaf area (Lmax), and the time to attain 95% of this maximum (t0.95), can be reliably inferred from this curve. The present study showed that oil palm progenies descending from three pisifera male parent origins, Ekona, Nigeria and Calabar, markedly differ in rate of leaf expansion and in Lmax. The study further revealed that for each origin the mean leaf area measured during the first 8 years after planting appears to be an inaccurate indicator of the Lmax value. Since a reliable estimate of mean leaf area values at mature canopy size requires (leaf) measurements over a longer period, Lmax is more suitable for estimating the optimal planting density than the conventional method based on mean leaf area.
Leaf area index (LAI) values were calculated from the estimated leaf area values of the logistic growth curves at a standard density of 143 palms per ha. Under the assumption that optimal bunch yield per ha is attained if LAI ranges between 5.5 and 6.0, it is concluded that 143 palms per ha is the correct planting density for Ekona and Nigeria. But the optimal density of the Calabar origin should be increased to at least 160 per ha.
The estimated General Combining Ability (GCA) values for Lmax of the individual pisifera palms of the three origins were not related to the GCA values for bunch yield of the same palms. The relationship was even slightly negative for the pisifera of the Nigeria origin. Such an inverse relationship paves the way to select pisifera male parents that combine high GCA values for bunch yield with low GCA values for Lmax and, hence, to generate planting material that is suitable for planting at high densities.
Acknowledgements
The permission of PT Selapan Jaya to publish the results and the assistance of the staff of Bina Sawit Makmur in the collection and processing of the data is gratefully acknowledged. We wish to thank I. Bos, I.E. Henson and P.G.J. Keuss for their helpful comments on an earlier version of the paper and L.R. Verdooren for his assistance with the statistical analysis of the data.
References
- C.J.BreureThe search for yield in oil palm: basic principlesT.H.FairhurstR.HärdterThe Oil Palm, Management for Large and Sustainable Yields2003Potash & Phosphate Institute (PPI), Potash & Phosphate Institute of Canada (PPIC) and International Potash Institute (IPI)5998
- R.H.V.CorleyC.K.Hew.K.TamK.K.LoOptimal spacing for oil palmsR.L.WastieD.A.EarpAdvances in oil palm cultivation1973Incorp. Soc. PlantersKuala Lumpur5271
- B.G.SmithC.R.DonoughR.H.V.CorleyRelationship between oil palm clone phenotype and optimal densityD.AriffinProceedings of the 1996 PORIM Int. Palm Congr. Competitiveness for the 21st centuryPalm Oil Res. Inst. Malaysia, Kuala Lumpur(1996) 76–86.
- R.H.V.CorleyC.J.BreureFruiting activity, growth and yield of oil palm. I. Effects of fruit removalExperimental Agriculture28199299109
- C.J.BreureRelevant factors associated with crown expansion in oil palm (Elaeis guineensis Jacq.)Euphytica341985161175
- H.Von UexküllI.E.HensonT.FairhurstCanopy management to optimize yieldT.H.FairhurstR.HärdterThe Oil Palm, Management for Large and Sustainable Yields2003Potash & Phosphate Institute (PPI), Potash & Phosphate Institute of Canada (PPIC) and International Potash Institute (IPI)163180
- C.J.BreureThe effect of palm age and planting density on the partitioning of assimilates in oil palm (Elaeis guineensis Jacq.)Experimental Agriculture2419885366
- C.J.BreurePerformance of ASD's oil palm parent material in South Sumatra: the search for elite planting material for IndonesiaASD Oil Palm Papers2920061930
- H.D.PattersonE.H.WilliamsE.A.HunterBlock designs for variety trialsJournal of Agricultural Science, Cambridge901978395400
- J.J.HardonC.N.WilliamsI.WatsonLeaf area and yield in the oil palm in MalaysiaExperimental Agriculture519692532
- C.J.BreureL.R.VerdoorenGuidelines for testing and selecting parent palms in oil palm. Practical aspects and statistical methodsASD Oil Palm Papers91995168
- W.GerritsmaF.X.SoebagyoAnalysis of the growth of leaf area of oil palm in IndonesiaExperimental Agriculture351999293308
- C.J.BreureFactors affecting yield and growth of oil palm tenera in West New BritainOléagineux371982213227
- G.R.SquireLight Interception, Productivity and Yield of Oil Palm1984Palm Oil Research Institute of MalaysiaKuala Lumpurpp. 73
- R.H.V.CorleyP.B.TinkerThe Oil Palm4th ed.2003Blackwell Science Ltd.
- M.NazeebM.K.TangS.G.LoongS.B.SyedVariable density plantings for oil Palms (Elaeis guineensis) in Peninsular MalaysiaProceedings of the PIPOC 2007 International Palm Oil Congress—Agriculture2007127167
- R.EscobarA.AlvaradoStrategies in production of oil palm compact clones and seedsProceedings of Agriculture Conference, PIPOC 2003, MPOB International Palm Oil Congress24–28 September(2003) 75–91.
- A.AlvaradoR.EscobarF.PeraltaC.ChinchillaCompact Seeds and Clones and their Potential for High Density PlantingInternational Seminar on Yield Potential in the Oil PalmThe International Society for Oil Palm Breeders (ISOPB), Phuket, Thailand, 27–28 November(2006) 10.