
Highlights
| • | We calculated energy use and greenhouse gas emissions in Dutch organic and conventional farming systems. | ||||
| • | Energy use and greenhouse gas emissions per unit milk in organic dairy are approximately 25% and 5-10% lower than in conventional dairy. | ||||
| • | Energy use per unit crop produce in organic arable farming is 10-30% and in organic vegetable farming 40-50% higher than in its conventional counterpart. | ||||
| • | Greenhouse gas emissions per unit crop produce in organic arable and vegetable farming are 0-15% and 35-40% higher. | ||||
| • | To reduce energy use and greenhouse gas emissions related to food production, choices on food package composition are more relevant than the choice between organic or conventional farming. | ||||
Abstract
Organic agriculture is often considered to contribute to reducing energy use and greenhouse gas (GHG) emissions, also on a per unit product basis. For energy, this is supported by a large number of studies, but the body of evidence for GHGs is smaller. Dutch agriculture is characterized by relatively intensive land use in both organic and conventional farming, which may affect their performance in terms of energy use and GHG emissions. This paper presents results of a model study on energy use and GHG emissions in Dutch organic and conventional farming systems. Energy use per unit milk in organic dairy is approximately 25% lower than in conventional dairy, while GHG emissions are 5-10% lower. Contrary to dairy farming, energy use and GHG emissions in organic crop production are higher than in conventional crop production. Energy use in organic arable farming is 10-30% and in organic vegetable farming 40-50% higher than in their respective conventional counterparts. GHG emissions in organic arable and vegetable farming are 0-15% and 35-40% higher, respectively. Our results correspond with other studies for dairy farming, but not for crop production. The most likely cause for higher energy use and GHG emissions in Dutch organic crop production is its high intensity level, which is expressed in crop rotations with a large share of high-value crops, relatively high fertiliser inputs and frequent field operations related to weeding.
1 Introduction
Two of the most pressing sustainability issues are the depletion of fossil energy resources and the emission of atmospheric greenhouse gases (GHGs) carbon dioxide (CO2), methane (CH4) and nitrous oxide (N2O) to the atmosphere. Agriculture consumes fossil energy and hence contributes to the depletion of fossil energy resources as well as to the emission of CO2. With a share of 4.3% in the national total, direct energy use (i.e. on farm use of electricity and fuels for heating and machinery, including natural gas combustion in the greenhouse sector) in the Netherlands is relatively small [Citation1]. However, indirect energy use in agriculture, i.e. energy use associated with the production of inputs and storage, transport and processing of outputs, is not included in this figure. Total direct and indirect energy use in the entire Dutch agro-food complex is not reported in statistics and estimates are not available.
Agriculture is both a sink and a source of atmospheric GHGs. Agriculture assimilates atmospheric CO2 via crop production, part of which may be temporarily stored as organic matter in soils or used as a renewable energy source. Agriculture emits CO2 by using fossil energy and through oxidation of soil organic matter. Nitrous oxide emits during storage and application of fertilizers and manures and CH4 is a by-product of enteric fermentation in ruminant farm animals. In 2007, on farm emissions of N2O and CH4 in Dutch agriculture contributed 41 and 53% to the national total emissions of these two GHGs, and 7.5% to the national total emission of CO2-equivalents [Citation2]. As for energy, however, this estimate excludes all indirect emissions and CO2 emissions from fuel combustion in agriculture. Formal estimates of all direct and indirect emissions of CO2, CH4 and N2O caused by Dutch agriculture are lacking.
Organic agriculture is often considered to contribute to reducing energy use and GHG emissions, both on a per unit area basis as well as on per unit product basis. For energy, this is supported by a relatively large number of studies [3–9Citation[3]Citation[4]Citation[5]Citation[6]Citation[7]Citation[8]Citation[9]]. The body of evidence for GHGs is smaller [Citation4,Citation5,Citation7,Citation8,Citation10], with some studies indicating not much differences between organic and conventional in terms of GHG emissions per unit product or organic suggested performing worse [Citation11].
Energy use and GHG emissions per ha in organic farming are often considerably lower than in conventional farming, which can be attributed to lower input use per ha in organic farming. However, energy use and GHG emissions per ha are inappropriate indicators for an environmental impact with global dimensions. In this case, more legitimate indicators are energy use and GHG emissions per unit product. Because of generally lower yields per ha in organic farming [Citation12], differences in energy use and GHG emissions per unit product between organic and conventional farming systems will be smaller than when expressed per unit area [Citation4,Citation13].
Due to high prices of labour and land, Dutch agriculture is characterized by relatively intensive land use in both organic and conventional farming [14–16Citation[14]Citation[15]Citation[16]]. This is expressed in many aspects of Dutch organic and conventional agriculture, including the adoption of crop rotations with a large share of high-value crops such as potatoes and vegetables, high animal stocking rates, the use of relatively high levels of external inputs such as feeds and fertilisers and weak links between animal production and crop production in terms of size and exchange of (by-) products [Citation14]. With reference to the values of organic agriculture, De Wit and Verhoog [Citation14] argue that Dutch organic agriculture shows signs of ‘conventionalization’. In the process of conventionalization, organic farming develops toward a slightly modified version of modern conventional agriculture, in which economies of scale become increasingly important and farms increasingly rely on purchased off-farm inputs such as feeds, fertilizers and machinery. Such development might possibly have negative effects on issues like energy use, nutrient losses and recycling, all of which are core values of the organic farming community [Citation14]. The question thus is whether in the Dutch context of intensive farming practices energy use and GHG emissions are different in organic and conventional farming systems. Based on earlier work [Citation17], this paper presents results of a model study on energy use and GHG emissions in current Dutch organic and conventional farming practice, covering dairy farming, arable farming and field grown vegetables. The farming systems for which energy use and GHG emissions are quantified may be representative for intensified organic and conventional farming systems in densely populated regions elsewhere in Europe.
2 Methodology
2.1 Methodological considerations
When comparing organic and conventional farming, definition of the farming systems is critical [Citation11,Citation18]. Results of a study comparing a ‘perfect’ organic farming system (e.g., without imports of fertilizers and feeds, use of fertility building crops, high internal efficiencies) and a ‘dirty’ conventional system (e.g., standard fertilizations and sprayings, no catch crops, low internal efficiencies) will be different from those of a study comparing the opposite situation. Results may also be strongly influenced by the agricultural products that are part of the analysis. These may be products for which differences in yield per ha between organic and conventional are relatively small (e.g. grains, pulses, grass-clover), but it may also involve crops with larger yield differences such as potato Solanum tuberosum L. or vegetables [Citation13]. Therefore, conclusions for one set of agricultural products may not hold for another. Ideally, the farming systems that are to be compared should produce the same products in equal ratios, i.e. the ratio of potatoes, white cabbage and milk produced within the organic farming system should match the ratio in the conventional farming system. While this may be hard to realize even in model studies, some degree of equality in the organic and conventional product sets (‘food packages’) that are to be compared is indispensible to avoid comparing apples and oranges.
2.2 Definition of model farms
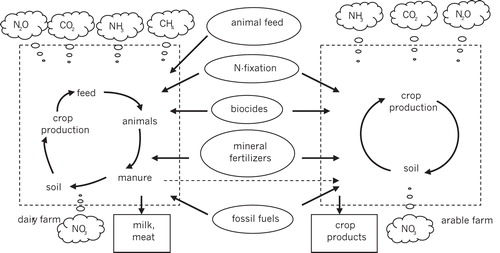
This study quantifies direct (on farm) and indirect (upstream) energy use and GHG emissions resulting from agricultural production (). Energy use and emissions occurring downstream, i.e. after products leave the farm gate, have not been taken into account, with the exception of GHG emissions associated with N losses from the farming systems. Energy use and GHG emissions were quantified for farming systems reflecting current Dutch organic and conventional farming practice. In the Netherlands, most farms, whether organic or conventional, are specialized farms, producing either milk, arable crops or vegetable crops.
To cover the dairy farming sector, eight organic and six conventional specialized model dairy farms on sand and clay soils were defined [Citation17]. In this paper only the results for four organic and three conventional model dairy farms on sandy soil are presented (), did not yield additional insights. Definitions of dairy model farms were based on model farms used in earlier studies [Citation19,Citation20]. Feed crops cultivated include grass and maize Zea mays L. on the conventional dairy farms and grass/clover mixtures and maize on the organic dairy farms. Farms were classified as ‘intensive’, ‘average’ or ‘extensive’ on the basis of pre-defined milk production per ha feed crops, covering the range in intensities found in practice. On all dairy model farms, stable types were slurry-based, except the extensive organic farms for which a slurry-based stable and a deep pit stable were defined. The definition of the model farms is such that the organic dairy farms were less intensive in terms of milk production per ha, used less concentrates per cow and applied more grazing than the conventional farms (), again reflecting current practice. The intensive and average conventional farms and the intensive organic farm exported part of their slurry.
Table 1 Characteristics of organic and conventional model dairy farms on sandy soils. Farms are classified as ‘intensive’, ‘average’ or ‘extensive’ on the basis of pre-defined milk production per ha feed crops, covering the range in intensities found in practice.
To cover the arable and vegetable farming sectors, four model farms were defined, based on farming systems research over the past years [21–24Citation[21]Citation[22]Citation[23]Citation[24]]: one organic and one conventional arable farm on clay soil (both growing potato, sugar beet Beta vulgaris L., wheat Triticum aestivum L., carrot Daucus carota L., onion Allium cepa L. and pea Pisum sativum L.) and one organic and one conventional vegetable farm on sandy soil (leek Allium porrum L., bean Phaseolus vulgaris L., carrot, strawberry Fragaria L., head lettuce Lactuca sativa L. and Chinese cabbage Brassica pekinensis L.). Rotations in the two pairs of farms were similar, but not entirely equal (). Rotation length was four years on the conventional arable farm and six years on all other model farms. Standard crop yields were assumed. For conventional crops, these yields are 5-year averages as based on routinely sampling of data from a representative selection of agricultural holdings [Citation25]. For organic crops, yields were based on organic farming systems research, summarised by Wijnands & Holwerda [Citation26]. On the conventional farms, nutrient management is based on pig slurry and mineral fertilizers. Per ha on the conventional arable farm, 16 Mg pig slurry is applied in late summer, partly combined with catch crop cultivation. On the conventional vegetable farm, 15 Mg per ha pig slurry is applied in spring. Nutrient management on the organic farms was based on cattle slurry, solid cattle manure and vinasse, a by-product of the sugar beet industry containing readily available N. Spring applied fertilizer doses per ha on the organic arable farm are 16 Mg solid cattle manure, 4 Mg cattle slurry and 1.1 Mg vinasse. On the organic vegetable farm these doses are 11, 10 and 2.6 Mg, respectively, also applied in spring. Fertilizer rates in terms of total-N and plant available N are hardly different between organic and conventional crop production, especially in vegetables (). This is one of the indicators of the relatively high intensity of organic crop production in the Netherlands.
Table 2 Crop rotations and crop yields on the organic and conventional model crop farms on clay and sandy soils.
2.3 Models
A farm system is a complex system made up of several interacting subsystems such as livestock, manure, soil and crops. We used models to integrate the technical and environmental aspects of all major farm processes (i.e. feed and fertilizer imports, crop management and food and feed production, animal nutrition and production, manure production and utilization, and crop, milk and meat exports). Energy use and GHG emissions for all model farms were quantified using the model DairyWise [Citation27,Citation28] for the dairy model farms, and an extended version of the BEA Model [Citation29,Citation30] for the arable and vegetable model farms. Both models account for direct and indirect energy use and GHG emissions and assume no net accumulation or depletion of soil C stocks and management according to good agricultural practice.
2.4 Quantification of energy use
Direct energy use is mainly fuel and electricity use. Fuel use was calculated from the farm and field operations. Electricity is mainly used for milking, heating water, cooling milk, ventilation and storage of crop products. Energy use for drying was not taken into account. Indirect energy use is associated with the production of imported resources: purchased goods (e.g. fertilizers, manure, concentrates, silage, planting material), services (e.g. contractors) and buildings and machinery. All purchased goods have energy coefficients per item, whereas services, buildings and machinery have energy coefficients based on their financial value or weight (). For the crop production model farms, energy use associated with buildings was not considered. Separate energy coefficients were used for concentrates in organic and conventional dairy farming (personal communication M. Thomassen, Animal Sciences Group, Wageningen University and Research Centre), acknowledging different compositions as well as different origins of the ingredients.
Table 3 Energy coefficients of fossil fuels, electricity, purchased goods, buildings and machinery.
2.5 Quantification of greenhouse gas emissions
GHG emissions were in principle calculated with emission factors according to those used in Dutch emission inventories [Citation27,Citation28,Citation33]; (http://www.greenhousegases.nl;/ ). In case these are inadequate for farm level calculations, more detailed emission factors were used according to [Citation36]. Methane emissions were calculated from manure storage and from enteric fermentation, the latter with different emission factors for concentrates, grass products and maize silage. Direct N2O emissions were coupled to manure management, excreted N during grazing, manure application, fertiliser use, crop residues and grassland renewal. Indirect N2O emissions are associated with the production of inputs or N losses from the farming system (NO3, NH3 and NOx). Carbon dioxide emissions were related to the fossil fuel based energy use. Different emission factors were used for the categories fuel consumption, electricity use and different forms of indirect energy use (). Emissions of CO2, CH4 and N2O are summed in terms of their 100-year global warming potentials (CO2-equivalents), i.e. 21 for methane and 310 for nitrous oxide [Citation37].
Table 4 Greenhouse gas emission coefficients.
3 Results
3.1 Energy use
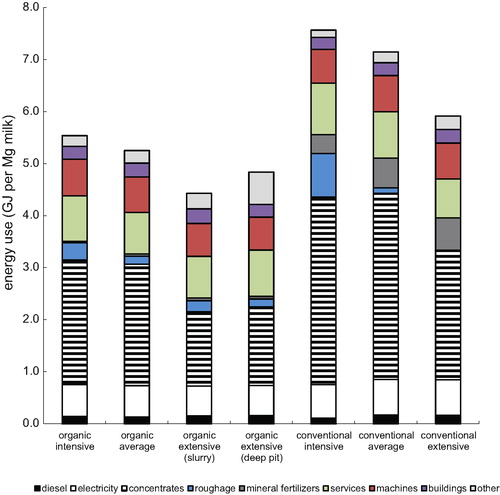
Total energy use ranged between 4.4 and 5.5 GJ per Mg milk on the organic dairy farms and between 5.9 and 7.6 GJ per Mg milk on the conventional farms (). Both across all farms and within the two groups, energy use per Mg milk tended to increase with farm intensity. However, whilst producing a similar amount of milk per ha, energy use on the intensive organic dairy farm was 23% less than that on the average conventional farm, and 6% less than energy use on the extensive conventional farm, the latter producing less milk per ha. Likewise, with similar milk production per ha, energy use on the average organic farm was 11% lower than on the extensive conventional farm. If we take average energy use in organic and conventional dairy farming as the average of one intensive, one average and one extensive farm per group, energy use was 5.1 GJ per Mg milk in organic and 6.9 GJ per Mg milk in conventional. If the model farms would perfectly represent commercial milk production in practice, production of 1 Mg organic milk in the Netherlands would hence require 26% less energy than production of the same amount as conventional milk. Lower energy use on the organic farms can be explained by lower use of imported concentrates and non use of mineral fertilizers (). On all farms, the use of concentrates contributed most to total energy use. On intensive and average farms, both organic and conventional, the proportion was approximately 45%. Other major contributors to energy use were services, electricity and machinery. Diesel use, buildings and imports of roughage and fertilizers accounted for only a small proportion of total energy use.
In crop production, energy use per unit crop produced varied considerably among crops ( and ). Energy use in growing organic sugar beet and pea was lower than in the corresponding conventional crops. For all other crops, energy use in organic crop production was higher. Higher energy use per unit crop produce in organic crop production can largely be explained by lower yields per ha which are only partly compensated by lower input use per ha. For example, diesel use per ha in organic crops was in eight out of twelve cases higher than in conventional crops (data not shown), mainly resulting from mechanical weeding activities. In organic carrots, onions and potatoes an additional fossil fuel, propane, was used for flaming weeds and burning haulm. On the arable farms, electricity use for storage of onion, carrot and potato consumed about 40% of the total energy consumption at farm level and the use of diesel approximately 30% (). On both vegetable farms, the most important items were energy use associated with the purchase of planting material and the use of diesel (both items about 30%; ).
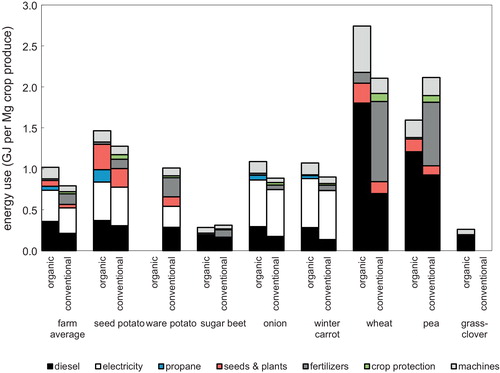
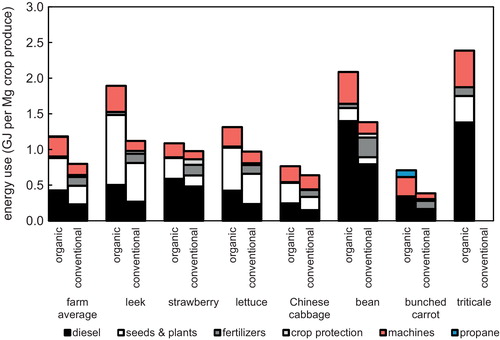
Calculating energy use at farm level as total energy use divided by total crop yield, energy use on the organic arable and vegetable farm was 30 and 50% higher, respectively, than on its conventional counterpart ( and ). Calculating the difference between organic and conventional as the average of differences between pairs of crops, energy use in organic arable cropping was 9% higher, and in organic vegetable cropping 43% higher.
3.2 Greenhouse gas emissions
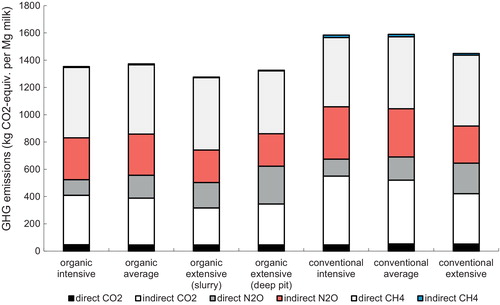
Nitrous oxide emissions on the dairy farms ranged from 0.87 to 1.07 kg per Mg milk. Farms with similar intensity produced similar direct N2O-N emissions per Mg milk (, N2O-N emissions expressed as CO2 equivalents). These emissions increased with decreasing intensity, mainly caused by higher grazing intensity on the average and extensive farms, a factor promoting N2O-N loss. Unlike direct N2O-N emissions, indirect emissions per Mg milk decreased with decreasing intensity, caused by the lower reliance on external inputs, especially concentrates, and on the conventional farms, mineral N-fertilizer. Because of this, indirect N2O-N emissions per Mg milk were approximately 10-20% lower on the organic dairy farms. Combining direct and indirect N2O-N emissions, organic dairy farms generated about 10-15% lower emissions per Mg milk. However, an exception was the organic extensive farm with deep pit stable. Manure storage conditions in this type of stable resulted in relatively large N2O-N emissions (), causing direct N2O-N emission on this farm to be the highest of all farms. Methane emission per Mg milk was similar across all farms, amounting to 25 kg CH4 (). This emission was similar, because feed intake per Mg milk, the main determinant of CH4 emission, was practically the same on all farms. Since CO2 emissions quantified in this study were all related to fossil energy use, differences in CO2 emissions between organic and conventional dairy farms resembled those of energy use. Hence, CO2 emissions per Mg milk were lower on the organic farms due to reduced use of mineral fertilizers and concentrates (). Combining the emissions of all three GHGs in terms of CO2-equivalents per Mg milk (), yields a difference of 5-12% between organic and conventional farms, depending on which pairs of farms are compared. For example, with similar milk production per ha, the emission of CO2-equivalents on the organic intensive farm was 12% lower than on the conventional average farm. However, emission on the organic average farm was only 5% lower than on the conventional extensive farm, despite milk production per ha again being similar. For all farms, relative contributions of CO2, N2O-N and CH4 to total GHG emission were about equal (), each contributing about one third to the total.
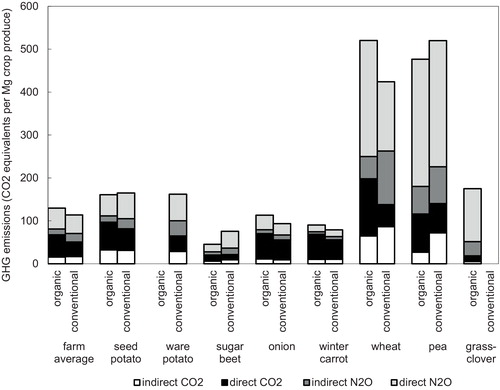
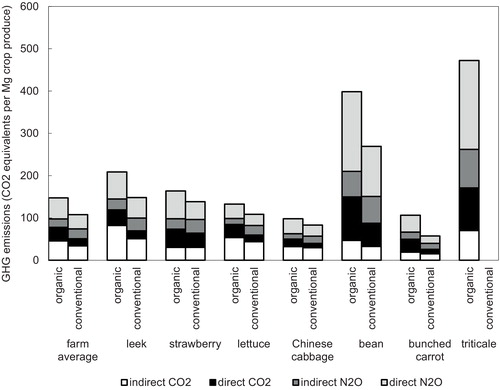
As for energy, GHG emissions in crop production varied considerably among crops, ranging between 45 (organic sugar beet) and 520 (organic wheat, conventional pea) kg CO2 equivalents per Mg crop produce ( and ). In general, GHG emissions were high for leguminous crops and crops with high nutrient requirements and low yields. On all farms, about 40% of the emissions was as CO2 associated with energy use, and 60% was as N2O. Direct N2O emissions, i.e. those resulting from on farm fertilizer applications and incorporation of crop residues, were generally more important than indirect N2O emissions. Direct CO2 emission per unit crop produce in most organic crops was considerably higher than in their conventional counterparts ( and ). This can be traced back to the higher use of diesel in organic crops for mechanical weeding and/or flaming of weeds and potato haulm using propane. Only for organically grown crops sugar beet and pea, total GHG emissions were lower than for conventional ones, for all others emissions were higher. On the organic arable farm, total emission of CO2-equivalents divided by total crop yield was 15% higher than on its conventional counterpart (). For the organic vegetable farm this was 40% (). Calculating the difference in total GHG emissions between organic and conventional as the average of differences between crop pairs, GHG emission on the organic arable farm equals that of conventional, and on the organic vegetable farm is 35% higher.
4 Discussion
We have quantified energy use and GHG emissions for standardized organic and conventional model farms. Results indicate that energy use per unit milk in organic dairy farming is approximately 25% lower than that in conventional dairy farming, and GHG emission 5-12% lower. Differences between organic and conventional crop production depend on the way in which these are calculated. If differences in energy use are calculated as total energy use divided by total crop yield, energy use per unit product is 30% higher in organic arable crop production and 50% higher in organic vegetable crop production, relative to their conventional counterparts. Similar calculations for GHG emissions per unit product yielded 15 and 40% higher emission in organic arable and vegetable crop production, respectively. Calculating differences between organic and conventional as the average of differences between crop pairs, yields different percentage differences. Calculated in this way, energy use in organic arable is 9% higher than in conventional, and in organic vegetable cropping 43% higher. The corresponding percentage for GHG emission in organic vegetable production is 35%, whilst organic arable scores equal to conventional.
While we have used the ‘best available knowledge’, our results carry uncertainty arising from the many assumptions that have been made in the model calculations, for example regarding farm management (intensity use of inputs and machinery) and coefficients for energy use and GHG emissions. In comparative studies such as these, accuracy in model parameters is especially desirable in aspects where organic and conventional farming differ. One major difference between conventional and organic farming is the greater reliance on organic N sources in the latter, notably organic N derived from animal manures and leguminous crops. Due to the greater reliance on organic N sources, N dynamics in organic farming systems may be different from those in conventional farming systems, which can be judged on the basis of, e.g., differences in the (relative) sizes of mineral versus organic N stocks and flows at any one time. As emission factors used in this study for quantification of nitrous oxide emissions have primarily been derived from experiments in a conventional farming system context, they may be less valid for organic farming systems. This adds to the uncertainty of nitrous oxide emissions quantified for organic farming systems, but our current understanding of these emissions is too fragmented to judge how emission factors should be adapted to better reflect conditions in organic farming. Apart from nitrous oxide emissions, we anticipate the accuracy and uncertainty of our results for organic and conventional farming systems to be similar, because the organic and conventional data around which we built our case carry uncertainties of a similar order of magnitude.
Thomassen et al. [Citation5] reported energy use in Dutch organic and conventional dairy farming of 3.1 and 5.0 GJ per Mg milk, respectively. These results correspond with this study in finding a lower energy use in organic farming. However, the study differs from this one in reporting a considerably lower energy use in both organic and conventional dairy farming and in finding a larger difference (40%). The reasons behind these differences may be manifold, including methodological differences, such as the definition of farms and model parameters used. One methodological difference between this study and the study by Thomassen et al. [Citation5] is that the latter is based on data collected from 10 conventional and 11 organic commercial dairy farms. Thomassen et al. [Citation5] also excluded energy use for seeds, machinery and buildings and allocated approximately 10% of total energy use to farm products other than milk, partly explaining the lower energy use per unit milk. Similar to [Citation5], also other studies [Citation6,Citation7,Citation38] show considerably lower energy use than quantified in this study, and larger differences between organic and conventional.
For crop production, there are fewer studies that are directly comparable with this one, i.e. considering entire crop rotations in a whole farm system context. Studies that have been done often report energy use at crop level, mostly in the context of relatively extensive arable crop rotations dominated by grain crops, legumes and/or roughage crops. The majority of these studies conclude that energy use per unit output is similar [Citation39,Citation40] or lower [11,41–43Citation[11]Citation[41]Citation[42]Citation[43]] in organic. However, if larger proportions of organic crop rotations are devoted to non-harvested fertility building crops, energy use per unit output increases to values beyond those in conventional crop rotations [Citation11,Citation40]. Linking results of the aforementioned studies to our results is complicated, as, besides methodological differences, these are strongly influenced by the type of crop rotations considered, site-specific environmental conditions and intensity level. There may be two general causes for higher energy use in organic crop production, as found in this study, deviating from most other studies. A first cause may be the high intensity level of Dutch organic cropping systems, characterized by a large share of high-value crops in rotations, relatively high levels of fertiliser use and frequent field operations related to weeding activities. A second cause may be larger yield differences between conventional and organic crop production in this study, as conventional yields of grain crops in the Netherlands are 10-20% higher than conventional yields of these crops in neighbouring countries (personal communication, W. van Dijk, Plant Sciences Group, Wageningen University and Research Centre). Whether also conventional vegetable yields in the Netherlands are higher than in neighbouring countries is unknown.
There are only few comparative whole-farm studies in which GHG emissions in conventional and organic farming systems are calculated or measured. These studies have in common that differences in GHG emissions per unit product between organic and conventional are either absent [Citation5,Citation10] or rather small [Citation7,Citation41,Citation44,Citation45]. Owing to a lack of a large body of direct measurements of GHG emissions and the methodological difficulties associated with that, there is probably still much to learn about the size of GHG emissions before firm conclusions about differences in these emissions between conventional and organic farming systems can be drawn.
When discussing energy use and GHG emissions in organic and conventional farming systems, one cannot ignore the issue of land area requirement for both types of production, especially in a context of a growing world population and increasing food, feed and bio-energy demands. It is generally accepted that organic agriculture requires more land than conventional [Citation13,Citation18,Citation39]. Hence, the land spared in conventional farming could be used to grow energy crops [Citation18,Citation46], e.g. for production of biodiesel for on-farm use. In this respect it is worth mentioning that Halberg et al. [Citation47] estimated that growing rapeseed on 10% of the land on a 40 ha (organic) cash crop farm, produces enough bio-diesel to replace 50% of the diesel used on the farm. Based on the notion that land requirement in conventional farming is lower, Corré et al. [Citation46] conclude that the highest energy efficiency in agriculture would be reached in conventional farming incorporating the production of energy crops. Accepting that land is a scarce resource world wide, this conclusion is relevant for the debate about energy efficiency in organic and conventional farming systems.
If energy use and GHG emissions related to food production are to be reduced, choices on food package composition are probably much more relevant than the choice to go organic or not, or, for that matter, to “buy local” or not. Affluent food packages, characterized by high levels of animal protein, are associated with higher energy use and GHG emissions than food packages based on vegetable products [48–51Citation[48]Citation[49]Citation[50]Citation[51]]. Carlsson-Kanyama & Gonzalez [Citation48], for example, calculated GHG emissions of three meal options with similar nutritional composition, but different ingredients. Emission levels of the two meals with the lowest and highest level differed a factor 11, indicating how much influence food choices can have on GHG emissions. Until recently the influence of diet composition on environmental impact was not on the policy agenda, but recent policy documents on the subject in the Netherlands [Citation52] and the United Kingdom [Citation53] indicate that this is gradually changing.
5 Conclusions
Energy use per unit milk in organic dairy is approximately 25% lower than in conventional dairy, while GHG emissions are 5-10% lower. Contrary to dairy farming, energy use and GHG emissions in organic crop production are higher than in conventional crop production. Energy use per unit product in organic arable farming is 10-30% higher and in organic vegetable farming 40-50% higher than in their conventional counterparts. GHG emissions in organic arable and vegetable farming are 0-15% and 35-40% higher, respectively. Based on the notion that land requirement in conventional farming is lower, highest energy efficiency in agriculture would be reached in conventional farming incorporating the production of energy crops. Besides production method, energy use and GHG emissions related to food production are also strongly influenced by food package composition.
Acknowledgements
The (former) Ministry of Agriculture, Nature and Food Quality financed this research. Michel de Haan and Aart Evers (Animal Sciences Group, Wageningen University and Research Centre) are gratefully acknowledged for their help with the calculations for the dairy sector. We wish to thank Bert Vermeulen (Plant Research International, Wageningen University and Research Centre) for providing data on energy use related to farm operations and Marlies Thomassen and Imke de Boer (Animal Production Systems, Wageningen University and Research Centre) for data on energy use and GHG emissions related to concentrate production.
References
- CBS StatLine, 2009. Statistics Netherlands, http://statline.cbs.nl/statweb/?LA = en, accessed 12 June 2009
- Netherlands Environmental Assessment Agency, Greenhouse gas emissions in the Netherlands 1990-2007, National Inventory Report 2009, Bilthoven, 2009, p. 138.
- T.NemecekD.DuboisO.Huguenin-ElieG.GaillardLife cycle assessment of Swiss farming systems: Integrated and organic farmingAgr. Syst.1042011217232
- T.GomieroM.G.PaolettiD.PimentelEnergy and environmental issues in organic and conventional agricultureCrit. Rev. Plant Sci.272008239254
- M.A.ThomassenK.J.van CalkerM.C.J.SmitsG.L.IepemaI.J.M.de BoerLife Cycle Assessment of conventional and organic milk production in the NetherlandsAgric. Syst.96200895107
- J.GrönroosJ.SeppäläP.VoutilainenP.SeuriK.KoikkalainenEnergy use in conventional and organic milk and rye bread production in FinlandAgric. Ecosyst. Environ.1172006109118
- C.CederbergB.MattssonLife cycle assessment of milk production–a comparison of conventional and organic farmingJ. Clean. Prod.820004960
- G.HaasF.WetterichU.KöpkeComparing intensive, extensified and organic grassland farming in southern Germany by process life cycle assessmentAgric. Ecosyst. Environ.8320014353
- P.MäderA.FließbachD.DuboisL.GunstP.FriedU.NiggliSoil Fertility and Biodiversity in Organic FarmingScience296200216941697
- H.FlessaR.RuserP.DörschT.KampM.A.JimenezJ.C.MunchF.BeeseIntegrated evaluation of greenhouse gas emissions (CO2, CH4, N2O) from two farming systems in southern GermanyAgric. Ecosyst. Environ.912002175189
- M.ShepherdB.PearceB.CormackL.PhillipsS.CuttleA.BhogalP.CostiganR.UnwinAn assessment of the environmental impacts of organic farming, a review for Defra-funded project OF04052003p80
- T.de PontiB.RijkM.K.van IttersumThe crop yield gap between organic and conventional agricultureAgr. Syst.108201219
- E.A.StockdaleN.H.LampkinM.HoviR.KeatingeE.K.M.LennartssonD.W.MacDonaldS.PadelF.H.TattersallM.S.WolfeC.A.WatsonAgronomic and environmental implications of organic farming systemsAdv. Agron.702001261327
- J.De WitH.VerhoogOrganic values and the conventionalization of organic agricultureNJAS-Wagen. J. Life Sc.542007449462
- Th.V.VellingaA.BanninkM.C.J.SmitsA.Van den Pol-Van DasselaarI.PinxterhuisIntensive dairy production in an urban landscape, the Dutch situationLivest. Sci.1392011122134
- B.G.MeerburgH.KorevaarD.K.HaubenhoferM.Blom-ZandstraH.van KeulenThe changing role of agriculture in Dutch societyJ. Agr. Sci.1472009511521
- J.F.F.P.BosJ.J.de HaanW.SukkelEnergy use, greenhouse gas emissions and carbon sequestration; organic and conventional farming comparedWageningen2007p. 76(in Dutch)
- H.L.TuomistoI.D.HodgeP.RiordanD.W.MacdonaldComparing energy balances, greenhouse gas balances and biodiversity impacts of contrasting farming systems with alternative land usesAgr. Syst.10820124249
- M.H.A.De HaanA.G.EversW.H.van EverdingenA.van den Pol-DasselaarInfluence of manure policy regulations with application standards on grazing managementLelystad2005p. 56(in Dutch)
- D.F.Ter VeerScenario study 100% organic feeds for dairy cattleLelystad2005p. 22(in Dutch)
- F.G.WijnandsA.J.G.DekkingOrganic arable farming, central marine clay regionLelystad2002p. 51(in Dutch)
- F.G.WijnandsA.J.G.DekkingIntegrated arable farming, central marine clay regionLelystad2002p. 52(in Dutch)
- W.SukkelP.A.C.KootOrganic field vegetables, South East NetherlandsLelystad2002p. 43(in Dutch)
- W.SukkelP.A.C.KootIntegrated field vegetables, South East NetherlandsLelystad2002p. 56(in Dutch)
- M.De WolfA.van der KloosterQuantitative Information Arable Farming and Field Grown Vegetables 2006Lelystad2006p. 286(in Dutch)
- F.G.WijnandsJ.HolwerdaTowards good organic practice, results and experiences from the project ‘Organic farming innovation and conversion’Lelystad2003p. 170(in Dutch)
- R.L.M.SchilsM.H.A.de HaanJ.G.A.HemmerA.van den Pol-van DasselaarJ.A.de BoerA.G.EversG.HolshofJ.C.van MiddelkoopR.L.G.ZomDairyWise, a whole-farm modelJ. Dairy Sci.90200753345346
- R.L.M.SchilsA.VerhagenH.F.M.AartsP.J.KuikmanL.B.J.ŠebekEffect of improved nitrogen management on greenhouse gas emissions from intensive dairy systems in the NetherlandsGlob. Change Biol.122006382391
- H.F.M.MombargA.KoolW.J.CorréJ.W.A.LangeveldW.SukkelEnergy and climate yardstick, methodology and equationsWageningen2003p. 26(in Dutch)
- H.B.SchoorlemmerA.T.KrikkeFarm economic assessment in the arable and vegetable sectorLelystad1997p. 76(in Dutch)
- F.BrentrupC.PallièreGHG emissions and energy efficiency in European nitrogen fertilizer production and useProceedings 639, International Fertiliser Society, York, UK200827 p
- I.HagemanF.ManderslootModel energy use dairy farmLelystad1994p. 32(in Dutch)
- R.L.M.SchilsD.A.OudendagK.W.van der HoekJ.A.de BoerA.G.EversM.H.de HaanGreenhouse gas module BBPR, Wageningen University and Research CentreWageningen2006p. 50(in Dutch)
- SenterNovemDutch list of energy carriers and standard CO2 emission factors2004p. 12(in Dutch)
- G.L.VelthofO.OenemaNitrous oxide emission from dairy farming systems in the NetherlandsNeth. J. Agric. Sci.451997347360
- P.J.KuikmanD.A.OudendagA.SmitK.W.van der HoekROB measures in agriculture and reduction of greenhouse gas emissions2004Wageningen University and Research CentreWageningen142(in Dutch)
- S.SolomonD.QinM.ManningZ.ChenM.MarquisK.B.AverytM.TignorH.L.MillerClimate Change 2007, The Physical Science Basis, Contribution of Working Group I to the Fourth Assessment Report of the Intergovernmental Panel on Climate Change2007Cambridge University PressCambridge, United Kingdom and New York, NY, USA
- M.MeulF.NevensD.ReheulG.HofmanEnergy use efficiency of specialised dairy, arable and pig farms in FlandersAgric. Ecosyst. Environ.1192007135144
- S.DeikeB.PallutO.ChristenInvestigations on the energy efficiency of organic and integrated farming with specific emphasis on pesticide use intensityEur. J. Agron.282008461470
- R.LogesM.R.KelmF.TaubeNitrogen balances, nitrate leaching and energy efficiency of conventional and organic farming systems on fertile soils in Northern GermanyAdv. GeoEcol.382006407414
- A.G.WilliamsE.AudsleyD.L.SandarsDetermining the environmental burdens and resource use in the production of agricultural and horticultural commoditiesDefra Research Project IS0205, Cranfield University and Defra, United Kingdom2006p97
- J.W.HoeppnerM.H.EntzB.G.McConkeyR.P.ZenterC.N.NagyEnergy use and efficiency in two Canadian organic and conventional crop production systemsRen. Agr. Food Syst.2120056067
- T.DalgaardN.HalbergJ.R.PorterA model for fossil energy use in Danish agriculture used to compare organic and conventional farmingAgric. Ecosyst. Environ.8720015165
- J.E.OlesenK.ScheldeA.WeiskeM.R.WeisbjergW.A.H.AsmanJ.DjurhuusModelling greenhouse gas emissions from European conventional and organic dairy farmsAgric. Ecosyst. Environ.1122006207220
- C.CederbergA.FlysjöEnvironmental assessment of future pig farming system, Quantification of three scenarios from the FOOD 21 Synthesis WorkThe Swedish Institute for Food and Biotechnology, Gothenburg, Sweden2004p54
- W.CorréJ.SchröderJ.VerhagenEnergy use in conventional and organic farming systemsProceedings 511, International Fertiliser Society, York, United Kingdom2003p23
- N.HalbergR.DalgaardJ.E.OlesenT.DalgaardEnergy self-reliance, net-energy production and GHG emissions in Danish organic cash crop farmsRen. Agr. Food Syst.2320083037
- A.Carlsson-KanyamaA.D.GonzálezPotential contributions of food consumption patterns to climate changeAm. J. Clin. Nutr.8920091704S1709S
- C.L.WeberH.Scott MatthewsFood-miles and the relative climate impacts of food choices in the United StatesEnviron. Sci. Technol.42200835083513
- A.J.McMichaelJ.W.PowlesC.D.ButlerR.UauyFood, livestock production, energy, climate change, and healthLancet370200712531263
- R.GoodlandEnvironmental sustainability in agriculture: diet mattersEcol. Econ.231997189200
- Ministry of Agriculture, Nature and Food Quality, Policy Document on Sustainable Food, towards sustainable production and consumption of food, The Hague, 2008, p. 16. (in Dutch)
- Cabinet OfficeFood matters, towards a strategy for the 21st Century2008The Strategy UnitLondon, UKp124