
 ?Mathematical formulae have been encoded as MathML and are displayed in this HTML version using MathJax in order to improve their display. Uncheck the box to turn MathJax off. This feature requires Javascript. Click on a formula to zoom.
Abstract
Efficient policy intervention to reduce antibiotic use in livestock production requires knowledge about potential causal factors of antibiotic use. Animal health status and management quality were considered the two most important factors that influence farmers’ decision-making concerning antibiotic use. The objective of this paper was to develop a Bayesian belief network (BBN) to analyze how these factors can directly and indirectly influence antibiotic use. Since both factors are not directly observable (i.e., latent), they were inferred from related observable variables (i.e., manifest variables). Using farm accounting data and registration data on antibiotic use and veterinary services in specialized finisher pig farms over the period 2007-2010, a confirmatory factor analysis was carried out to construct the two latent factors. Antibiotic use is quantified as the number of days per year in which an average pig is treated with antibiotics according to their standard daily dosages (NDD). Descriptive analysis on the data revealed that for the finisher pig farms, NDD averaged about 17 days, with substantial year-to-year variations and between-farm variations within the same year.The conditional probabilities for the BBN model were obtained through regression analysis between the constructed factors, NDD, and a number of technical and economic variables. The BBN model showed that antibiotic use was simultaneously influenced by the two latent factors, but in varying degrees depending on other variables. Therefore interventions targeting only to improve one factor are likely to lead to unsatisfactory outcomes of antibiotic use.
1 Introduction
The impact of antibiotic resistant bacteria, especially multi-resistant strains, on human health has become a major international concern [Citation1]. Attention has focused on food-producing animals as one of several potential sources of antibiotic-resistant bacteria (WHO, 1997). As a result, in 1999, the European Union banned the sub-therapeutic use of four widely applied antibiotics in animal feed that are similar to drugs used in human medicine. The use of sub-therapeutic doses of antibiotics as growth promoters was banned in the EU from 1 January 2006 [Citation2]. In recent years, however, the therapeutic overuse of antibiotics in treating infectious animal diseases is believed to be a significant factor for increasing antibiotic resistance [3–5Citation[3] Citation[4] Citation[5]]. There are serious indications that the majority of the treated animals is likely not diseased, at least not clinically visible, but treated due to group treatment, preventive and metaphylactic usage. The question arises as to whether therapeutic antibiotics use is really intended for disease treatment or more for improving the growth and feed efficiency of production animals [Citation6].
Although considerable uncertainty exists about the causal link between antibiotic use in livestock production and the occurrence of resistant bacteria to human antibiotics, public health concern has made the reduction of antibiotic use in livestock production an urgent issue in public policy agenda. This is particularly the case in the Netherlands where human antibiotic use is highly restricted. The intensive livestock sector is criticized for having used antibiotics excessively to achieve economic efficiency [Citation7]. To limit the occurrence of antibiotic resistance, the Dutch government aims to reduce the use of antibiotics in livestock at least by 20% in 2011, and 50% in 2013 [Citation8]. Efficient policy intervention to reduce antibiotic use in livestock production requires knowledge regarding the potential causal factors of antibiotic use, which can be used to design effective incentive mechanisms.
The use of antibiotics in livestock production is a complex issue [Citation7,Citation9]. Farmer's antibiotic use concerns veterinary considerations, but entails economic consequences [Citation10]. As such, antibiotic use is intricately linked to many technical and economic indicators of animal production, which may be influenced by farm structure and the characteristics of the farmer [Citation11]. Given the natural variability in the biological processes of farm animals and management characteristics of the farmers, the relationships among antibiotic use and other factors are inherently uncertain. Ignoring these uncertainties may lead to inefficient policy intervention on antibiotic use. It is therefore important to address the uncertainties when designing policy intervention.
To deal with uncertainties in a structured and consistent way, one of the most recognized scientific methods is the Bayesian approach in which uncertainties are modeled with probabilistic relationships [Citation12]. In particular, Bayesian Belief Networks (BBNs) with their associated methods are a powerful tool for dealing with uncertainties in decision making pertaining to human behavior [Citation13]. A BBN is a graphical model that incorporates probabilistic relationships among variables of interest and consists of probabilistic inference mechanisms according to the Bayesian rule.
Bayesian networks have been successfully applied in a variety of disciplines, most notably in human medicine, and they are beginning to be more applied in ecological modeling [Citation14,Citation15], and microbial risk assessment in the food chain [Citation16]. Recent research developments led to the creation of a number of integrated BBN models combining knowledge stemming from different disciplines related to the management of natural resources such as land and ground water [see e.g.,Citation17,Citation18-Citation20]. Such a multidisciplinary approach is also a prerequisite in assisting policy makers with preferred incentive-based policy instruments aimed at the reduction of antibiotic use in livestock production.
The overall objective of this study is to develop a BBN model that can be used to estimate the influence of potential causal factors of antibiotic use in livestock production. As an illustration, data from specialized fattening pig farms in the Dutch Farm Accountancy Data Network (FADN) covering the period 2007 to 2010 were used to estimate parameters for the model. In Section 2, the FADN data and monitoring data on antibiotic use are first described to provide contextual information of this study. This is followed by the description of the key steps in building the BBN model. Section 3 then presents the resulting BBN model and illustrates how it can be used to infer influences of the latent factors. Section 4 discusses the results and the implications for policy design. The concluding remarks are summarized in Section 5.
2 Material and methods
2.1 Dutch FADN and monitoring data on antibiotic usage
Due to its potential impact on public health, antibiotic usage in livestock production has been closely monitored and reported in the Netherlands [Citation21]. Since 1998, FIDIN, a federation of the Dutch veterinary pharmaceutical industry, annually reports antibiotic sales figures in the Netherlands [Citation22]. Besides monitoring of total sales data at the national level, detailed monitoring of antibiotic use is also carried out on a stratified sample of Dutch farms that supply data to the FADN of LEI Wageningen UR. FADN is an European Union wide system to collect detailed financial economic information at farms. The Dutch FADN contains a representative sample of around 1500 agricultural and horticultural farms in the Netherlands [Citation23].
The FADN database records economic data and technical performance indicators of the farms. Each year, a number of farms are replaced by other farms to ensure that the database of the Dutch FADN remains representative for Dutch livestock farming. Besides regular FADN information, detailed registration data on animal medication and veterinary service, called the DAR-data, have also been kept of the animal-medicine data and veterinary services. The records enable the calculation of the number of days per year in which an average animal is treated with antibiotics according to standard daily dosages (NDD). NDD is currently used as an indicator for the level of antibiotic exposure of the corresponding farm [Citation21]. Containing veterinary, technical and economic information, these data on the FADN farms may offer insights not only into the exposure of farm animals to antibiotics but also into the underlying factors that could explain changes in antibiotic use.
2.2 Developing the BBN
Constructing a BBN typically involves three steps. The first step is the development of the graphical structure indicating the relevant variables and their dependencies. This step provides the basis for determining the degree of decomposition to be used in subsequent construction of the model. From a modeling perspective, this step requires developing a conceptual model to identify variables of interest and hypothesize their causal relationships. The conceptual model should provide insights into possible incentive mechanisms for farmers to reduce antibiotic use. The second step in constructing a BBN is the quantification of conditional relationships and the third step is building the graphical model which can visualize the quantitative relationships. These steps are explained below in more detail.
2.2.1 Step 1: The conceptual model for the BBN
Economic literature suggests profit maximization as the most important criteria in farmers’ decision making [Citation24]. Furthermore, risk aversion plays an important role as animal farming is known to be a highly risky business due to many uncontrollable factors such as diseases and market conditions [Citation25]. To infer the causal factors of antibiotic use, it is therefore important to understand the mechanisms by which antibiotic use interacts with the profitability of animal production and the associated risk. Based on previous studies on farm factors associated with antibiotic use [Citationsee e.g., 11], a conceptual model was developed and graphically shown in . The conceptual model was built upon the understanding that farm performance indicators like animal mortality or revenue-to-cost ratio are all reflections of the fundamental factors such as animal health status (or disease status) and management quality (including risk management). More specifically, it can be expected that animal health status is a key factor underlying technical indicators such as antibiotic use, mortality, and feed conversion. Aspects such as capital structure and the variability of gross margin are expected to be more influenced by management quality. Since neither animal health status nor management quality can be measured directly, they were treated as latent variables about which information can be inferred from their manifest variables, i.e., observable variables whose variations are influenced by the latent variables [Citation26].
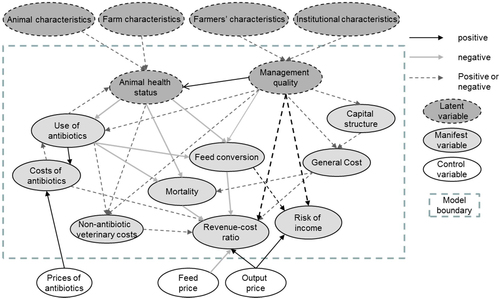
The conceptual model describes the boundary of our study and possible causal relationships among the manifest variables and latent variables. Prices of output, feed and antibiotics are indicated as control variables because they can be controlled externally to create profit incentives for the farmer. While highlighting the central role of animal health status and management quality in shaping profitability and the risk of income, the conceptual model also suggests that these factors are influenced by the specific characteristics of animals, farm, farmer, and the institutional environment. In view of the heterogeneous nature of these characteristics, considerable variations can be expected from the levels of animal health and management quality among farms. Knowledge regarding the levels of these factors and how they can be inferred from the manifest variables is therefore essential for effective policy intervention design.
For the production of fattening pigs, a number of technical and economic performance indicators were selected as manifest variables to construct the latent factors. The technical indicators included antibiotic use (NDD), mortality and feed conversion ratio (FCR) of pigs. In animal husbandry, FCR (also known as feed conversion rate, or feed conversion efficiency) is a measure of an animal's efficiency in converting feed mass into increased body mass [Citation27]. Lower FCR indicates higher efficiency and often lower feed costs. Economic indicators were variables reflecting capital structure, various operating costs, gross margin per pig, and an overall revenue-to-cost ratio (RCR). For each farm, we also calculated the spread of gross margin over feed and net revenue of the farm per pig (as the difference between the highest value and the lowest value between 2007 and 2010) as a proxy for the farm's risk of income. The choice of spread as a proxy for risk instead of the more common mean-variance model is due to the limited number of observations for each farm (≤4).
2.2.2 Step 2: Quantification of conditional relationships
A BBN is constructed by representing variables as nodes connected by directed links, which indicate conditional dependence. Each variable consists of a finite set of mutually exclusive states. A link from variable A to variable B indicates that A is a parent of B and B is a child of A. A child node can have more than one parent nodes. A link from the parent node A to the child node B indicates that A and B are functionally related, or that A and B are statistically correlated. Each child node contains a conditional probability table (CPT) which gives the conditional probability for the node being in a specific state given the configuration of the states of its parent nodes. In BBNs, variables with no parents have a simple probability table, giving the initial probability distribution of the variable. Variables with parents have conditional probability tables (CPTs) for every combination of states of the variable's parents.
To quantify the conditional relationships between the latent factors and manifest variables, factor analysis was used to identify and construct the factors. Factor analysis is a statistical approach that is used to analyze interrelationships among a large number of variables and to explain these variables in terms of their common underlying dimensions (factors) [Citation28,Citation29]. Two general approaches are used in factor analysis: exploratory factor analysis (when the nature of the underlying factors are unknown) and confirmatory factor analysis (when theoretical expectations on the underlying factors are made) [Citation30]. Based on the conceptual model, a confirmatory factor analysis was performed on the data to verify the existence of the two factors. Factors with eigenvalue greater than one were retained for further analysis [Citation31]. Factor scores were then calculated and used as proxies for the retained factors. Rotated factor loadings are then used to interpret the factors and select variables for the BBN based on the ranking. Considering possible correlation between the two latent factors, oblique rotation was used using the criteria Oblimax [Citation31,Citation32]. The statistical package Stata 9.0 was used to perform the analysis and the calculations [Citation33].
The statistical relationships among the factors and the selected variables for the BBN were estimated through linear regression analysis, i. e., by approximating the relationship between the factors and the selected variables as , where i = 1 or 2, f
i
denotes the two constructed factors (two vectors of factor scores),
X
i
denotes the two sets of observations on the manifest variables (two matrices) corresponding to factor, f
i
, β
i
denotes the two vectors of coefficients to be estimated, and ɛ
i
denotes the two vectors of error terms that are assumed to be white noise. After estimating the two vectors of coefficients as
, the expected values of the factors
given observations of the manifest variables (
X
i
) were then calculated as
Since the BBN methodology typically uses discrete states of the variables and the variables in the conceptual model are continuous, the selected variables and the constructed factors were discretized into levels that represent intervals. For this purpose, the statistical information of the variables was used to define boundary values for the intervals. To avoid the estimation bias caused by repeated observations on the same farm in different years, mean values of the same farm in different years were used, i.e., the dataset was collapsed to a cross-sectional dataset. For all the variables selected, the 15th, 35th, 55th, and 75th percentiles of the variables in the dataset were used to discretize the value of the variable into five intervals. These intervals were then denoted “very low”, “low”, “average”, “high” and “very high”, respectively. The choice of the percentile is made to ensure equal distribution of the farms into different categories. The conditional probabilities between the discrete states were then obtained through cross-tabulation and stored as corresponding CPTs.
2.2.3 Step 3: Building the BBN
To build and compile the model, the Bayesian network software GeNIeFootnote 1 was used. As a versatile and user-friendly development environment for graphical decision-theoretic models, GeNIe has been widely acknowledged in Bayesian network modeling [Citation34]. The CPTs calculated in Step 2 for the corresponding nodes in the BBN were pasted into the corresponding tables in GeNIe.
When the BBN is compiled, Bayes’ theorem is applied according to the values in the CPTs, so that changes in the probability distribution for the states at parent nodes are reflected in the changes in the probability distributions for the states at their child nodes. BBN allows information to flow in the opposite direction of the causality, which means BBN model can be used to infer the latent factors through the manifest variables [Citation13]. Using the Bayes’ Rule, information on the latent factors can be updated when there is new evidence on the manifest variables. In Bayesian terminology, an evidence on a variable is a statement or a piece of information of the certainties of its states [Citation13]. If the information gives the exact state of the variable, it is called a hard evidence, otherwise it is called soft evidence.
2.3 Analyzing the BBN model
To analyze the behavior of the BBN model, three complementing approaches were followed. First, the model was run multiple times by changing the evidence levels of all manifest variables “one-by-one”. Second, the model was run by changing the evidence levels for all manifest variables at the same time. Only extreme evidence levels were explored to capture the whole spectrum of possible outcomes. Finally the impact of extreme levels of the latent factors on the manifest variables was explored.
3 Results
3.1 Descriptive statistics of variables related to antibiotic use
Descriptive statistics of the included variables in the analysis are shown in . The value of NDD averaged about 17.5 for the whole period, with substantial year-to-year variations and within year variations. On average, the number of treatment days was the lowest in 2010 (about 11) and the highest in year 2008 (about 23). Based on the means and standard deviations (SDs) per year as reported in , coefficient of variations (CVs) were calculated to quantify the variability among farms. The CV of a variable is the variable's SD divided by its mean value. The overall picture is that considerable variation in antibiotic use was present among farms in each year, with the CV increasing from 67.2% in 2007 to 96.7% in 2010. The variability in the costs of veterinary medicine and service (VetCost) between farms was of a lower magnitude, increasing from 48.7% in 2007 to 68.4% in 2010. Significantly lower CVs were however observed on the variables FCR (6.2% to 7.3%) and RCRFootnote 2 (8.9% to 13.8%). Economic indicators such as the depreciation costs and general costs showed high level of variability, ranging from 80.2% up to 171%. The spread of gross margin over feed and the spread of net revenue of the farm over the years are on average much higher than the standard deviation among the farms in the same year, suggesting a considerable level of income risk for farmers.
Table 1 Definition and descriptive statistics of the manifest variables used in the BBN model (N = number of observations).
Several key features were observed from the correlation matrix of the selected variables (). First, correlations among the selected variables were in general moderate. Second, significantly positive correlations were observed between antibiotic use (NDD) and variables representing profitability (RCR), gross margin (GrossMargin) and the spread of gross margin (DeltaGross). Third, there are significant positive correlations between the spread of net revenue (DeltaGross), depreciation costs (DepCost), general costs (Gencost), net revenue (GrossMargin), and the overall profitability (RCR). This suggests that risk may have played a significant role in determining antibiotic use and other farm decisions. It is likely that farmers who had higher antibiotic use faced higher level of risk which is associated with higher level of profitability. Likewise, farmers who had lower level of antibiotic use may have had lower level of risk which resulted in lower level of net revenue.
Table 2 Correlationmatrix between antibiotic use (NDD and other manifest variables used to infer the latent factors.
3.2 Latent factors affecting antibiotic use
The factor analysis on the technical and economic variables indicated two factors with eigenvalue greater than one, which confirmed the theoretical expectation. The factors were found to be negatively correlated with each other (with a coefficient of -0.39). These two factors were then retained for further analysis. After the factor analysis, oblique rotation was performed to obtain insight into the nature of the factors. The rotated loadings of the variables on the factors are shown in .
Table 3 Rotated factor loadings of manifest variables.
Based on the rotated factor loadings, Factor 1 appeared to be mainly explained by capital depreciation cost, general costs, and the spread of net revenue per animal. For the remaining variables, higher loadings of feed conversion ratio, profitability (RCR) and solvency on Factor 1 were also observed. This may imply that the Factor 1 is strongly influenced by investment decisions that typically correlate with high depreciation and general costs. Since depreciation costs and level of solvency depend to a large extent on managerial decisions, Factor 1 could be loosely interpreted as an indicator for management quality.
Factor 2 was found to be mainly explained by antibiotic use, profitability, net revenue, and the spread of gross margin over feed cost. Veterinary costs and feed conversion ratio also showed positive loading on factor 2. Since antibiotic use, veterinary costs and feed intake can be reasoned to be dependent on animal health status, Factor 2 can be interpreted as an indicator for animal health status, but in a reversed order, i.e., higher level of Factor 2 indicates poorer animal health. To simplify the illustration, four variables with higher factor loadings were retained for each factor to build the BBN model.
3.3 Analysis of the BBN model
Without prior information on the manifest variables, i.e., when all states were considered to have equal probabilities of 20%, the default outcome of the BBN model is shown in . For this non-informative prior, probabilities for Factor 1 and Factor 2 being in a very low level were 29% and 6%, respectively, which were much lower than the probabilities for the two factors being in the high and very high level.
Table 4 Evidence statistics of the variables used in the BBN model.
The BBN model captures and visualizes the conditional relationships among the manifest variables such as antibiotic use and the two latent factors of the finisher pig farms that are interpreted as animal health status and management quality. As such, the model should provide quantitative insight into possible mechanisms underlying antibiotic use. Keeping the information on other variables constant, altering prior information of NDD alone showed significant effects on the outcome probabilities of the two latent factors. With average level of all other variables and a very low level of antibiotic use, the probability of Factor 2 being in the very low and low level were 16% and 37% respectively, which suggested a higher level of animal health for these farms with low antibiotic use and average technical and economic performances. In the same situation, the probability of Factor 1 being in the very high and high level were 55% and 7% respectively, suggesting a higher level of management quality.
Complementary to the “one-by-one” approach in changing evidence levels, and illustrate the resulting probability distributions of the two factors with different evidence levels of the manifest variables. When all manifest variables except NDD received the evidence of being in the average level with 100% probability, the probability of Factor 1 being in the high or very high level approached zero when evidence of NDD was set at the very high level. With the same set of evidence, the probability of Factor 2 being in high or very high level approached 100%. Since higher level of Factor 2 indicates low level of animal health, which tends to lead to low level of performance, it could be expected that higher level of antibiotic use had compensated for lower management quality to reach an average level of economic performance.
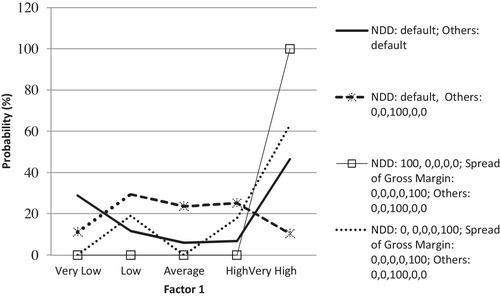
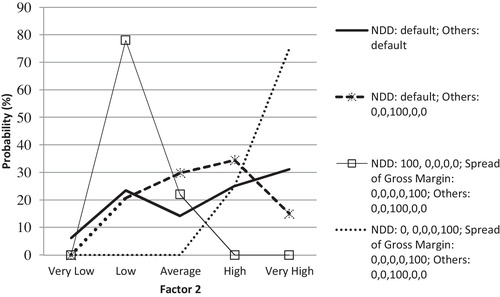
When setting evidence on the very high level of spread of gross margin and very low level of antibiotic use, we observed that the probability of Factor 1 being in the very high level reaches 100% and the probability of Factor 2 being in the high and very high level (poor animal health status) becomes zero. The probability of Factor 1 being in the high and very high level dropped by about 20% when evidence on antibiotic use is set to be very high. At the same time, the probability of Factor 2 being at the high and very high level increases to almost 100%. This suggests that low antibiotic use and high spread in gross margin characterize farmers who have higher management quality (perhaps willingness to take more risk) and healthier animals. On the contrary, high antibiotic use and high spread in gross margin suggests poor animal health status and possibly poor management.
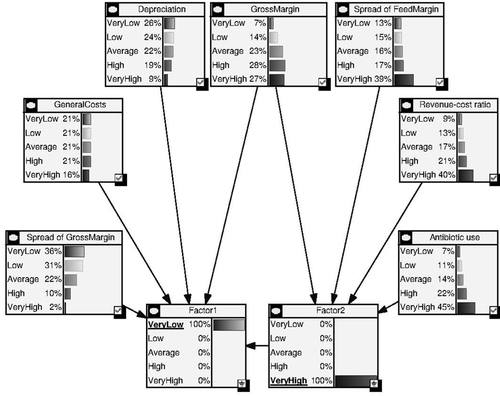
Finally the impacts of very extreme levels of the latent factors on the manifest variables were depicted in with very low level for Factor 1 (poor management) and very high level for Factor 2 (poor animal health). The probability that such finisher pig farms would have high or very high antibiotic use was more than 67%. On the other hand, for finisher pig farms with very high score of factor 1 and very low score of factor2, the total probability of low and very low antibiotic use amounted to about 80%, suggesting the possibility of reducing antibiotic use through improving both factors.
In summary, analyzing the BBN model suggested that antibiotic use was simultaneously influenced by the two latent factors, but in varying degrees depending on the levels of other variables. Therefore interventions only targeting to improve one of the two latent factors are likely to lead to unsatisfactory reduction of antibiotic use.
4 Discussion
4.1 Data and the parameterization of the BBN
The empirical relevance of the BBN model depends on the quality of data used to obtain the parameters. Due to the relatively small size of the data set, the results of the BBN model presented in this paper should be interpreted with caution. Furthermore, statistical tests showed that some of the manifest variables in the data set were not normally distributed. This could be a feature of small sample set, but could also indicate inherent non-normality of the variable. To provide more reliable policy recommendation, a larger sample size may therefore be necessary. For more practical policy purposes, it is highly recommended to collect more data on animal diseases and entrepreneurial decisions.
In addition to statistical analysis on the data, model parameters could also be elicited from experts. In particular, CPTs derived from expert opinion can be used to validate the model outcome and guide the analysis of the model. It should however be pointed out that using expert opinion on complex relationships among multiple variables is often subject to limitations of human capacity in processing and interpreting large number of conditional probabilities.
4.2 Role of risk and uncertainty in farmers’ decision on antibiotic use
Farmers’ decision on antibiotic use is intrinsically linked to the risk of animal diseases and farmer's risk attitude in coping with the risk and uncertainty of farming. Our conceptual model suggested therefore that the risk of income reflects management quality and we considered risk attitude an important determinant of management decisions such as antibiotic use. One hypothesis was that risk-averse farmers are more likely to use antibiotics as in a prophylactic manner to minimize the risk of a disease outbreak and as a result, they would have smaller spread in the technical and economic performance indicators. By incorporating two spread variables as a proxy for risk (spread of margin over feed cost and spread of gross margin of the farm), the model results seemed to confirm the hypothesis. It should however be pointed out that the calculated spread of the two variables may underestimate the true risk of some farms due to the limited number of observations for each farm. The role of risk and uncertainty deserves therefore further attention in future research when more data are available to more accurately represent the risk. Furthermore, to better understand the determinants of the latent factors, more subjective knowledge about farmers’ motivations should be included in the BBN besides the technical and economic variables included in the current research.
4.3 Public policy implications of the BBN model and results
The BBN model summarizes knowledge derived from the conceptual model and the empirical data regarding the quantitative relationships among factors related to both profitability and on farm antibiotic use. As such, it provides a natural framework to investigate possible incentive mechanisms of different policy interventions for different types of farms. Understanding the incentive mechanisms underlying different policy interventions and farmers’ decision making is a prerequisite for designing effective policy intervention to reduce veterinary antibiotic use. More specifically, these incentive mechanisms suggest how rational farmers would make their decisions with regard to antibiotic use and other management practices in response to government and chain policy interventions.
To achieve the reduction of veterinary antibiotic use, policy interventions could use both price instruments and regulations. Price instruments could be for example taxes on antibiotics and price differentiation for antibiotic-free products/chains. The first option discourages high antibiotic use by increasing the costs of using antibiotics, which will affect farmers with high antibiotic use much more than farmers with low antibiotic use. The second option, price differentiation for antibiotic-free products/chains, aims to reduce antibiotic use by increasing the revenue of antibiotic-free production. Considering the different levels of animal health and the risk of animal diseases, it can be expected that this instrument would be more attractive to farmers with healthier animals.
Examples of regulations as policy intervention include the ban on antibiotics that are also used for humans and quota system for antibiotic use. Consider the risk and uncertainties farmers must deal with in animal production when the use of antibiotics is restricted, such interventions may require strong enforcement to ensure compliance. More specifically, when antibiotics are applied due to farmers’ risk aversion, government or chain organization should take action to monitor disease status to reassure farmers to limit antibiotic use as in a prophylactic manner. Furthermore, benchmarking programs and communication campaigns could be used to stimulate compliance to the policy regulations. Instead of addressing all farms, regulations could also target farms with certain profiles to reduce antibiotic use. For example, the Danish ‘Yellow Card Initiative’ that was launched in 2010 target farms with the highest use of antibiotics in pig production (see for more information http://www.foedevarestyrelsen.dk/english/Animal/AnimalHealth/Pages/The-Yellow-Card-Initiative-on-Antibiotics.aspx). Furthermore, regulations could also target veterinarians or drug companies to influence their prescription and sales behavior.
As well-known in the literature [Citationsee e.g., 35], farmers’ and veterinarians’ decisions are driven not only by economic considerations, but also by other motivations, cognitive factors (such as awareness, perception, intention, reasoning and judgment) and their professional and personal networks. These aspects should also be taken into account when designing an effective policy, especially to design tailored intervention to facilitate the desired behavioral change towards reducing antibiotic use.
Although the BBN model presented can be used to infer possible incentive mechanisms for different farms, in its current state it offers limited possibilities of calculating the economic incentives offered by specific interventions. For that purpose, the BBN should be expanded to include more detailed information regarding the costs and revenues of the farm. Another limitation of the model is that possible feedback effects among the variables cannot be included. This suggests however other modeling approaches such as system dynamics [Citationsee e.g., 36] should be considered.
5 Concluding remarks
Effective policy intervention on antibiotic use often requires knowledge about the causal factors of antibiotic use. Considering animal health and management quality as the two most important factors explaining farmer's behavior with regard to antibiotic use, this paper shows how the BBN methodology can be used to infer these two latent factors using observed features of these farms.
The factor analysis showed that antibiotic use could be simultaneously influenced by both animal health status and management quality, which means interventions aiming to improve only one factor are likely to lead to unsatisfactory reduction of antibiotic use. For policy makers, it is important to distinguish which factor is more likely to be the main cause of high level of antibiotic use: animal health status (e.g. the need for therapeutic treatment) or management quality (e.g., the preference for more antibiotic use due to risk aversion). For farms with different profiles, the BBN model can be used to show the possible composition of the causal factors and design targeted policy intervention.
The BBN model quantifies and visualizes the complex relationships between on farm antibiotic use, risk and profitability. Understanding such relationships is important to design effective policy interventions to reduce veterinary antibiotic use. Consider the diversity of farm profiles and uncertainties underlying on farm antibiotic use, both price instruments and regulations could be used to reduce farmers’ antibiotic use. Further research is however needed to assess the effectiveness and efficiency of different policy interventions.
Notes
1 GeNIe may be downloaded free of charge from http://genie.sis.pitt.edu/
2 The costs used to calculate the revenue to cost ratio (RCR) include calculated costs of own labor and capital (i.e. opportunity costs instead of cash expenditure). When the economic return to own labor and capital is lower than the corresponding market prices, the ratio can be lower than 100% even when the farmers are making accounting profits.
References
- J.G. Salisbury T.J. Nicholls A.M. Lammerding J. Turnidged M.J. Nunnb A risk analysis framework for the long-term management of antibiotic resistance in food-producing animals International Journal of Antimicrobial Agents 20 2002 153 164
- European Commission, Regulation (EC) (EC) No 1831/2003 of the European Parliament and of the Council of 22 September 2003 on additives for use in animal nutrition Official Journal of the European Communities L268 2003 29 43
- G. Martin The global health governance of antimicrobial effectiveness Globalization and Health 2 2006
- I. Phillips M. Casewell T. Cox B. de Groot C. Friis R. Jones C. Nightingale R. Preston J. Waddell Does the use of antibiotics in food animals pose a risk to human health? A critical review of published data Journal of Antimicrobial Chemotherapy 53 2004 28 52
- W. Witte Medical consequences of antibiotic use in agriculture Science 279 1998 996 997
- P.E. McNamara G.Y. Miller Pigs, People, and Pathogens: A Social Welfare Framework for the Analysis of Animal Antibiotic Use Policy American Journal of Agricultural Economics 84 2002 1293 1300
- R.J. Bywater Veterinary Use of Antimicrobials and Emergence of Resistance in Zoonotic and Sentinel Bacteria in the EU Journal of Veterinary Medicine, Serie B 51 2004 361 363
- A. Klink, G. Verburg, Deskundigenberaad RIVM en reductie antibioticumgebruik. Brief aan de Tweede kamer (RIVM expert consultation on reduction of antibiotic use. Letter to the Lower House of Parlement, in Dutch), in, The Hague, 2010.
- L.A. Bester S.Y. Essack Antibiotic resistance via the food chain: Fact or fiction? South African Journal of Science 106 2010 1 5
- M. Vaarst B. Paarup-Laursen H. Houe C. Fossing H.J. Andersen Farmers’ choice of medical treatment of mastitis in danish dairy herds based on qualitative research interviews J. Dairy Sci. 85 2002 992 1001
- H.J. van der Fels-Klerx L.F. Puister-Jansen E.D. van Asselt S.L.G.E. Burgers Farm factors associated with the use of antibiotics in pig production Journal of Animal Science 89 2011 1922 1929
- M. West J. Harrison Bayesian Forecasting and Dynamic Models Second ed. 1997 Springer-Verlag New York, Inc New York
- F.V. Jensen An Introduction to Bayesian Networks 1996 UCL Press Limited
- M.E. Borsuk C.A. Stow K.H. Reckhow A Bayesian network of eutrophication models for synthesis, prediction, and uncertainty analysis Ecological Modelling 173 2004 219 239
- T.R. Hammond A recipe for Bayesian network driven stock assessment Canadian Journal of Fisheries and Aquatic Sciences 61 2004 1647 1657
- J.H. Smid D. Verloo G.C. Barker A.H. Havelaar Strengths and weaknesses of Monte Carlo simulation models and Bayesian belief networks in microbial risk assessment International Journal of Food Microbiology 139 2010
- R. Farmani H.J. Henriksen D. Savic An evolutionary Bayesian belief network methodology for optimum management of groundwater contamination Environmental Modelling and Software 24 2009 303 310
- M.E. Kragt L.T.H. Newhama A.J. Jakemana A Bayesian Network approach to integrating economic and biophysical modelling in: 18th World IMACS/MODSIM Congress, Cairns, Australia 13-17 July 2009 2009
- P. Levontin S. Kulmala P. Haapasaari S. Kuikka Integration of biological, economic and sociological knowledge by Bayesian belief networks: the interdisciplinary evaluation of potential Baltic salmon management plan in: 2010 Conference (54th) of Australian Agricultural and Resource Economics Society, February 10-12, 2010, Adelaide, Australia 2010
- A. Sadoddin R.A. Letcher A.J. Jakeman B. Croke L.T.H. Newham Bayesian Network Modelling for assessing the biophysical and socio-economic impacts of dryland salinity management in: 18th World IMACS/MODSIM Congress, Cairns, Australia 13-17 July 2009 2009 2009
- MARAN, Monitoring of Antimicrobial Resistance and Antibiotic Usage in Animals in The Netherlands, in, VANTURES, the Veterinary Antibiotic Usage and Resistance Surveillance Working Group, Lelystad, The Netherlands, 2008.
- FIDIN, Antibioticarapportage, in, FIDIN Werkgroep Antibioticumbeleid, The Hague, 2009.
- H.C.J. Vrolijk, H.B. van der Veen, J.P.M. van Dijk, Sample of Dutch FADN 2007: Design principles and quality of the sample of agricultural and horticultural holdings, in, LEI, The Hague, 2009.
- R.G. Chambers Applied Production Analysis: A Dual Approach 1988 Cambridge University Press Cambridge
- J.B. Hardaker R.B.M. Huirne J.R. Anderson G. Lien Coping with risk in agriculture Second ed. 2004 CABI Publishing Cambridge
- D.J. Bartholomew M. Knott Latent Variable Models and Factor Analysis 1999 Arnold London
- P.F. Arthur L.R. Giles G.J. Eamens I.M. Barchia K.J. James Measures of growth and feed efficiency and their relationships with body composition and carcass traits of growing pigs Animal Production Science 49 2009 1105 1112
- R.D. Berghaus J.E. Lombard I.A. Gardner T.B. Farver Factor analysis of a Johne's disease risk assessment questionnaire with evaluation of factor scores and a subset of original questions as predictors of observed clinical paratuberculosis Preventive Veterinary Medicine 72 2005 291 309
- D. Hurnik I.R. Dohoo A. Donald N.P. Robinson Factor analysis of swine farm management practices on Prince Edward Island Preventive Veterinary Medicine 20 1994 135 146
- E. D’Haenens J. van Damme P. Onghena Constructing measures for school process variables: The potential of multilevel confirmatory factor analysis Quality and Quantity 46 2012 155 188
- D. Child The essentials of factor analysis Second ed 1990 Cassel Educational Limited London
- P.F. Merenda A guide to the proper use of factor analysis in the conduct and reporting of research: Pitfalls to avoid Measurement and Evaluation in Counseling and Development 30 1997 156 164
- StataCorp, Stata Statistical Software: Release 9, College Station, TX: StataCorp LP, (2005).
- K.B. Korb A.E. Nicholson Bayesian Artificial Intelligence 2004 Chapman & Hall (CRC Press) Boca Raton, Florida
- R. Grol M. Wensing What drives change? Barriers to and incentives for achieving evidence-based practice The Medical Journal of Australia 180 6 Suppl 2004 S57 S60
- J. Forrester Counterintuitive behavior of social systems Technology Review 73 1971 52 68