
Highlights
| | A farm typology of the Northern Region of Ghana was constructed using multivariate statistics. | ||||
| | Six farm types were identified according to their resource endowment and farming activities. | ||||
| | A gradient of endowment was reflected in increasing ownership of land and large livestock. | ||||
| | With increasing endowment the dependency of the livelihood on farming declined. | ||||
| | Type-specific opportunities and constraints for agricultural innovation were reviewed. | ||||
Abstract
Typologies may be used as tools for dealing with farming system heterogeneity. This is achieved by classifying farms into groups that have common characteristics, i.e. farm types, which can support the implementation of a more tailored approach to agricultural development. This article explored patterns of farming system diversity through the classification of 70 smallholder farm households in two districts (Savelugu-Nanton and Tolon-Kumbungu) of Ghana⿿s Northern Region. Based on 2013 survey data, the typology was constructed using the multivariate statistical techniques of principal component analysis and cluster analysis. Results proposed six farm types, stratified on the basis of household, labour, land use, livestock and income variables, explaining the structural and functional differences between farming systems. Types 1 and 2 were characterized by relatively high levels of resource endowment and oriented towards non-farm activities and crop sales respectively. Types 3 and 4 were moderately resource-endowed with income derived primarily from on-farm activities. Types 5 and 6 were resource constrained, with production oriented towards subsistence. The most salient differences among farm types concerned herd size (largest for Type 1), degree of legume integration (largest for Types 2⿿4), household size and hired labour (smallest household size for Types 4 and 6, and largest proportion of hired labour for Type 4), degree of diversification into off/non-farm activities (highest for Type 1 and lowest for Type 5) and severity of resource constraints (Type 6 was most constrained with a small farm area and herd comprised mainly of poultry). It was found that livelihood strategies reflected the distinctive characteristics of farm households; with poorly-endowed types restricted to a ⿿survival strategy⿿ and more affluent types free to pursue a ⿿development strategy⿿. This study clearly demonstrates that using the established typology as a practical framework allows identification of type-specific farm household opportunities and constraints for the targeting of agricultural interventions and innovations, which will be further analysed in the research-for-development project. We conclude that a more flexible approach to typology construction, for example through the incorporation of farmer perspectives, might provide further context and insight into the causes, consequences and negotiation of farm diversity.
1 Introduction
Africa is predominantly rural, with 54% of the population engaged in agriculture [Citation35]. The majority of farmers cultivate small, fragmented parcels of land, yet are responsible for the bulk of food production, making the smallholder farm sector a key player in the continent⿿s rural economy [Citation13,Citation81]. A farming system is defined as the complex of resources that are arranged and managed according to the totality of production and consumption decisions taken by a farm household, including the choice of crops, livestock, on-farm and off-farm enterprises [Citation39,Citation38,Citation51]. Smallholder farming systems are perceived to share certain characteristics which differentiate them from large-scale, profit-driven enterprises. These include: limited access to land, financial capital and inputs, high levels of vulnerability and low market participation [Citation13,Citation14]. However, the macro- and micro-level structures, drivers and constraints of these systems are shaped by constant interaction with the local social and biophysical context [Citation15,Citation63,Citation78]. The result is farming system diversity in space (e.g. based on resource endowment), variability through time (dynamism) and multidimensionality in terms of strategy (production and consumption decisions) [Citation61]. Therefore, not all smallholders are equally land constrained, resource-poor or market oriented, and any effort to understand or develop the smallholder sector needs to start with an acknowledgement of this heterogeneity.
A practical way of dealing with farming system complexity and diversity is to artificially stratify smallholders into subsets or groups that are homogenous according to specific criteria e.g. have broadly similar resource bases, enterprise patterns, livelihoods and constraints [Citation51]. Farm typologies attempt to perform such groupings; the term ⿿typology⿿ designating both the science of type delineation and the system of types resulting from this procedure [Citation53]. The choice of differentiating criteria depends on the objective of the typology and the kind of data available [Citation50,Citation57]. Results can then be used to support the development (selection of farms), implementation (targeting and scaling-out of innovations) and monitoring (scaling up of impact assessments) of agricultural development projects [Citation7,Citation12,Citation33]. In addition to being a practical framework on the basis of which more differentiated approaches to addressing rural challenges may be designed, typologies might also inform the academic study of farming system heterogeneity. For example, they can be applied to assist in-depth farming system analyses or inform further exploratory studies through the selection of representative farms for detailed characterization. Typologies may also be used in modelling and simulation studies to evaluate potential effects of specific interventions on farming systems [Citation8,Citation51,Citation53].
Several studies have defined farmer classes and livelihood patterns to describe farming systems in different parts of Africa, using a range of criteria which often overlap across regions and agro-ecological zones (see [Citation18] for a review on smallholder typologies in Sub-Saharan Africa). This article contributes to an existing, but relatively sparse strand of literature on farming system characterization in Ghana. Using survey data collected from seven case study villages across the country, a seminal study by Benneh [Citation10] derived a broad classification of the farming systems found within Ghana using the method of soil fertility maintenance and land tenure system as main discriminating criteria. Much later, focusing exclusively on Wenchi district in the Brong-Ahafo region, two qualitative studies explored farm household diversity using migrant versus native status [Citation4] and ethnicity, gender and wealth [Citation5] as variables. The latter classifications were both based on participatory methods such as wealth ranking. Another study by Ghana⿿s Ministry of Food and Agriculture (MoFA) disaggregated farm households in 16 predominantly northern districts of the country according to their livelihood strategies, using a participatory approach [Citation6]. More recently, in 2011, a study commissioned by the International Food Policy Research Institute examined the spatial disaggregation of crop production and input use patterns across the different agro-ecological zones of Ghana making use of the nation-wide Ghana Living Standards Survey 5 dataset [Citation71]. However, to the authors⿿ knowledge, no published studies have characterized Northern Ghanaian farming systems using more formal analytical (statistical) methods.
Adopting an inductive approach, this article explores farming system variability in two districts (Savelugu-Nanton and Tolon-Kumbungu) of Ghana⿿s Northern Region through (i) the identification and characterization of farm types, (ii) analysis of patterns and inter-relationships between the types and (iii) consideration of the implications of findings for more efficient tailoring of agricultural support to farm type-specific challenges. In order to achieve these objectives, a typology was constructed on the basis of recent survey data incorporating multiple, quantitative variables of farm structure (describing resource endowment) and functioning (describing livelihood strategies) [Citation46,Citation79]. Farm clustering arose from multivariate analysis of these variables, using the well-known techniques of principal component analysis (PCA) and cluster analysis (CA) (c.f. [Citation11,Citation16,Citation20,Citation51,Citation78]. Key strengths of this approach are its reproducibility, ease of comparison across space and time, and manageability- datasets can be analysed with speed and accuracy [Citation50].
2 Materials and methods
2.1 Project, site selection and data sources
The research was embedded in a multi-country research-for-development program; Africa Research in Sustainable Intensification for the Next Generation (Africa RISING), supported by the United States Agency for International Development as part of the United States government ⿿Feed the Future⿿ initiative (http://africa-rising.net/). Operating within a time horizon of five years (2012⿿2016), the program aims to create opportunities for smallholder farm households to escape hunger and poverty through sustainably intensified farming systems that improve food, nutrition, and income security, while conserving or enhancing the natural resource base [Citation45]. The project is active in East and Southern Africa (Ethiopia, Tanzania, Malawi and Zambia) and in West Africa (Mali and Ghana). In each site, the challenge is to achieve project goals while paying particular attention to smallholder diversity within and across the rural landscapes. Therefore, identification of farm types in project regions, at the level of selected Africa RISING intervention communities, is an important first step for the program.
Africa RISING in Ghana, led by the International Institute of Tropical Agriculture (IITA), comprises the three most poverty-stricken geographical and administrative regions in the north; namely the Northern Region, Upper East Region, and Upper West Region. In September 2013, 240 farm households were surveyed across these three regions as part of a rapid characterization or baseline study. In each region, about 80 households were randomly selected from Africa RISING intervention communities for interviews using a structured questionnaire. Basic information on household composition and education of household members, land holdings, livestock ownership, labour use, assets, housing, production orientation, major crops and sources of income was collected. This article makes use of the resulting dataset from the Northern Region (i.e. Savelugu-Nanton and Tolon-Kumbungu districts) focusing on the classification of these farm households.
2.2 Study area
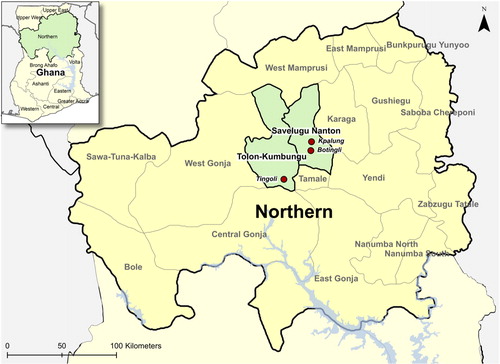
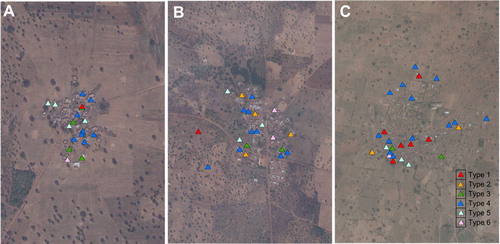
The Northern Region occupies 70 383 km2 which constitutes over two fifths of the area of modern Ghana, and is divided into 20 districts. The case study area is located in Savelugu-Nanton and Tolon-Kumbungu districts of the Northern Region, about 30⿿40 km outside of Tamale (regional capital). Three Africa RISING intervention communities were surveyed, namely; Botingli (9.61° N 0.79° W, Savelugu-Nanton district n = 21), Kpalung (9.68° N 0.78° W, Savelugu-Nanton district, n = 28) and Tingoli (9.37° N 1.01° W, Tolon-Kumbungu district, n = 31) (). The region is economically poor with little industry and despite its geographical size; the current population constitutes only about one fifth of the country total [Citation49]. Vegetation falls into the Guinea-Savannah zone, which is characterized by vast, low-lying areas of semi-arid grassland interspersed with savannah woodland, a dry and hot climate, uni-modal rainfall and fragile, sandy-loam soils often overlying impenetrable ironpan or laterite [Citation31,Citation82].
The three surveyed communities are populated mostly by members of the Dagomba ethnic group, who comprise about a third of the population of the region [Citation31]. The basic unit of social organization among the Dagomba is the farm household, centred around a ⿿compound⿿ where the head (typically male) lives with his nuclear or extended family [Citation6,Citation66]. Livelihoods are based on small-scale, low-input, mixed crop-livestock agriculture and farmlands tend to follow the typical concentric spatial arrangement found elsewhere in Africa, comprised of nucleated human settlements in the middle, inner rings of fertile compound farms, medium distance fields, and outer rings of more distant bush farms [Citation85]. Traditionally cultivated according to the bush fallow system, most farms are now under annual or permanent cultivation [Citation3,Citation10]. Staple food crops include maize (which doubles as a cash crop), yam and cassava. Rice and legumes such as groundnuts, soybean and cowpea constitute the main cash crops. Yields are generally poor due to low and erratic rainfall, low and declining soil fertility, lack of quality seed and land preparation equipment, high cost of inputs and labour constraints [Citation77]. Cattle, sheep, goats and poultry are kept as livestock for food, income, wealth accumulation, sacrificial purposes and to a lesser extent for their supply of inputs such as manure (used as organic fertilizer) and draught power [Citation31,Citation76]. Productivity of animals is low due to inappropriate feeding and animal husbandry practices that result in high mortality rates, and farmers have limited access to veterinary services and improved livestock breeds. In general, crop and livestock enterprises are weakly integrated [Citation77].
2.3 Dataset
The survey dataset for the Northern Region contained information from 80 geo-referenced farm households across three Africa RISING intervention communities (i.e. Botingli, Kpalung and Tingoli). Quantitative variables (12) related to the characteristics of the household, labour, land use, livestock and household income, were used to explore the farming system diversity of the case study area through multivariate analysis ().
Table 1 Description of variables used for farm typology construction.
2.4 Typology construction
Two multivariate statistical techniques were employed sequentially for generating a typology of the surveyed farm households: PCA to reduce the dataset into non-correlated components and CA for partitioning the PCA output into clusters. The approach has been used in many studies to categorize farming systems (e.g. [Citation11,Citation16,Citation20,Citation51,Citation78]. All analyses were executed in R (version 3.1.0) with the ade4 package (version 1.6-2, available online at: http://pbil.univ-lyon1.fr/ADE-4/) and the cluster package (version 1.15.2).
2.4.1 Principal component analysis
To avoid distortions in the statistical analysis, the dataset based on the 12 variables was carefully examined by evaluating missing data and identifying potential outliers. Boxplots were used to detect outliers which were deleted at the risk of improving the multivariate analysis while limiting its generalizability to the entire population [Citation43]. Of the 80 farm households sampled by the survey, 70 were retained for statistical analysis (i.e. 10 farm households were identified as outliers or containing incomplete data).
The decision of how many principal components (PC⿿s) to keep was made based on three criteria: (i) according to Kaiser⿿s criterion, all PC⿿s exceeding an eigenvalue of 1.00 were initially retained [Citation16,Citation51]. This decision was cross-checked by looking at (ii) the minimum cumulative percentage of variance chosen, here 60% (). The final criterion, that of (iii) interpretability, was used to assess the conceptual meaning of the PC⿿s in terms of the apparent constructs under investigation. This was done by examining the correlations between the variables and the PC⿿s [Citation17,Citation44]; higher correlation coefficients signified a closer relationship to the PC [Citation55]; c.f. circles of correlation from ). In this study, loadings greater or equal to 0.50 were considered for interpretation purposes [Citation46].
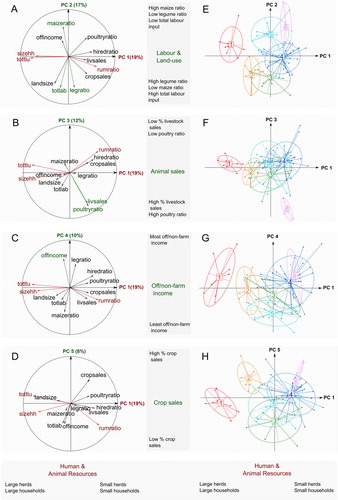
Table 2 Eigenvalues and percentage variance explained by five principal components (PC⿿s) using PCA.
2.4.2 Cluster analysis
The PCA output in the form of a reduced dataset based on the retained PC⿿s was subjected to CA. A two-step approach was followed: first, a hierarchical, agglomerative clustering algorithm using Ward⿿s method was employed to define the number of groups (k), and then a non-hierarchical, partitioning algorithm (Partitioning Around Medoids) was employed to refine these k-groups.
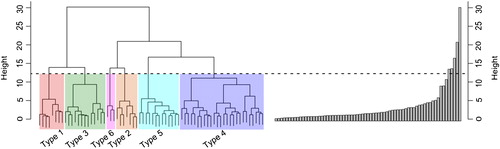
Ward⿿s method resulted in a range of cluster solutions, where each observation started out as its own cluster and was successively joined by similar clusters until only a single cluster remained [Citation73]. This agglomerative nesting process was represented by a dendrogram. In determining the optimal cluster cut-off points, a trade-off was sought between the number of clusters and the level of dissimilarity between clusters, with the objective of maximizing both intra-cluster homogeneity and inter-cluster heterogeneity [Citation43].
The number of clusters retained from Ward⿿s method was used as a starting value by the non-hierarchical algorithm, which was performed to improve the robustness of the classification by optimizing farm distribution among clusters so as to minimize the sum of the distances of each observation from its cluster centre [Citation73,Citation75]. To characterize the final set of clusters, they were examined in terms of their inherent structure (i.e. the mean value of each variable for each cluster).
Finally, the farm types were validated by an agricultural expert with intimate knowledge of the local farming systems (former MoFA extension officer for the Northern Region).
The patterns of the multivariate system, i.e. intra-group features and inter-group relationships were analysed, the farm types mapped and the implications of farm type-specific characteristics and strategies for innovation targeting considered.
3 Results and discussion
3.1 Characterization of farm types
The PCA resulted in the extraction of the first five PC⿿s explaining about 66% of the variability in the dataset (). The first PC explained the greatest part of the variation, about 19.4% of variability in the data.
The first component (PC 1) was closely related to the variables describing household size (sizehh) and animal resources (total TLU or tottlu and small ruminant ratio or rumratio), and less closely related to the hired labour ratio (hiredratio). Thus, it seemed to explain the human and animal capital of farm households (A). The second component (PC 2) correlated highly with land use variables (maize ratio or maizeratio and legume ratio or legratio) and total annual on-farm labour input (totlab). It was more weakly correlated with the cropped land area (landsize) (A). The third component (PC 3) described herd composition (poultry ratio or poultryratio) and management (livestock sales or livsales) (B). The fourth component (PC 4) was related to off/non-farm activities (offincome) (C). Finally, the fifth component (PC 5) was represented by the crop sales percentage (cropsales), giving insight into the production objective of households (D). The results from the hierarchical clustering algorithm suggested a six-cluster cut-off point (), and the non-hierarchical algorithm re-assigned farms to the identified clusters. Thus, it emerged that the households of the study area could be grouped into six broad farm types contrasted by their structural (resource endowmentFootnote1)- and functional (production objectives/livelihood strategies) characteristics (E⿿H and ):
3.1.1 Type 1. Well resource-endowed with large cattle herd, maize-based cropping system and ample non-farm activities (11% of the sampled farms)
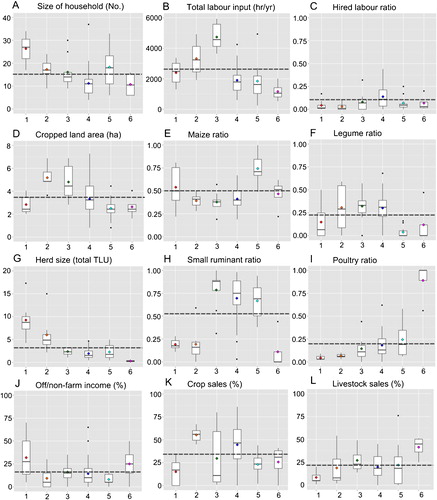
Type 1 was dissociated from the others due to the strong discriminating power for variables related to herd size and composition, household size and engagement in non-farm activities (). Thus, Type 1 comprised mainly large households (about 22 people) providing the majority of on-farm labour (96%), and the largest animal herds (on average 10 cows, 10 goats and 10 sheep). The cropped area tended to be dedicated to the production of maize (50%). Conversely, the percentages of livestock sales were the lowest among all farm types, while off/non-farm activities contributed to a large portion (about 32%) of the household income ().
3.1.2 Type 2. Well resource-endowed with larger farm areas, legume and maize-based cropping system, market oriented (10% of the sampled farms)
Type 2 was characterized by the largest farm areas (average of 6.3 ha), with just over a third of the area cropped to maize (one of the lowest maize ratios among types) and another third to legumes (one of the largest legume ratios among types). Type 2 relied heavily on the sale of crop products: more than half of all crop products were sold on the market (). It exhibited the second largest animal herds (on average 7 cows, 4 goats and 3 sheep). The relatively large household provided most of the total labour input per year (low hired labour ratio).
3.1.3 Type 3. Medium resource-endowed with herd dominated by small ruminants, legume-and maize oriented, on-farm labour intensive (13% of the sampled farms)
For Type 3, the main distinguishing features included herd composition and total labour input per year (). The herd exhibited a relatively small size (2.4 TLU) and consisted mainly (about 80%) of small ruminants (on average no cattle, 9 goats and 9 sheep). Labour hours per year were the highest for this farm type, with a relatively large proportion of hired labour (about 8%). With 5.2 ha on average, this group cultivated the second largest area, of which a third was cropped to maize and a third to legumes ().
3.1.4 Type 4. Medium resource-endowed with herd dominated by small ruminants, ample hired labour and farm income provided mostly by crop product sales (46% of the sampled farms)
Type 4 was the largest cluster. It is distinguishable from the others types mainly by its larger hired labour ratio counter-balancing its small household size (). Total labour input was low for this farm type, especially considering the medium sized land area (about 3.5 ha), but the share of hired labour was the highest at 14%. The cultivated land area, dominated by maize and legumes, provided most household income through crop product sales (almost 50% of all crop products were marketed) (). The size of the herd was relatively small (1.9 TLU) and mostly (70%) comprised of small ruminants (about 1 cow, 6 goats and 6 sheep).
3.1.5 Type 5. Resource constrained, maize-based cropping system and almost no income generated by off/non-farm activities (14% of the sampled farms)
Type 5 exhibited the smallest farm areas (about 2.5 ha), mostly dominated by maize (about 74% of the arable land) and the lowest legumes proportion compared to other clusters (only 4%). This cluster also had the lowest share of off/non-farm income (about 8%). Herd size was generally quite small and animal production was centred on small ruminants and poultry (average ownership of 1 cow, 6 goats, 9 sheep and 34 poultry). Total labour hours per year were relatively low ().
3.1.6 Type 6. Severely resource constrained, with a small herd dominated by poultry, income generated from livestock product sales and off-farm activities (6% of the sampled farms)
Type 6 was the smallest cluster, characterized by small cropped area (2.6 ha, with about 47% allocated to maize) with the lowest total labour hours per year and smallest herd size (). Livestock (about 0.3 TLU) consisted almost entirely of poultry (about 89%). The main income resource was livestock product sales (about 42%), complemented by income from off-farm activities (about 25%). Furthermore, in contrast to similarly land-constrained Type 5, household size was small ().
3.2 Farming system patterns
Studies have shown that the differentiating characteristics of farming systems are driven by site-specific opportunities and constraints that in turn are shaped by various factors beyond the household scale at the community, landscape, and regional levels (such as agro-ecology, markets, institutions, traditional land tenure and inheritance systems) [Citation15,Citation78,Citation79,Citation84]. These differences influence the coping and adaptive strategies of farmers in the face of shocks (volatile prices, crop failure, droughts, unexpected expenditures etc.) and stresses (declining soil fertility, climate change, land scarcity etc.), as well as their interest and capacity to take advantage of potential opportunities for the sustainable intensification of their farms [Citation13,Citation84]. In the following sections, the determinants and implications of farming system diversity are discussed in relation to clustering variables (grouped according to theme), their interrelationships and the identified farm types within the context of the case study area.
3.2.1 Household
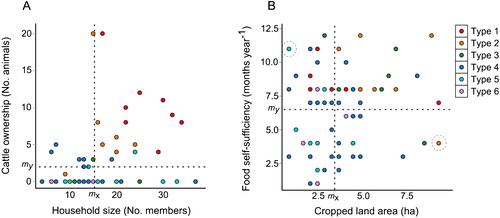
The literature suggests that the size and composition of the domestic group varies according to the rank, occupation, wealth and maturity of its household head [Citation63,Citation66]. Our analysis revealed a strong positive correlation between household size and herd size; the latter constituting an important indicator of wealth [Citation54] (A). In particular, Type 1 farm households with larger herds that included valuable cattle, tended to exhibit above-average household sizes (A and G). Interestingly, Type 1 households were also headed by the oldest men (see Supplementary material).
3.2.2 Land use
Among the patrilineal Dagomba, land is inherited by the household head and typically fragmented into smaller parcels that are allocated to household members [Citation65,Citation66]. Other less common access routes to land include purchase and borrowing [Citation83]. Results revealed differences in mean farm size across types, with Type 2 exhibiting the largest cropped land areas on average (D). Interestingly, Type 2 farmers were not surveyed in Botingli, the smallest intervention community (A). This could be due to survey selection bias leading to under-coverage of Type 2 farmers, or scarcity of land compounded by the close proximity of neighbouring villages (Iddrisu Baba Mohammed, 2014: pers. comm.). The latter hypothesis seems plausible, given that mean surveyed farm sizes in Botingli were smaller than those of Tingoli or Kpalung.
The two crop variables retained in this study; maize ratio and legume ratio, bore a strong negative correlation to each other, suggesting that farms which dedicated large areas to maize did so at the expense of legume crops and vice versa (A). Furthermore, the share of land allocated to maize tended to increase as the overall cultivated area decreased (A). Studies in Ghana and elsewhere in Africa have shown that farm size correlates positively with holdings of livestock and other assets, and is a proxy for the wealth of a household, associated in turn with high-value crop production and market participation (e.g. [Citation15,Citation62,Citation78]. Results seem to indicate that less affluent households with smaller farms allocated more of their land to maize than their wealthier counterparts. For example, Type 5 households exhibited the smallest cropped areas and the highest maize ratio (E). Maize is the most widely consumed staple in the Northern Region and the higher proportion of this crop in Type 5 suggests that limited land resources may be preferentially allocated for production oriented toward food security [Citation13,Citation60]. Legumes, primarily produced as cash crops, were most abundant among some medium- and well-endowed farm households (Types 2⿿4). Well-endowed Type 1 did not follow this pattern, however; despite exhibiting considerable capital assets in the form of livestock, mean farm sizes were relatively small and cropped mostly to maize (D, E and G). This may be partially explained by their above-average engagement in non-farm income-generating activities (J) and apparent re-investment of that income in livestock rather than land.
3.2.3 Livestock
The rearing of livestock is a crucial form of fortification against (food) insecurity in Northern Ghana [Citation70]. Livestock represent the most important store of value for farmers and the wealth of a household can be measured by the number and species of animals owned [Citation23,Citation27,Citation56].
Cattle are the most valuable livestock and may be inherited- they are rarely sold except in times of extreme shock such as crop failure or famine [Citation54]. Results showed that Type 1 farm households possessed the most animals and the largest cattle herds, followed by Type 2 (G). The average share of marketed livestock products was also the lowest for these two farm types, demonstrating the farmers⿿ capacity to accumulate assets that decrease their vulnerability (L). According to the literature, it is common for farmers to gradually stock their herds in response to favourable agricultural seasons when proceeds from crop sales may be re-invested in livestock (e.g. [Citation79]. In addition to being stores of wealth that provide a buffer against shocks, the large cattle herds owned by Types 1 and 2 produce manure, thus putting these farmers at an advantage in terms of agronomic practices that may lead to improved soil fertility and crop productivity [Citation9,Citation18,Citation60].
Small ruminants are less valued but are more commonly owned in the Northern Region due to their hardy and prolific nature. They may also be sold during stressful periods for immediate cash to purchase food or pay medical bills, for example [Citation54]. Except for Type 6, mean small ruminant numbers tended to be quite similar across farm types. The ratios, however, were highest for medium- to low resource-endowed Types 3⿿5 (H).
Finally, almost all the sampled farm households kept a flock of family poultry as a source of quick cash, (sacrificial) gifts, and protein-rich food [Citation54]. Results indicated that the mean poultry ratio tended to increase as farm resource endowment decreased (I). Furthermore, the variables of poultry ratio and livestock sales were strongly positively correlated (B). Keeping poultry is financially economical for smallholders because little input (land, labour, capital) is required for the maintenance of a flock. This enables even those of the poorest strata in rural communities to make a profit from the sale of poultry products [Citation42]. Type 6 exemplified this⿿it was characterized by a near total absence of any livestock besides poultry, while exhibiting the highest percentage of livestock sales (G, I and L). Tellingly, food self-sufficiency was also lowest for this type (see Supplementary material), suggesting that the liquidation of livestock assets represented a coping strategy to cover household needs. Additionally, these farmers generally lack access to animal traction and organic fertilizers, resulting in low productivity of crop production which may further exacerbate food insecurity [Citation79,Citation82].
3.2.4 Labour
In Northern Ghana labour is an important factor of agricultural production, and a combination of family, hired and communal exchange labour is used [Citation70]. Family labour is based on kinship ties and considered to be the traditional backbone of the rural workforce. The exchange labour system takes the form of ⿿work gangs⿿⿿farmers who pool their labour, taking turns working in different members⿿ fields [Citation6]. Wage labourers are hired on a seasonal basis for activities such as labour-intensive land preparation [Citation63].
Household size is commonly taken as a proxy for family labour availability, thereby positioning the hiring of help as a way to deal with family labour shortage [Citation58,Citation82]. Contrary to what we would expect, our results revealed only a weak negative correlation between the hired labour ratio and household size (A). This might be explained by the fact that a healthy exchange labour system exists in the study area (Iddrisu Baba Mohammed, 2014: pers. comm.), which seemed to absorb most labour demands, thus keeping the mean hired labour ratio low across farm types.
Results also suggested that total on-farm labour input per year (family-, exchange and hired labour) was highest amongst households with larger cropped areas and/or animals herds (Types 1⿿3), presumably due to the correspondingly higher work and maintenance requirements [Citation48].
Finally, the variables of total labour input and legume ratio were positively correlated (), probably attributable to the higher labour-intensity required for legume (especially groundnut) cultivation [Citation36].
3.2.5 Income
Shortfalls in agricultural production are common in the harsh agro-ecological conditions of the Northern Region, compelling rural households to diversify their livelihoods [Citation30,Citation15,Citation67]. Income may be sourced from on-farm (crop- and livestock income), off-farm (agricultural income), and non-farm activities (non-agricultural income) [Citation29].
Recorded sources of off-farm income in the case study area included casual wage labour on other farms, while non-farm income sources included trading, remittances, artisanal activities, salaried work and transport services (in order of recorded frequency). Nevertheless, dependence on off/non-farm income sources was found to be quite low among most farm types (J). This may be explained in part by the remoteness and associated dearth of off-farm opportunities in the Northern Region, compared to the rest of the country [Citation14,Citation49]. However, the average share of off/non-farm income for high resource-endowed Type 1 was exceptionally high at 32%, and for low resource-endowed Type 6 the corresponding percentage was also relatively high at 25% (J).
Research on rural livelihood strategies suggests that more affluent farmers may be better disposed to participate in non-farm work [Citation67] and as incomes increase, farm households tend to shift their investments to non-agricultural activities [Citation5,Citation37,Citation82]. According to the survey data, the majority of the Type 1 farmers were involved in trading of one kind or another. Less affluent households, on the other hand, tend to depend on agriculture or are generally limited to low-paid activities in the off-farm sector, such a seasonal work as hired labourers on the farms of wealthier neighbours [Citation14]; Ellis, 2003; [Citation56]; Reardon, 1997). However, none of the Type 6 farmers indicated involvement in casual labour. On the other hand, a third were recipients of remittances; a complementary source of income resulting from rural-urban migration. Migrant households are reportedly smaller [Citation21,Citation2] and labour constrained [Citation1] due to out-migration of able-bodied household members- characteristics consistent with Type 6.
Finally, analysis of the spatial allocation of farm types revealed that 75% of the Type 1 farm households were located in Tingoli, a community situated in close proximity to the market town of Nyankpala in Tolon-Kumbungu, which is also the base of a number of agricultural research and development institutions (C). The distance to market can be used as a determinant of non-farm income [Citation56], while travel out of the community to urban areas provides exposure to new information and technologies [Citation60]. This finding suggests, therefore, that superior access to expert knowledge on improved farming practices as well as off/non-farm opportunities may have played a role in the developmental trajectory of farm households in Tingoli.
3.3 The typology as a framework for innovation targeting
The communities of the case study area comprise farming systems with heterogeneous characteristics. The suitability of potential agricultural support measures should therefore be assessed in relation to type-specific farm household opportunities and constraints, using the established typology as a framework (c.f. [Citation33,Citation64,Citation78,Citation28] (). Nevertheless, we recognize that it is challenging to fully capture the diversity of the farming systems and acknowledge the limitations of the typology in this regard. The following sections reflect on these two points.
Table 3 Main implications of the farm typology for targeting of agricultural interventions in Savelugu-Nanton and Tolon-Kumbungu districts of Ghana⿿s Northern Region.
3.3.1 Opportunities and constraints for targeting
3.3.1.1 High resource-endowed farms
The typology revealed that 21% of the sampled farm households were relatively well-endowed, comprising Types 1 and 2. It appears that endowed households employ a broader range of strategies against production-related risks; such as diversification into higher value crops, collective marketing, (bulk) purchase of inputs, and the judicious sale of some assets [Citation24,Citation70,Citation82]. Furthermore, their characteristics may facilitate wider exploration of opportunities for farm development (Type 2) as well as ⿿stepping out⿿ [Citation26,Citation78] into non-farm activities (Type 1). This has implications for innovation targeting. For example, the large farm sizes of Type 2 allude to greater investment in on-farm activities, and thus better incentives for adoption of improved agricultural technologies and practices [Citation60]. The larger household sizes associated with Type 1, in turn, may increase the likelihood of experimentation with diverse crop combinations and varieties in order to accommodate the diverse preferences of household members [Citation9,Citation34]. Additionally, these farm types could be encouraged to adopt practices that ensure more efficient collection, storage, and use of the manure supplied by their large cattle herds [Citation69]. Importantly; due to inter-household interactions, innovations that are taken up by more affluent farm households may have (unintended) effects beyond the spaces in which they operate. For example, if a farmer invests in a tractor, he or she might hire out that tractor to other farmers in the community for a nominal fee, thus conferring ⿿spill-over⿿ benefits to those who cannot afford to purchase a tractor [Citation15].
3.3.1.2 Medium resource-endowed farms
The largest share of the surveyed farm households were classified as moderately-endowed (59%), comprising Types 3 and 4. According to the 2007 MoFA study which disaggregated smallholders in 16 districts of Northern Ghana depending on their livelihood strategies, medium-endowed farmers pursue a ⿿development strategy⿿ [Citation25]. This strategy is based on saving through livestock (with resources acquired from crop sales or livestock husbandry) leading to both farm and off/non-farm investment along with increased responsiveness to commercial farming opportunities. Our study revealed a similar pattern, with Types 3 characterized by medium sized small ruminant herds, moderate to large farm areas allocated to cash crops and some sales of assets. Type 4 exhibited comparable features, albeit at smaller scales. These types could be described as ⿿stepping up⿿ [Citation26,Citation78]. In terms of targeting, then, opportunities for agricultural expansion and optimization may be investigated, especially for more vulnerable and heterogeneous Type 4 which represents the bulk of the surveyed households and appears to be straddling the boundary between low- and medium-endowment. However as previously described, the smaller households of the latter tend to limit the manpower available for on-farm labour, thus driving up the hired labour ratio. This should be taken into account if potentially labour-intensive technologies or practices are to be promoted, such as legume production intensification [Citation36]. Regarding livestock integration, the majority of medium resource-endowed farmers do not own any cattle or kraals; therefore innovations such as the use of compost as a soil amendment or the procurement of donkeys as a low-cost alternative for transportation and tillage traction, as suggested by Bellwood-Howard [Citation9], may be considered.
3.3.1.3 Low resource-endowed farms
Poorly-endowed households comprised 20% of the surveyed sample and were represented by Types 5 and 6. These seemed to correspond to the ⿿poor⿿ and ⿿vulnerable⿿ groups identified by MoFA [Citation59] respectively; considered to be particularly exposed to risk as a result of constrained resources (typically a few inherited assets). These farm households could be described as ⿿hanging in⿿ [Citation26,Citation78]; a situation where vulnerability reduces possibilities for saving and investment, and maintenance of the current livelihood through subsistence farming is the priority. When hit by a shock, they may be forced to adopt a ⿿survival strategy⿿ simply in order to cover immediate expenses [Citation25]. Invariably, this implies the sale of household valuables such as livestock, food rationing, petty trade, cheap wage labour, migration, withdrawal of children from school or reliance on communal support networks for assistance [Citation6,Citation14,Citation59,Citation70]. Tactics such as these often result in a downward spiral, reducing even further any opportunities to climb out of the ⿿poverty trap⿿ [Citation79].
Impoverished households thus face the strongest constraints to investing in new technologies and therefore, interventions should focus on alleviating basic challenges such as food insecurity; while innovations should be geared towards improving these farmers⿿ ability to accumulate capital and reinvest in their farms [Citation15]. For example, low resource-endowed households tend to struggle to achieve food self-sufficiency ( and Supplementary material), often selling their produce immediately after harvest when prices are lowest to meet immediate cash needs, as well as purchasing food supplies for the rest of the year [Citation79]. Better postharvest storage facilities may benefit such farmers, allowing them to store produce for home consumption and sell later in the season when prices are higher [Citation60,Citation70].
Because poorer farmers tend to depend on wealthier cattle owners for animal traction and manure [Citation79], the possibilities for redressing this imbalance through alternative tillage traction options (as described for medium-endowed farmers) or the use of compost or poultry manure as fertilizer, may be investigated [Citation9]. Furthermore, while barriers to non-farm work should be reduced, thus enabling livelihood opportunities beyond the farming sector (Type 5), policies should also be geared towards dealing with loss of on-farm labour (to migration, for example⿿Type 6) [Citation56]. Finally, it is acknowledged that instead of promoting isolated solutions or single technological innovations, strategies for lifting poor households above certain critical thresholds would have to trigger complete ⿿system shifts⿿ in order to induce sustainable change [Citation79].
3.3.2 Typology limitations
It is challenging to fully capture the diversity encountered in the farming systems of the study area and it is recognized that the typology is limited in its ability to accurately represent every variation that exists [Citation20,Citation46,Citation53]. For example, the smallest identified cluster, Type 6, represents the most vulnerable group of the typology, and it could be argued that development efforts should prioritize these households. However, it appears that other categories of groups widely considered to be vulnerable in rural Ghana were absent from the surveyed sample, such as landless and female-headed households [Citation84]. Furthermore, given the small sample size, the distinction between true outliers (i.e. observations that were not representative of the sample, such as positive deviants) and artificial outliers (i.e. observations that were representatives of small, under-sampled sub-groups) was hard to make. Hence, a trade-off between the representative quality and level of manageable detail of the typology had to be negotiated in the classification process [Citation43]. Added to this is the dynamic nature of agriculture which guarantees that typologies expire- they only provide a fleeting snapshot of farm situations in time [Citation32].
All these complexities are reflected in the farm types themselves, which should therefore be interpreted with caution. For example, while analysis of livestock ownership patterns allowed for clear differentiation between larger households that tended to own cattle (Types 1 and 2) and smaller ones that tended not to (A); the relationship between farm size and food self-sufficiency revealed a fuzzier reality. B highlights a severely land-constrained Type 5 household with high food self-sufficiency, and a well-endowed Type 2 household with below-average food self-sufficiency. The atypical characteristics of these two farm households diverged from a mean profile of farm types which seemed to imply that higher resource-endowed types enjoyed higher levels of food self-sufficiency than their lower resource-endowed counterparts, on average (see Supplementary material). Such cases may reflect survey inaccuracies attributable to erroneous farmer estimates, or they may reflect the limits of standard survey representations, which often fail to capture the more intangible dimensions of rural livelihoods such as (lack of) extra-household social relationships, networks, etc. [Citation72].
4 Conclusions
While the typology revealed the general underlying structure of farming system heterogeneity, the complex and dynamic coexistence of diverse farm households in space and time was only partially captured, as neither un(der)-represented groups nor system trajectories were specifically accounted for. Nevertheless, analysis of the established farm types suggests that the patterns of their persistence are rooted in the self-reinforcing ⿿poverty traps⿿ of a system which privileged wealthier over poorer farmers. These patterns of persistence allowed identification of the most promising targeting pathways for improvement of farmer livelihoods. Research-for-development programs seeking to sustainably intensify agricultural production in the target communities should take into account the opportunities and constraints identified across the farm types and tailor their development strategies, interventions and policies accordingly. The results of this typology analysis will be used in the Africa RISING project for further analysis of suitability of entry points for farm and livelihood improvement. For each of the farm types, the effects of interventions proposed by the project will be evaluated for productive, socio-economic and environmental performance in participatory, model-based studies and on-farm experimentation [Citation41,Citation40]. It is expected that the type-specific exploration of trade-offs and synergies among performance indicators and the further analysis of intra-household interactions and dynamics will allow formulation of innovation pathways that are appropriate for each level of endowment and livelihood strategy as captured in the typology (c.f. [Citation19].
Further insight into the drivers of diversity and its consequences might be gained through incorporation of complementary perspectives on farming system diversity, for example through the participation of farmers themselves in typology construction. It has been suggested that while quantitative, objective techniques provide reproducible and generalizable results; qualitative, participatory methods potentially deliver greater depth of understanding of the complexity of local circumstances and are useful for contextualizing heterogeneity within the rural landscape [Citation33,Citation52,Citation80]. Therefore, it is recommended that future typological studies go a step further and adopt a more flexible approach by incorporating qualitative and quantitative; participatory and statistical methods (e.g. [Citation7,Citation22,Citation68,Citation74].
Supplementary Material
Download MS Word (86.2 KB)Acknowledgements
This study was conducted within the Africa RISING research-for-development program in Ghana that is led by the International Institute of Tropical Agriculture (IITA). The authors would like to thank Dr. Asamoah Larbi and Obeng Fosu-Brempong (IITA), for providing logistics for the survey work. The authors also thank John Bidzan and Kwame Kwarteng (IITA) for coordinating the survey data collection activities. The authors acknowledge the effort of the enumerators Shaibu Azuma, Fuseini Abdulai, Confort Ayiripo, Imoro Abu Kassim, Fatima Iddris, Natar Job Jonah, and Alhassan N. Zakaria in the Northern Region. The research was funded by the United States Agency for International Development (USAID) as part of the US Government⿿s Feed the Future Initiative. The contents are the responsibility of the producing organizations and do not necessarily reflect the opinion of USAID or the U.S. Government.
Notes
1 This refers to wealth-related variables such as farm size, livestock ownership and household size [Citation78].
Related Research Data
References
- A.A.AdakuThe effect of rural-urban migration on agricultural production in the Northern Region of GhanaJ. Agric. Sci. Appl.242013193201
- H. RichardAdamsJr.A.CuecuechaJ.PageThe impact of remittances on poverty and inequality in GhanaWorld Bank Policy Res. Work. Pap. Ser.20084732
- J.O.AdikwuHousehold size and agricultural land-use pattern in Obagaji area of the Guinea Savanna region, NigeriaJ. Agric. Ext. Rural Dev.6120144854
- S.Adjei-NsiahC.LeeuwisK.E.GillerO.Sakyi-DawsonJ.CobbinaT.W.KuyperW.AbekoeW.Van Der WerfLand tenure and differential soil fertility management practices among native and migrant farmers in Wenchi, Ghana: implications for interdisciplinary action researchNJAS⿿Wagening. J. Life Sci.5232004331348
- S.Adjei-NsiahC.LeeuwisO.Sakyi-DawsonK.E.GillerT.W.KuyperExploring diversity among farmers for orienting inter-disciplinary action research on cropping system management in Wenchi, Ghana: the significance of time horizonsInt. J. Agric. Sustainability52⿿32007176194
- R.Al-HassanC.PoultonAgriculture and social protection in GhanaFuture Agric. Consort. Work. Pap.2009(SP04)
- S.AlvarezW.PaasK.DescheemaekerP.TittonellJ.C.J.GrootConstructing Typologies, a Way to Deal with Farm Diversity: General Guidelines for the Humidtropics. Report for the CGIAR Research Program on Integrated Systems for the Humid Tropics2014Wageningen University, Plant Sciences GroupWageningen, The Netherlands
- E.AndersenB.ElbersenF.GodeschalkD.VerhoogFarm management indicators and farm typologies as a basis for assessments in a changing policy environmentJ. Environ. Manage.8232007353362
- I.Bellwood-HowardDonkeys and bicycles: capital interactions facilitating timely compost application in Northern GhanaInt. J. Agric. Sustainability1042012315327
- G.BennehSmall-scale farming systems in GhanaAfrica4321973134146
- J.C.BidogezaP.B.M.BerentsenJ.De GraaffA.O.LansinkA typology of farm households for the Umutara Province in RwandaFood Secur.132009321335
- D.ByerleeM.CollinsonR.PerrinD.WinkelmannS.BiggsE.MoscardiJ.MartinezL.HarringtonA.BenjaminPlanning technologies appropriate to farmers: concepts and proceduresInt. Maize Wheat Improv. Cent.1980
- J.ChamberlinDefining Smallholder Agriculture in Ghana: Who Are Smallholders, What Do They Do and How Are They Linked with Markets? GSSP Background Paper 62007International Food and Policy Research InstituteWashington, DC
- J.ChamberlinIt's a Small World After All: Defining Smallholder Agriculture in Ghana. Discussion Paper 008232008International Food and Policy Research InstituteWashington, DC
- A.ChapotoA.MabisoA.BonsuAgricultural Commercialization, Land Expansion, and Homegrown Large-scale Farmers: Insights from Ghana. Discussion Paper 012862013International Food and Policy Research InstituteWashington, DC
- M.D.ChavezP.B.M.BerentsenA.G.J.M.Oude LansinkCreating a typology of tobacco farms according to determinants of diversification in Valle de Lerma (Salta-Argentina)Span. J. Agric. Res.822010460471
- D.ChesselA.B.DufourJ.ThioulouseThe ade4 package⿿i: one-table methodsR-News412004510
- R.ChikowoS.ZingoreS.SnappA.JohnstonFarm typologies, soil fertility variability and nutrient management in smallholder farming in Sub-Saharan AfricaNutr. Cycl. Agroecosyst.10012014118
- J.Cortez-ArriolaJ.C.J.GrootW.A.H.RossingJ.M.S.ScholbergR.D.AméndolaP.TittonellAlternative options for sustainable intensification of smallholder dairy farms in North-West Michoacán, MexicoAgric. Syst.14420162232
- J.Cortez-ArriolaW.A.RossingR.D.A.MassiottiJ.M.ScholbergJ.C.GrootP.TittonellLeverages for on-farm innovation from farm typologies? An illustration for family-based dairy farms in north-west Michoacán, MexicoAgric. Syst.13520156676
- B.DavisP.WintersG.CarlettoK.CovarrubiasE.QuinonesA.ZezzaK.StamoulisG.BonomiS.DiGuiseppeRural Income Generating Activities: A Cross-Country Comparison. ESA Working Paper No 07-162007Food and Agriculture Organization of the United NationsRome
- C.Den BiggelaarM.A.GoldThe use and value of multiple methods to capture the diversity of endogenous agroforestry knowledge: an example from RwandaAgrofor. Syst.301995263275
- S.DerconWealth, risk and activity choice: cattle in Western TanzaniaJ. Dev. Econ.5511998142
- S.DerconIncome risk, coping strategies, and safety netsWorld Bank Res. Obs.1722002141166
- S.DevereuxLinking Social Protection and Support to Small Farmer Development2008Food and Agriculture Organization of the United NationsRome
- A.DorwardS.AndersonY.N.BernalE.S.VeraJ.RushtonJ.PattisonR.PazHanging in, stepping up and stepping out: livelihood aspirations and strategies of the poorDev. Pract.1922009240247
- L.H.DossaA.AbdulkadirH.AmadouS.SangareE.SchlechtExploring the diversity of urban and peri-urban agricultural systems in Sudano-Sahelian West Africa: an attempt towards a regional typologyLandscape Urban Plann.10232011197206
- S.DouxchampsA.AyantundeE.K.PanyanK.OuattaraA.KaboréN.KarboB.SawadogoAgricultural water management and livelihoods in the crop⿿livestock systems of the Volta BasinWater Resour. Rural Dev.6201592104
- F.EllisHousehold strategies and rural livelihood diversificationJ. Dev. Stud.3511998138
- F.EllisThe determinants of rural livelihood diversification in developing countriesJ. Agric. Econ.5122000289302
- J.Ellis-JonesA.LarbiI.Hoeschle-ZeledonI.Y.DugjeI.A.TeliS.S.J.BuahR.A.L.KantonJ.M.KombiokA.Y.KamaraI.GyamfiSustainable Intensification of Cereal-based Farming Systems in Ghana⿿s Guinea Savanna: Constraints and Opportunities Identified with Local Communities2012International Institute of Tropical AgricultureIbadan, Nigeria
- N.EmtageJ.HerbohnS.HarrisonLandholder typologies used in the development of natural resource management programs in Australia⿿a reviewAustralas. J. Environ. Manage.13220067994
- N.EmtageJ.HerbohnS.HarrisonLandholder profiling and typologies for natural resources management policy and program supportEnviron. Manage.402007481492
- P.M.EtwireT.AbdoulayeK.Obeng-AntwiS.S.BuahR.A.KantonH.AsumaduJ.C.EtwireOn-farm evaluation of maize varieties in the transitional and savannah zones of Ghana: determinants of farmer preferencesJ. Dev. Agric. Econ.562013255262
- FAOStatistical Yearbook 2014: Africa Food and Agriculture Accra2014Food and Agriculture Organization of the United Nations, Regional Office for AfricaGhana
- A.C.FrankeE.D.BerkhoutE.N.O.IwuaforG.NziguhebaG.DerconI.VandeplasJ.DielsDoes crop-livestock integration lead to improved crop production in the savanna of West Africa?Exp. Agric.4642010439455
- R.FrelatS.Lopez-RidauraK.E.GillerM.HerreroS.DouxchampsA.A.DjurfeldtM.T.van WijkDrivers of household food availability in sub-Saharan Africa based on big data from small farmsProc. Natl. Acad. Sci. U.S.A.11322016458463
- L.O.FrescoE.WestphalA hierarchical classification of farm systemsExp. Agric.241988399419
- K.GillerCan we define the term ⿿farming systems'? A question of scaleOutlook Agric.4232013149153
- J.C.J.GrootG.J.M.OomenW.A.H.RossingMulti-objective optimization and design of farming systemsAgric. Syst.11020126377
- J.C.J.GrootW.A.H.RossingModel-aided learning for adaptive management of natural resources: an evolutionary design perspectiveMethods Ecol. Evol.22011643650
- E.F.GuèyeThe role of family poultry in poverty alleviation, food security and the promotion of gender equality in rural AfricaOutlook Agric.2922000129136
- J.F.HairW.C.BlackB.J.BabinR.E.AndersonMultivariate Data Analysisseventh ed.)2010PearsonNew Jersey
- F.HussonS.LêJ.PagèsExploratory Multivariate Analysis by Example Using R2011Chapman & Hall/CRC PressBoca Raton, Florida
- International Institute of Tropical Agriculture, International Food Policy Research Institute and International Livestock Research Institute (2012). Africa Research in Sustainable Intensification for the Next Generation (Africa RISING) Program Framework 2012⿿20162012International Livestock Research InstituteNairobi, Kenya
- B.IrairozM.GortonS.DavidovaSegmenting farms for analysing agricultural trajectories: a case study of the Navarra region in SpainAgric. Syst.931⿿32007143169
- H.E.JahnkeG.TacherP.KeilD.RojatLivestock Production in Tropical Africa with Special Reference to the Tsetse-afferent Zone1987International Livestock Centre for Africa and International Laboratory for Research on Animal DiseasesNairobi, Kenya
- T.S.JayneT.YamanoM.T.WeberD.TschirleyR.BenficaA.ChapotoB.ZuluSmallholder income and land distribution in Africa: implications for poverty reduction strategiesFood Policy2832003253275
- B.KellyR.BeningIdeology, regionalism, self-Interest and tradition: an investigation into contemporary politics in northern GhanaAfr. Aff.7722007180206
- J.KostrowickiAgricultural typology concept and methodAgric. Syst.219773345
- C.KöbrichT.RehmanM.KhanTypification of farming systems for constructing representative farm models: two illustrations of the application of multivariate analysis in Chile and PakistanAgric. Syst.762003141157
- K.S.KuivanenM.MichalscheckK.DescheemaekerS.Adjei-NsiahS.Bedi-MellonJ.C.J.GrootS.AlvarezA comparison of statistical and participatory clustering of smallholder farming systems⿿a case study in Northern GhanaJ. Rural Stud.2016(in press)
- E.LandaisModelling farm diversity: new approaches to typology building in FranceAgric. Syst.5841998505527
- W.LaubeChanging Natural Resource Regimes in Northern Ghana: Actors Structures and Institutions2007LIT VerlagMünster
- L.LebartA.MorineauM.PironStatistique Exploratoire Multidimensionnelle [Exploratory Multivariate Statistics]1995DunodParis
- F.MarchettaMigration and nonfarm activities as income diversification strategies: the case of Northern GhanaCan. J. Dev. Stud.3412013121
- J.C.McKinneyTypification, typologies, and sociological theorySoc. Forces4811969112
- E.J.MensahLand tenure regimes and land conservation in the African drylands: the case of Northern GhanaJ. Land Use Sci.2014121(in press)
- Ministry of Food and AgricultureRural Livelihoods in Ghana Policy Planning, Monitoring and Evaluation Directorate2007Ministry of Food and AgricultureAccra, Ghana
- M.L.MorrisR.TrippA.A.DankyiAdoption and Impacts of Improved Maize Production Technology: A Case Study of the Ghana Grains Development Project. Economics Program Paper 99-011999International Maize and Wheat Improvement Centre
- M.MortimoreW.M.AdamsWorking the Sahel: Environment and Society in Northern Nigeria1999RoutledgeLondon
- A.NegashA.NiehofThe significance of enset culture and biodiversity for rural household food and livelihood security in south western EthiopiaAgric. Hum. Values21120046171
- G.K.NgelezaR.OwusuaK.JimahS.KolavalliCropping Practices and Labor Requirements in Field Operations for Major Crops in Ghana: What Needs to Be Mechanized? Discussion Paper 10742011International Food Policy Research Institute
- D.NormanM.CollinsonFarming systems research in theory and practiceJ.RemenyiAgricultural Systems Research for Developing Countries, ACIAR Proceedings No. 111985Australian Council for International Agricultural ResearchCanberra, Australia
- K.Ohene-YankyeraDeterminants of farm size in land-abundant agrarian communities of Northern GhanaJ. Sci. Technol.24220044553
- C.OppongLocal migration in northern GhanaGhana J. Sociol.311967116
- V.OwusuA.AwuduS.Abdul-RahmanNon-farm work and food security among farm households in Northern GhanaFood Policy362011108118
- G.C.PaciniD.ColucciF.BaudronE.RighiM.CorbeelsP.TittonellF.M.StefaniniCombining multi-dimensional scaling and cluster analysis to describe the diversity of the rural householdsExp. Agric.5032014376397
- C.QuansahP.DrechselB.B.YirenkyiS.Asante-MensahFarmers' perceptions and management of soil organic matter⿿a case study from West AfricaNutr. Cycl. Agroecosyst.611⿿22001205213
- W.QuayeFood security situation in Northern Ghana, coping strategies and related constraintsAfr. J. Agric. Res.352008334342
- Quiñones, E.J., Diao, X., 2011. Assessing Crop Production and Input Use Patterns in Ghana: What Can We Learn from the Ghana Living Standards Survey (GLSS5). IFPRI Ghana Strategy Support Program Working Paper, 24.
- S.RandallE.CoastPoverty in African households: the limits of survey and census representationsJ. Dev. Stud.2014116(in press)
- A.P.ReynoldsG.RichardsB.de la IglesiaV.J.Rayward-SmithClustering rules: a comparison of partitioning and hierarchical clustering algorithmsJ. Math. Modell. Algorithms52006475504
- E.RighiS.DogliottiF.M.StefaniniG.C.PaciniCapturing farm diversity at regional level to up-scale farm level impact assessment of sustainable development optionsAgric. Ecosyst. Environ.142120116374
- P.J.RousseeuwSilhouettes: a graphical aid to the interpretation and validation of cluster analysisJ. Comput. Appl. Math.2019875365
- R.SansoucyM.JabbarS.EhuiH.FitzhughKeynote paper: the contribution of livestock to food security and sustainable developmentR.WilsonS.EhuiS.MackLivestock Development Strategies for Low Income Countries. Proceedings of the Joint FAO/ILRI Roundtable on Livestock Development Strategies for Low Income Countries27 February⿿2 March, 1995. Addis Ababa, Ethiopia, ILRI(1995)
- C.TimlerM.MichalscheckC.KlapwijkN.MashingaidzeM.OllenburgerG.FalconnierK.KuivanenK.DescheemaekerJ.GrootCharacterization of Farming Systems in Africa RISING Intervention Sites in Malawi, Tanzania, Ghana and Mali2014International Institute of Tropical AgricultureIbadan, Nigeria
- P.TittonellA.MuriukiK.ShepherdD.MugendiK.C.KaizziJ.OkeyoL.VerchotR.CoeB.VanlauweThe diversity of rural livelihoods and their influence on soil fertility in agricultural systems of East Africa⿿a typology of smallholder farmsAgric. Syst.10320108397
- P.TittonellLivelihood strategies, resilience and transformability in African agroecosystemsAgric. Syst.1262014314
- S.WhatmoreFarm household strategies and styles of farming: assessing the utility of farm typologiesJ.D.Van der PloegA.LongBorn from Within: Practice and Perspectives of Endogenous Rural Development1994Van GorcumThe Netherlands
- S.WigginsCan the Smallholder Model Deliver Poverty Reduction and Food Security for a Rapidly Growing Population in Africa? Proceedings of the Expert Meeting on How to Feed the World in 20502009Food and Agriculture OrganizationRome
- N.A.WireduK.O.GyasiT.AbdoulayeD.SanogoA.LangyintuoCharacterization of Maize Producing Households in the Northern Region of Ghana Country Report⿿Ghana2010CSRI/SARI⿿International Institute of Tropical AgricultureIbadan, Nigeria
- J.A.YaroCustomary tenure systems under siege: contemporary access to land in Northern GhanaGeoJournal7522010199214
- J.A.YaroThe Social Dimensions of Adaptation to Climate Change in Ghana. The World Bank Discussion Paper No.152010The World BankWashington DC
- E.K.YiridoeA.S.LangyintuoW.DogbeEconomics of the impact of alternative rice cropping systems on subsistence farming: whole-farm analysis in northern GhanaAgric. Syst.9112006102121
Appendix A
Supplementary data
Supplementary data associated with this article can be found, in the online version, at http://doi:10.1016/j.njas.2016.04.003.