
Highlights
| • | Contextual understanding of SA land reform programme is enhanced. | ||||
| • | Clarity of targeted beneficiaries determined programmes implementation outcomes. | ||||
| • | Beneficiary participation high in redistribution farms than in restitution farms. | ||||
| • | Context determined the extent of land use in redistribution farms. | ||||
| • | Cross-sectional studies critical to understanding land redistribution evolution. | ||||
Abstract
National challenges of food insecurity and unemployment in South Africa prompted an increase in expectations for agricultural land acquired through land reform programmes to make meaningful contributions. Embedded in these expectations is the need for understanding the situation in reformed farms. This study reviewed policies and literature on land reform, and analyzed beneficiary participation in reformed farms and the impact of land reform on land use in land restitution and land redistribution farms in the Waterberg District Municipality. Data were collected through individual surveys, key informants interviews and stakeholder workshop. Beneficiary participation levels were significantly lower in restitution farms (18% per farm) than in redistribution farms (65% per farm). The changes in land redistribution policy over time resulted in significant differences in beneficiary participation among land redistribution models, with participation levels increasing with time. Land redistribution model SLAG had the lowest beneficiary participation level (19% per farm) while the latest model PLAS had the highest (100% per farm). The changes in land redistribution policy over time resulted in significant differences in extent of land used among land redistribution models, though the trend was not systemic. On average, redistribution farms under SLAG and LRAD2 models used ≤70% of the farm land, while farms under LRAD1 and PLAS models used more than 90% of the farm land. The research approach used in this study found similar results in beneficiary participation to those in literature where case studies approach was used in restitution farms. On the contrary, in redistribution farms the research approach resulted in findings that differed from case study literature and revealed the needs for representative sample and time if conclusive recommendations were to be reached.
1 Introduction
The Native Land Act of 1913 played a key role in the restriction of native people of South Africa (SA) to occupy only 13% of the country’s land (CitationFeinberg, 1993; CitationLouw, 2013). This restriction resulted in huge differences in land holdings between people of European descent, who occupied on average 1600 ha per person and native people, who occupied only 1.3 ha per person (CitationDeininger, 1999). The birth of democratic SA in 1994 resulted in initiatives that aimed to benefit those who were discriminated against by the former apartheid government (CitationDOJ, 1996). One of these initiatives is land reform, which has been executed for the past two decades in SA. Land reform has social, economic, and political objectives (CitationMoyo, 2009). The emphasis each of the objectives receives is often a political issue, and mostly depends on prevailing societal circumstances. The SA land reform programme is being executed through three major programmes: land restitution, land redistributions and land tenure reform (CitationDLA, 1997). Land restitution aims to give back previously owned land or to provide alternative land or money to individuals whose land was taken away through racial discriminating laws and practices. Land redistribution aims to overcome racial imbalances in ownership and access to land by transferring land from people of European descent (the minority) to previously disadvantaged groups (the majority) for settlement and production purposes. Land tenure reform aims to secure rights of those who are already occupying land with insecure occupation rights (CitationDLA, 1997). Land restitution and land redistribution programmes get most priority because they comprise a transfer of large areas of land to targeted groups, which will impact land use and result in social, economic and ecological effects. This paper, therefore, focuses on land restitution and land redistribution programmes of the SA land reform programme.
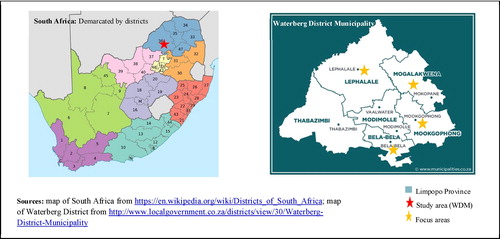
Land restitution policy and its implementation processes have not changed from 1994 to date. Land redistribution policy and its implementation processes were amended and adjusted over the years, in terms of targeted beneficiaries, identification of land to be reformed and land rights provided to beneficiaries. A beneficiary is an adult, historically disadvantaged (on race basis) South African citizen (a) who is legally competent to contract; (b) who has successfully claimed land that was taken away, or has been selected after meeting criteria set for land redistribution programme and; (c) whose name is on a farm beneficiary list at the time of land hand-over by the Department of Land Affairs (DLA) or the Department of Rural Development and Land Reform (DRDLR) (CitationDLA, 1997). Amendments and adjustments of the land redistribution programme have led to four distinguishable models: Settlement/Land Acquisition Grant (SLAG; active from 1995 till 2000); Land Redistribution for Agricultural Development Phase 1 (LRAD1; active from 2001 till 2007); Land Redistribution for Agricultural Development Phase 2 (LRAD2; active from 2008 till 2010); and Proactive Land Acquisition Strategy (PLAS; active from 2006 to date) (CitationDLA, 1997; CitationMALA, 2001; CitationDLA, 2006). Between 1994 and 2014, land reform processes resulted in the transfer of approximately 7.4 million hectares of land, of which 3.1 million hectares via restitution and 4.4 million hectares ha via redistribution programmes (CitationDRDLR, 2014). These 7.4 million hectares contribute 30% to the country’s land reform target for 2014 of 24.6 million hectares, and constitute only 9% of the 82 million hectares privately owned by commercial farmers (people of European descent) in SA. To our knowledge, land reform in SA has been studied only with few farms within programmes (CitationBradstock, 2005; CitationLahiff et al., 2008; CitationAliber and Cousins, 2013), or on farms within only one land reform programme (CitationWegerif, 2004; CitationValente, 2011; CitationAntwi and Oladele, 2013) and Antwi and Oladele. The aim of the present study is to generate knowledge that will contribute to a broader understanding of the SA land reform programme. For this purpose, we defined the following research questions (a) what were the implementation outcomes of land restitution and land redistribution policies (b) what are the levels of beneficiary participation in land reform farms (c) for which land uses and to what extent were the reformed farms being used (e) what are the research implications of studying land reform using a cross-sectional study with relatively high representation samples? We reviewed policy documents and scientific literature on land reform to compare policy intentions against the implementation outcomes and surveyed a relatively high number of farms under land reform. We have chosen the Waterberg District Municipality (WDM) in Limpopo province as a case study (), because it is a district with a relatively large contribution to land reform (CitationDRDLRa, 2017), i.e. it constitutes 29% and 59% of the provincial restituted and redistributed land.
2 Methods
2.1 Study area
Waterberg District Municipality (WDM) was chosen as the study area because of high prevalence of land reform farms (CitationDRDLRa, 2017) and its suitability for livestock and crop production (http://www.waterberg.gov.za/index.php?page=agriculture). Four out of six local municipalities of the WDM were selected as focus areas, based on prevalence of land reform farms (CitationDRDLRa, 2017) and their location in WDM, namely Bela-Bela, Lephalale, Mogalakwena and Mookgophong (). Location implied distance to the nearest city and was used as proxy for market-oriented agricultural activities. Selected local municipalities were categorized into: low distance (Mogalakwena), medium distance (Bela–Bela and Mookgophong) and high distance (Lephalale) between their main local municipal towns and the nearest cities (with distances ranging from 58 km to 219 km). The contributions of selected local municipalities to the district land area were: Bela–Bela 7%, Lephalale 40%, Mogalakwena 12% and Mookgophong 9% (CitationLDRT, 2012).
2.2 Farms selection and data collection
To identify potential farms to be included, we derived a list of 175 land reform farms by reconciling land reform secondary data from DRDLR and Limpopo Department of Agriculture (LDA). A cross sectional approach which considered land reform programmes and models of land redistribution programme was used. provides information on number of farms in WDM, in the focus areas, and included in the present study. Based on secondary data from LDA and DRDLR, we could not differentiate between LRAD1 and LRAD2 farms, and, therefore, combined they are referred to as Land Redistribution for Agricultural Development (LRAD) farms in . Proactive Land Acquisition Strategy (PLAS) became the sole land acquisition model under land redistribution in 2010 (CitationRanwedzi, 2013). Majority of the farms under PLAS model were considered to be at inception stages, hence only 7 PLAS farms were included.
Table 1 Number of reformed farms in Waterberg District Municipality (WDM), and in local municipalities in the focus area (since inception up to 2012). Between brackets number of farms included in the study.
Farms included in the study were the active farms where we could find someone willing to be interviewed. Hence, farms not included (64) were idle farms (6), active farms with no respondents (39) and farms we could not locate (19). Idle farms were farms where land was not being used and active farms were farms where land was being used. The Rapid Rural Appraisal (RRA) approach (CitationChambers, 1981) was used to gather information from 76 farms, of which 16 were under land restitution programme and 60 were under land redistribution programme (). Using semi-structured questionnaires, interviews were conducted with respondents who varied from one beneficiary or farm worker per farm to a group of beneficiaries or farm workers per farm. Qualitative and quantitative data were collected to address beneficiary participation, and land and its use. Information about programme (restitution or redistribution), previous ownership (private or state), type of beneficiary (households or individuals), their numbers and level of participation, and land users (beneficiaries, strategic partners, other land users and their applicable combinations) were collected to address beneficiary participation. Strategic partnership “signifies a joint venture or other form of collaboration between an established commercial firm and a new (or ‘emerging’) group of workers, shareholders, small farmers, entrepreneurs or community members with limited commercial experience and little or no access to finance or leading-edge markets” CitationLahiff et al. (2012). In some occasions the involvement of strategic partners was encouraged by the Department of Agriculture (DoA) and DRDLR through provision of capital support CitationLahiff et al. (2012), and CitationAliber and Cousins (2013). Other land users are individuals who were not on the list of farm beneficiaries and do not qualify to be considered strategic partners, but have made arrangements (with those responsible for managing the farm) to use the whole or parts of the farm with or without making financial contributions to the farm. An example of another land user is someone who uses reformed land under lease agreement. Information about previous land use, land size and its current proportional land use were collected to address land and its use. Agriculture, forestry, tourism, conservation and mining were listed by (CitationLahiff, 2007a) as economic sectors relevant to the land reform programme, and for the purposes of this paper they were referred to as general land uses. Land uses were further broken down into land use classes i.e. crop production, livestock production, game farming and there relevant combinations. Game farming refers to keeping of wild animals and contributes to conservation and tourism sectors of the economy. Secondary data were obtained from reports and relevant records from LDA and DRDLR, while additional information was acquired from interviewing key informants, to substantiate information acquired through RRA. Additionally, a stakeholder workshop was organized to further substantiate information acquired through RRA and secondary sources.
2.3 Data analysis
Most data obtained from RRA could be analyzed directly; only level of beneficiary participation was calculated as 100× (number of active beneficiaries/total number of beneficiaries) and land availability per active beneficiary was calculated as total farm land/number of active beneficiaries per farm. An active beneficiary is a beneficiary who is involved in managing the farm and/or using the farm land. Data analysis indicated that of the 47 farms under LRAD, 13 belonged to LRAD1 and 34 belonged to LRAD2. Unless specified, programme analysis was based on 16 land restitution farms and 60 land redistribution farms, whereas redistribution model analysis was based on 6 SLAG farms, 13 LRAD1 farms, 34 LRAD2 farms and 7 PLAS farms. Differences between means of quantitative variables were tested using one-way analysis of variance (ANOVA) and post-hoc Tukey’s test where applicable. Statistical differences will only be mentioned when significant (P < 0.05). We used SPSS version 22 statistics package (CitationSPSS Inc., 2013) for statistical analysis. Qualitative data were analyzed descriptively.
3 Results
3.1 Land restitution and land redistribution policies, and their implementation outcomes
gives characteristics of the SA land restitution and land redistribution programmes and the outcomes of their implementation processes. Land restitution policy intentions had not been changed since it started. The amount allocated per restitution claim was not fixed and it differed from claim to claim. Land restitution policy targeted households whose land was dispossessed and their land claims were settled only when successful. So, the outcome of land restitution implementation had been the beneficiation of the victims of historic racial land dispossession. Restitution farms are being owned by groups of households.
Table 2 Characteristics of the SA land restitution and land redistribution programmes, and the outcomes of the programmes’ implementation process.
Land redistribution policy, on the contrary, was amended over time (). The amendments to the land redistribution policy led to four distinctive models: SLAG- Settlement/Land Acquisition Grant; LRAD1-Land Redistribution for Agricultural Development Phase 1; LRAD2-Land Redistribution for Agricultural Development Phase 2; and PLAS-Proactive Land Acquisition Strategy. The models differed in implementation periods and funds allocated to targeted beneficiaries. Grant amount allocated to qualifying beneficiary increased overtime from SLAG to LRAD2 with beneficiaries gaining land ownership. Under PLAS, the state did not allocate grants and beneficiaries had to make lease payments to access land with possibilities of becoming future land owners. The social classes of targeted beneficiaries broadened and the type of targeted beneficiaries changed under land redistribution programme, with time. All land redistribution models had a business plan as one of the application requirements. In addition to the business plan requirement, a household income ceiling was set for SLAG and contribution from each of the beneficiaries was expected under LRAD. The basis for grant allocation shifted from demonstration of business plan viability under SLAG to prospects of economic viability of the business plan under LRAD and signing of lease or caretakership agreement under the PLAS model.
Targeted beneficiaries of the SA land reform programme are provided in . Poor households were the only target during the inception model SLAG, implying that the household head or a nominated household representative should appear on the farm beneficiary list and only one household member could be a beneficiary. Under SLAG, a farm is owned by a group of households. Hence, an individual household cannot be owner of a farm. The latter models (LRAD1, LRAD2 and PLAS) targeted adult individuals, which made it possible that a whole farm is owned by a single household. Implementation outcomes of land redistribution indicate that SLAG benefited the poor while LRAD1, LRAD2 and PLAS models benefitted mostly other social classes ().
also provides requirements to qualify for SA land reform programme. Land restitution processes required that victims of dispossession made claims and prove their validity, while the state was responsible for availing the claim settlement funds. Under SLAG and LRAD, beneficiaries were responsible for land identification and making applications, while the state was responsible for provision of funds. Under the PLAS the state was responsible for identifying and buying land with beneficiaries having to apply for access to the land.
3.2 Historic situation in reformed farms
Of the 16 restitution farms visited during the RRA, 15 were previously owned by private entities and/or individuals, while the remaining farm was previously owned by the state. Out of the 60 redistribution farms visited during the RRA, 53 were previously owned by private entities and/or individuals, while 7 farms were previously owned by state. Of these 7 redistributed state farms, 5 were under LRAD1, 1 under LRAD2 and 1 under PLAS. Of all restitution farms visited, 63% was previously used for agricultural purposes, 6% for game farming, and 31% for combined agricultural and game farming. Of all redistribution farms visited, 90% was previously used for agricultural purposes, 5% for game farming, and 5% was not used.
presents previous land use of land reform farms visited during the RRA. For restitution farms, crop production, livestock production and the combination of livestock production and game farming, were most prevalent previous land uses, whereas for redistribution farms crop production, livestock production and the combination of crop and livestock production were most prevalent. The PLAS farms were to a major extent previously used for livestock production.
Table 3 Previous land use at land reform farms.
3.3 Current situation in land reform farms
3.3.1 Beneficiary participation
presents beneficiary numbers and their participation levels for programmes and models, in farms visited during the RRA for which their information was verified using secondary data. The number of beneficiaries differed between land reform programmes and among land redistribution models, while the number of active beneficiaries did not differ between land reform programmes and among land redistribution models. Beneficiary participation levels differed between land reform programmes and among land redistribution models. On average, 216 households benefited under restitution programme, with a range from 30 to 638. On average, 14 households benefited under redistribution, with a range from 1 to 100. The mean levels of beneficiary participation were 18% for restitution farms and 65% for redistribution farms. On average, 57 households benefited under SLAG, with a range from 29 to 80, and 9 individuals benefited under combined LRAD1, LRAD2 and PLAS, with a range from 1 to 100. Beneficiary participation level was lowest for SLAG (19%) and highest for PLAS (100%).
Table 4 Beneficiary numbers and their participation levels for programmes and models (mean ± s.d).
All restitution farms were transferred to groups of households, whereas only 10% of the redistribution farms were given to households and 90% to “individuals” (either on individual capacity or in groups). A total of 3030 households benefitted from the 14 visited restitution farms with beneficiary information. In total, 339 households and 504 individuals benefited from the 60 visited redistribution farms.
gives the frequencies of the reformed farms, visited during the RRA, in which specific group of land users were involved. Combined farm use by beneficiaries and non-beneficiaries was more common in restitution farms and less so in redistribution farms. Other land users were operating independently in 12% and together with the beneficiaries in 44% of the restitution farms. Land use by non-beneficiaries was less and similar in SLAG, LRAD1 and LRAD2 farms, but did not exist in PLAS farms.
Table 5 Frequencies (per cent of farms) of land reform farms under specific user.
3.3.2 Land and its use
The sizes of farms visited during RRA (verified using secondary data) differed between land reform programmes and among land redistribution models (). Land redistribution models also differed on land accessible per active beneficiary. Farm size and accessible land per active beneficiary were the smallest under LRAD2. Average farm size and accessible land per active beneficiary observed under LRAD1 were higher than observed under SLAG or LRAD2. The highest farm size and accessible land per active beneficiary were observed under PLAS. Land reform programmes mostly reformed land previously owned by private entities or individuals. Land redistribution programme reformed four times more land that was previously owned by the state than land restitution programme. The total land reformed under land restitution programme was more than double of that reformed under land redistribution programme. Though, the number of farms reformed under land redistribution programme (116) was three times more than the number reformed under land restitution programme (31) in the study area ().
Table 6 Farm size and accessible land per active beneficiary (mean ± s.d), previous land ownership and total reformed land for programmes and models.
presents current land use at land reform farms visited during the RRA. Restitution farms had no dominant land use and crop production did not exist as an independent activity in farms under the present study. The percentage of redistribution farms used for either crop production or livestock production or crop and livestock production was comparable, with few idle farms. Most of the farms were used for crop and livestock production under SLAG model, for livestock production under LRAD1 and PLAS models, and for crop production under LRAD2 model.
Table 7 Current land use at land reform farms (percentage of farms under a specific land use).
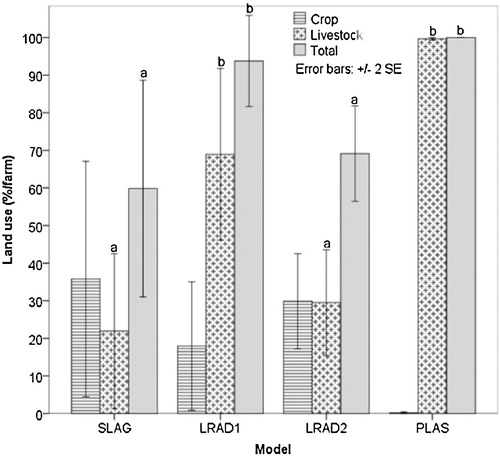
and give the size of land use per land redistribution farm for farms visited during RRA, for crop and livestock production, in hectares and as percentage of total farm land, respectively. Land used for livestock production and total area used differed among models when expressed in hectares and percentages, while land used for crops differed among models only when expressed in hectares.
Fig. 2 Average land area used per farm.
a,b,c Different superscripts in a column indicate significant differences between models (P < 0.05).
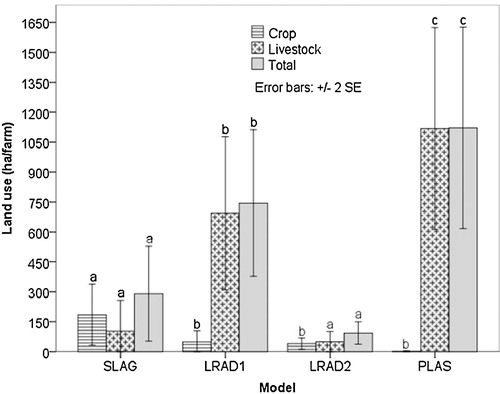
Fig. 3 Average proportional land use per farm.
a,b,c Different superscripts in a column indicate significant differences between models (P < 0.05).
3.4 Comparisons between pre- and post-land reform situations
Pre- and post-land reform land uses of farms visited during the RRA are shown in . Crop farming as sole activity was present pre-land reform in restitution farms, but not anymore. All other land use classes were observed in restitution farms post-land reform. Post-land reform no game farming was observed, while some of the previously idle farms were in use in redistribution farms.
Table 8 Comparison of previous and current land use at land reform farms (percentage of farms under a specific land use).
4 Discussion
Farms investigated in the present study represented 43% and 54% of land reform farms in WDM and focus areas. In the focus area, farms not located (19) were likely to be idle farms and in addition to idle farms (6 identified and 3 investigated) they could all be considered “idle farms”. Representation of active farms was 51% (57 of 112), while that of idle farms was 11% (3 of 28) in the focus area. The present study did not compare active and idle land reform farms, and the findings are conclusive for active land reform farms. With 28 of the 140 land reform farms in WDM being idle, we conclude that 80% of the land reform farms in WDM were active and contribute to beneficiaries’ livelihoods.
We assumed that farms Beneficiary participation (numbers and involvement) was an indicator of contribution to equality in land ownership and access objective, while land use could indicate contributions to food security and job creation objectives. The present paper reviewed land reform literature with an intent of understanding the findings on beneficiary participation in and land use of reformed farms. It further compared the relevancy of cross-sectional study (with relatively high representation samples) with case study approach in land reform studies.
4.1 Relevant land reform policies
The adherence to the policy targets of land restitution and land redistribution programmes was assessed by evaluating the implementation outcomes of the programmes (). The adherence of land restitution programme and SLAG redistribution model implementation outcomes to their policy targets emanated from clearly defined targeted beneficiaries. It was the broadening of targeted beneficiary social classes during later redistribution models (LRAD1, LRAD2 and PLAS) that led to the better-off (small-scale and commercial farmers) benefiting the most. It could be concluded that land restitution and SLAG model met their policy targets fully, while partial fulfillment was realized under LRAD1, LRAD2 and PLAS redistribution models.
4.2 Beneficiary participation
Land restitution and the initial land redistribution model SLAG were characterized by relatively high number of beneficiaries per farm. However, most of these beneficiaries did not become land users, in line with the findings by CitationLahiff et al. (2008), and CitationAliber and Cousins (2013). The observed low beneficiary participation in land use could not be attributed to the conditions of the reformed farms, since most of these farms were used before land reform. Inadequate post-land reform support by the state and low resource endowment of the beneficiaries were reported to be among the key factors contributing to low beneficiary participation (CitationLahiff and Li, 2012). High number of restitution farms was used by other land users i.e. observed to be operating independently in 12% and together with the beneficiaries in 44% of the farms. This was likely the result of the low levels of beneficiary participation and large size of the farms, leaving considerable portions of unused land, in line with the findings by CitationLahiff et al. (2012), and CitationAliber and Cousins (2013). For reasons associated with low beneficiary participation, state departments, especially in Limpopo province, advocated for involvement of strategic partners as land users (CitationLahiff, 2008; CitationLahiff et al., 2012; CitationAliber and Cousins, 2013). Involvement of non-beneficiaries as land users in land reform farms could have both positive effects (i.e. utilisation of reformed land and availability of working capital coupled with advisory and farm management skill) and negative effects (lack of beneficiary involvement defeating the knowledge and skills transfer objective associated with strategic partnering and unsustainable use of natural resources) (CitationLahiff et al., 2012).
Changes made to the land redistribution policy (LRAD1, LRAD2 and PLAS being the outcomes of those changes) resulted in land acquisition by financially better-off individuals (). That led to a decrease in beneficiary number per farm, with most of the beneficiaries being involved in land use (). High levels of beneficiary involvement in land use could be attributted mainly to the large amount of own investment committed towards land acquisition (CitationMALA, 2001; CitationHall et al., 2003; CitationDLA, 2006). The decrease in number of beneficiaries over time could be considered a lack of adherence to the social objective of land reform programme by state and could pose social cohesion challenges in future.
4.3 Land and its use
Land restitution programme had reformed more land than land redistribution programme in the study area and the Limpopo province (CitationDRDLRb, 2017). However, land redistribution programme had reformed more land than land restitution programme in provinces where the extent of historic racial land dispossession was low e.g. Free State and Northern Cape provinces. Land redistribution programme is expected to deliver more land than land restitution programme in the future (until land reform target of 24.6 million hectares is reached (CitationDLA, 1997), since 30 June 2019 is the last date to lodge restitution claims (CitationRSA, 2014)).
The land restitution programme did not target land for reform on basis of its use. Restitution farms, therefore, had no dominant land use, and the land use changed to more diversification in most of the farms (CitationLahiff et al., 2008; CitationAliber and Cousins, 2013). These changes in land use could be attributed to beneficiaries’ (i) lack of finance to continue capital intensive production activities of the previous farm owners (CitationHall et al., 2003) (ii) benefit of having own livestock readily available to use acquired land and (iii) rights to make decisions on what the land could be used for (CitationDLA, 1997). The land redistribution programme, on the other hand, required that those who wanted to benefit included farm business plans as part of their portfolio for land application. Business plans were developed on the basis of land uses which existed in farms targeted for land reform, which generally implied continuation of those land uses post-land reform (CitationHall, 2009; CitationAliber and Cousins, 2013).
Land redistribution programme targeted land for reform randomly and not for a particular agricultural activity. This was reflected by the diversity of agricultural land uses observed in redistribution farms. Agricultural activities vary in their land use e.g. intensive poultry production or irrigated crops use limited land with high possibility that only a fraction of a farm is used (portrayed by LRAD2 model in ), while beef production on natural pastures or dry land crop production use a huge amount of land with high possibility that the whole farm is used (portrayed by LRAD1 and PLAS models in ). The agricultural potential of the area (CitationEastwood et al., 2006; CitationLahiff, 2007a; CitationNhemachena et al., 2011) determined the extent to which the land was used per farm. Beneficiaries’ lack of resources (portrayed by SLAG model in , backed by ), insufficient government support and type of agricultural activities being practiced (extensive versus intensive production) were among the factors leading to portions of unused land in reformed farms (CitationLahiff et al., 2008; CitationAliber and Cousins, 2013).
Changes made to the land redistribution policy (LRAD1, LRAD2 and PLAS being the outcomes of those changes) did not result in identifiable trends in the amount of land reformed and the extent of land use among redistribution models. The lack of trends could be attributed to the fact that previous land ownership, intended land use (mostly influenced by the district agro-ecological conditions), developments in agricultural sector of an area (as reflected in the Integrated Development Plan, IDP) and the social class of beneficiaries represented the context in which land redistribution was being implemented. All these factors did not result in systematic trends regarding the size of land reformed and the extent of land use. The higher farm sizes coupled with higher extent of land used resulted from (i) under LRAD1–reform of large state farms (5 of 13 farms), better-off individuals being the beneficiaries and majority of farms being used for extensive livestock production (ii) under PLAS − reform land being either previously or currently owned by state, wealthy individuals being the beneficiaries and extensive livestock production dominating the land use (requiring large land sizes to be economically feasible). Smallest farm sizes coupled with high extent of land use observed under LRAD2 model resulted from private owned land being reformed, better-off individuals being the beneficiaries, and reform of land intended for broiler production (in line with the IDP) and intensive crop production. The introduction of LRAD brought the requirements that (i) district municipalities should influence land use patterns in areas they control and (ii) state organs key to land reform should ensure that land reform programme adhere to IDPs of the districts (CitationMALA, 2001; CitationDRDLR, 2012). In future, the amount of land to be reformed under land redistribution programme will be determined by the IDPs.
4.4 Research approaches
Case studies covering relatively few land reform farms had been the most used research approach to investigate land reform in SA (CitationBradstock, 2005; CitationLahiff et al., 2008; CitationAliber and Cousins, 2013). Though land restitution and land redistribution programmes could be investigated simultaneously, we comment that the programmes should be considered different for analysis of beneficiary participation. The separation of SLAG model from LRAD1, LRAD2 and PLAS models is also opted for in analysis of beneficiary participation for land redistribution programme. The findings, of the present cross-sectional study (with relatively high representation samples), on beneficiary participation confirmed the observations from case study literature (CitationBradstock, 2005; CitationLahiff et al., 2008; CitationAliber and Cousins, 2013). Hence we concluded that case studies are appropriate for studying land reform beneficiary participation in land restitution and land redistribution farms. Since the findings from case studies could portray a true reflection of beneficiary participation in land reform farms throughout SA.
The cross-sectional study (with relatively high representation samples) used in the present study will require more resources to effectively investigate land use in restitution farms. The inability of case studies to portray the context in which land redistribution was implemented was revealed by the approach used in the present study. Land redistribution findings on land and its use from case studies should be considered portraying the situation on farms investigated. While the findings obtained through the approach used in the present study portrayed land redistribution situation in the study area. For land use investigation, it could be concluded that the approach that could be used to investigate restitution farms should depend resource availability, while cross-sectional study (with relatively high representation samples) should prioritized in redistribution farms.
5 Conclusions
As contribution to the broader understanding of the SA land reform programme, it seems justified to conclude that (i) land restitution benefited the targeted beneficiaries, whereas land redistribution benefited the targeted beneficiaries fully during the inception phase and partially during later phases of the programme (ii) land restitution programme created high number of new land owners who were less involved in using the land, whereas the number of new land owners created decreased and their participation level land increased over time under redistribution programme (iii) (a) historic land dispossession of the area will determine the area of land that could be reformed through restitution and redistribution programmes (b) restitution farms will not have dominant land use, while redistribution farms will mostly adhere to previous land use (c) previous land ownership, agro-ecological conditions, IDP of the area and the social class of beneficiaries will to a degree determine the extent to which redistribution farms will be used (iv) case study approach is appropriate for studying land restitution programme (beneficiary participation and land use); whereas beneficiary participation could be studied using case study approach in redistribution farms, but cross-sectional study (with relatively high representation samples) is critical for knowledge generation on land redistribution.
tjls_a_12128496_sm0001.docx
Download MS Word (12.9 KB)tjls_a_12128496_sm0002.xlsx
Download MS Excel (13 KB)tjls_a_12128496_sm0003.xlsx
Download MS Excel (10.4 KB)tjls_a_12128496_sm0004.xlsx
Download MS Excel (25.4 KB)Acknowledgements
The research project from which this paper draws was funded by the Netherlands University Foundation for International Cooperation (NUFFIC, project NICHE/ZAF/012) of the Netherland and the University of Venda (UNIVEN) in collaboration with Limpopo Department of Agriculture (LDA) and the Department of Rural Development and Land Reform. The funding sources provided finances required for the research; in addition UNIVEN and LDA also provided personnel for data collection. The authors thank Edward Nesamvuni, Marlise Bornman, Lesetja Selepe, Julius Sebei, Kgabo Mahlako and Masiza Mikasi, as well as two anonymous reviewers, for their invaluable comments and suggestions.
References
- M.AliberB.CousinsLivelihoods after land reform in South AfricaJ. Agrar. Chang1312013140165
- M.A.AntwiO.I.OladeleImpact of the land redistribution for agricultural development (LRAD) projects on livelihoods of beneficiaries in ngaka modiri molema district, South AfricaJ. Hum. Ecol.4232013273281
- A.BradstockChanging livelihoods and land reform: evidence from the Northern Cape Province of South AfricaWorld Dev.3311200519791992
- R.ChambersRapid rural appraisal: rationale and repertoirePublic Adminstration Dev.1198195104
- B.CousinsLand redistribution, populism and elite capture new land reform policy proposals under the microscopeJ. Helen Suzman Found.7020131119
- DLA (Department of Land Affairs)White Paper on South African Land Policy1997DLAPretoria(Available: http://ww2.ruraldevelopment.gov.za/DLA-Internet//content/document_library/documents/White_paper/WhitePaperLandReform.pdf [accessed 08.11.2012])
- DLA (Department of Land Affairs)Implementation Plan for the Proactive Land Acquisition Strategy2006DLAPeritoriaAvailable: http://www.satgi.co.za/admin/…/Land Acquisition Strategy(1)(1).pdf? [accessed 31.03.2014]
- DOJ (Department of Justice)Restitution of Land Rights Act, Act No. 22of1994DOJ, RSA1994(Available: http://www.justice.gov.za/lcc/docs/1994-022.pdf [accessed: 09.08.2015])
- DOJ (Department of Justice)Constitution of the Republic of South Africa, Act No. 108 of 19961996DOJ, RSA
- DRDLR (Department of Rural Development and Land Reform)The State of Area-Based Rural Development and Land Reform Plans in South Africa Since 2006: A Rapid Inventory and Evaluation, Final Report2012DRDLRPretoria
- DRDLR (Department of Rural Development and Land Reform)End of Term Report 2009–20142014DRDLRPretoria
- DRDLRa (Department of Rural Development and Land Reform)Audit of Restituted Land as at March 2009 (Including Those from RLCC Database but Exclude Non Agricultural Properties) and Land Reform Database-LRAD for Limpopo Province2017Provincial DRDLR OfficePolokwane(Unpublished data)
- DRDLRb (Department of Rural Development and Land Reform)Land Reform Statistics Report: Since Inception-December 20132017DRDLRPretoria(Unpublished document)
- K.DeiningerMaking negotiated land reform work: initial experience from Colombia, Brazil and South AfricaWorld Dev.2741999651672
- R.EastwoodJ.KirstenM.LiptonR.EastwoodJ.KirstenM.LiptonPremature deagriculturalisation? land inequality and rural dependency in limpopo province, South Africa*J. Dev. Stud.428200613251349
- H.M.FeinbergThe 1913 natives land act in South Africa: politics, race, and segregation in the early 20th centuryInt. J. Afr. Hist. Stud.261199365109
- R.HallL.CliffeIntroductR.HallAnother Countryside? Policy Options for Land Agrarian Reform South Africa2009Institute for Poverty Land and Agrarian StudiesUniversity of the Western Cape119
- R.HallP.JacobsE.LahiffEvaluating land and agrarian reform in South Africa, final report, occasional paper No. 10Programme for Land and Agrarian Studies2003University of the Western Cape
- R.HallLand reform for what? Land use, production and livelihoodsR.HallAnother Countryside? Policy Options for Land and Agrarian Reform South Africa2009Institute for Poverty, Land and Agrarian StudiesUniversity of the Western Cape2360
- LDRT (Limpopo Deprtment of Road and Transport)Limpopo Province Freight Data Bank > Roads > Freight2012(Available: http://www.safiri.co.za/lpfdb/authorities-waterberg.html [accessed 20.12.2012])
- E.LahiffG.LiLand redistribution in South Africa: a critical reviewF.ByamugishaAgricultural Land Redistribution and Land Administration in Sub-Saharan Africa: Case Studies of Recent Reforms2012The World BankWashington, D.C2754
- E.LahiffT.MalulekeT.ManenzheM.WegerifLand redistribution and poverty reduction in South Africa: the livelihood impacts of smallholder agriculture under land reform, research report no. 36Programme for Land and Agrarian Studies2008University of the Western Cape(Available: http://www.plaas.org.za/publication-search?title=research+report+36&body_value=&field_pub_author_value=&field_pub_cat_tid=All&field_pub_researchareas_nid=All [accessed 08.11.2012])
- E.LahiffN.DavisT.ManenzheJoint Ventures in Agriculture: Lessons from Land Reform Projects in South Africa2012IIED/IFAD and FAO/PLAASLondon/Rome/Cape Town
- E.LahiffBusiness models in land reform, research report No. 27Programme for Land and Agrarian Studies2007University of the Western Cape
- E.LahiffWilling buyer, willing seller: South Africa’s failed experiment in market-Led Agrarian reformThird World Q.288200715771597
- E.LahiffLand reform in South Africa: a status report 2008, research report No. 38Programme for Land and Agrarian Studies2008University of the Western Cape
- L.LouwLand distribution paradoxes and dilemmasJ. Helen Suzman Found.7020135465
- MALA (Ministry for Agriculture and Land Affirs)Land Redistribution for Agricultural Development: A Sub-Programme of the Land Redistribution Programme2001MALAPretoria
- S.MoyoDesigning and implementing redistributive land reform: the southern african experienceC.Binswanger-MkhizeAgricultural Land Redistribution: Towards Greater Consensus2009The World BankWashington, D.C337366
- C.NhemachenaJ.ChakwiziraM.MashiriS.DubeA policy framework for sustainable utilisation of farmland for waterberg district municipality in South AfricaS.A.BehnassiSustainable Agricultural Development: Recent Approaches in Resources Management and Environmental-Balanced Production Enhancement2011SpringerNetherlands, Dordrecht99114
- RSA (Republic of South Africa)Restitution of Land Rights Amendment Act, Act No. 15of 2014, Government Gazette 589 No. 377912014RSACape Town(Available: http://www.gov.za/sites/www.gov.za/files/37791_Act 15 of 2014 Restitution Of Land Rights Amendment Act_a.pdf [accessed: 18.11.2015])
- N.E.RanwedziThe Potential and Limits of the Proactive Land Acquisition Strategy (PLAS): Land Reform Implementation in Gauteng Province of South Africa, Unpublished MPhil Thesis2013Institute for Poverty, Land and Agrarian Studies University of the Western Cape
- SPSS IncStatistical Package for Social Sciences Version 222013
- C.ValenteHousehold returns to land transfers in South Africa: a Q-squared analysisJ. Dev. Stud.4722011354376
- M.WegerifA critical appraisal of South Africa’s market-based land reform policy: the case of the Land Redistribution for Agricultural Development (LRAD) programme in Limpopo, research report no. 19Programme for Land and Agrarian Studies2004University of the Western Cape
Appendix A
Supplementary data
Supplementary data associated with this article can be found, in the online version, at http://doi:10.1016/j.njas.2017.07.003.