
Highlights
| • | The lower the planting density, the less yellow the pasteurized pineapple juice. | ||||
| • | Low planting density and medium K2O:N ratio yielded the most liked pasteurized juice. | ||||
| • | Medium and highest K2O:N ratio provided juices with similar sensory appreciation. | ||||
Abstract
High quality products can be produced only from high quality raw materials. The best agricultural practices that lead to pineapple fruits of desirable quality were investigated in the present study, focusing on the quality of the derived pasteurized juices. Physicochemical characteristics and sensory quality of the juices were determined in relation to planting density and fertilizer formulation, namely the K2O:N ratio. Three planting densities (D1: 54 400 plants/ha, D2: 66 600 plants/ha and D3: 74 000 plants/ha) and three K2O:N ratios (E1: 0.37, E2: 1.0 and E3: 2.0) were applied in nine treatments. Fruits were harvested and processed into juice following a standardized process. Pasteurization was applied after bottling, at 85 °C for 15 min. Juices’ pH, total soluble solids, color and density were determined. Sensory profiles were established by 14 trained panelists using the Quantitative Descriptive Analysis (QDA) method and their acceptability was evaluated. Results showed that the lower the planting density, the less yellow the pasteurized juice. The K2O:N ratio increased the juices’ degrees Brix from 13.1 to 14.4 and the yellow color. Pineapple fruits produced at a density of 54 400 plants/ha with a K2O:N ratio of 1.0 (D1E2) yielded the most sweet, least acid and pasteurized juice most liked by consumers, supported by high values of degree Brix and pH. Juices with the closest similar sensory appreciation were those obtained from treatments D3E2 and D3E1. Pineapple farmers that furnish their products to juice processors should adopt one of the best combinations stated in this study.
1 Introduction
Pineapple (Ananas comosus (L.) Merr.) is a perennial herbaceous plant of the bromeliaceae family, introduced in Benin around the 17th century (CitationAdossou, 2012). It is the country’s third most important crop after cotton and cashew, with an annual production of 244 207 tons in 2015 (CitationFAOSTAT, 2015). Pineapple fruits are used primarily for fresh consumption and juice production (CitationAgbangba, 2016). Minor products include dried pineapple, pineapple syrup and pineapple jam.
Producers, traders and processors in the Beninese pineapple industry face several constraints, in particular the heterogeneity of the quality of pineapple fruits and associated competition issues in international trade (CitationFassinou Hotegni et al., 2014). This heterogeneity is related to many quality attributes, such as fruit size and degree Brix (CitationFassinou Hotegni et al., 2014), and seems to be linked to agricultural practices during cultivation (CitationFassinou Hotegni et al., 2012). Of these practices, planting density and soil fertility were studied with regard to pineapple quality. Pineapple grows easily on poor soils but yields better on rich and fertile soils (CitationOwureku-Asare et al., 2015). Nitrogen (N) and potassium (K) are the two macronutrients sourced from fertilizers and used in pineapple cultivation that have the greatest influence on yield as well as on the organoleptic characteristics of the fruit (CitationSpironello et al., 2004; CitationHepton and Bartholomew, 2003). An increase in the nitrogen content of applied fertilizers leads to an increase in juice yield and a decrease in degree Brix, titratable acidity and vitamin C content (CitationSpironello et al., 2004). However, an increase in potassium increases the degree Brix, titratable acidity and vitamin C content (CitationSpironello et al., 2004; CitationPaula et al., 1991). High densities increase the titratable acidity of pineapple fruits while the degree Brix stays low (CitationMustaffa, 1988).
To date, no study has quantified the effect of both planting density and fertilizers management on the quality of pasteurized pineapple juice. Know-how about the relation between the quality of pasteurized juice and agricultural practices is needed to better align cultivation practices with consumer expectations and subsequently sales. Therefore, this study evaluated the effect of planting density and fertilizer management on the physicochemical and sensorial characteristics of pasteurized pineapple juice.
2 Material and methods
2.1 Production site and agronomic treatments
The agronomic experiment was located in Zè (latitude 6° 33 to 7° 27 north and longitude 2° 19 to 2° 26 east), a municipality of 653 km2 in the Atlantic department in southern Benin. Annual precipitation is 1200 mm with monthly temperatures ranging from 27 °C to 31 °C (CitationINSAE, 2004). The Atlantic department is characterized by ferrallitic soils, according to the pedological map of Benin. This soil type has good physical conditions, such as proper deepness, drainage, permeability, high water-holding capacity, and a relatively good chemical composition (CitationFassinou Hotegni et al., 2012).
The experiment had nine agronomic treatments, consisting of combinations of planting densities (D1: 54 400 plants/ha, D2: 66 600 plants/ha and D3: 74 000 plants/ha) and potassium-nitrogen based fertilizer K2O:N ratios (E1: 0.37, E2: 1.0 and E3: 2.0). E1 corresponded to 0 kg/ha of K2SO4 for all planting densities (D1, D2 and D3). E2 consisted of K2SO4 gifts of 577, 706 and 784 kg/ha for D1, D2, D3, respectively. E3 comprised K2SO4 gifts of 1429, 1749 and 1943 kg/ha for D1, D2 and D3, respectively. Planting density D1 and ratio E1 represented farmers’ practices and were used as control. The pineapple cultivar used in the experiment was Perolera sugarloaf. In line with current farmers’ practices, pineapple plants were planted in a double row bed system. Planting density was modified by varying the distance between plants.
2.2 Production of pasteurized pineapple juice
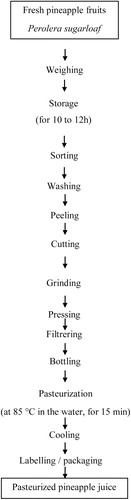
Pineapple fruits were harvested at maturity, i.e. after 17 months in the field, and given to experienced processors, who produced the pasteurized juices according to the flow chart in . Nine types of pasteurized pineapple juices were produced in triplicate from the nine treatments.
2.3 Analysis of pasteurized pineapple juice
2.3.1 Sampling
The pasteurized pineapple juices, pre-packaged in bottles of 25 cl and 33 cl, were brought to the laboratory on the day of processing and stored at ambient temperature (26−30 °C) until analyses. The analyses were performed in triplicate. Three bottles were randomly selected and the juices mixed to determine physicochemical parameters, while the juices of five bottles randomly selected were blended for sensory evaluation.
2.3.2 Physicochemical analyses
The pH of the juices was measured (ISO 1842: 1991) by an electronic pH meter (Eutech, Cybernetics, Singapore). Total soluble solids (TSS), which reflect the juices’ sweetness, were measured using a refractometer (ATAGO, Co. Ltd., Japan) at 20 °C. Results were expressed as degrees Brix (ISO 2173: 2003). The densities were determined with a balance (Radwag, PS1200 R2) with 0.01 precision. Equal volumes of 100 ml of juice and distilled water (i.e. the reference substance) were weighed at identical temperature and pressure (ASTM D 1429-13: 2013). The density was subsequently calculated as follows:
Density = mass of juice / mass of water
Lightness L*, redness a*, yellowness b* and total color difference ΔE were measured according to the standards of the International Committee of Lighting (CIELAB, 1976), using a Chroma meter CR-410 (Konica Minolta optics, INC, Osaka, Japan). The device was calibrated with a standard yellow plate using the D65 illuminant (Y = 63.5; x = 0.416; y = 0.436).
2.3.3 Sensory evaluation of the pasteurized pineapple juices
Sensory evaluation was performed according to the Quantitative Descriptive Analysis (QDA) method (CitationStone and Sidel, 1993). The sensory properties of the pasteurized juices were identified, described and their intensity measured as perceived by consumers (CitationMarangoni and Moura, 2011). Sensory profiles were generated and acceptance was evaluated.
2.3.4 Generation of the descriptors
Twenty five regular pineapple juice consumers and processors aged 20–63 years were recruited as candidates for the assessment of the sensory quality of pineapple juice (ISO 11056: 1999). They determined the sensory attributes that described aroma, taste, color and viscosity of a representative pasteurized pineapple juice (100 ml). The generated attributes were compiled and grouped in clusters. Seven terms considered critical were consensually retained and defined in the final list of descriptive terms, with the reference materials (standards) of each attribute (see ).
Table 1 Attributes, definitions, and reference standards generated by the sensory judges.
2.3.5 Selection of judges for further sensory tests
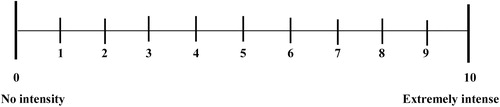
The candidates were screened on their sensitivity to two basic tastes (sweet and acid) in triangular tests to select those with good abilities to discriminate between samples. They were asked to taste three samples and identify the different one (CitationMeilgaard et al., 2006). Twenty persons passed this pre-selection round. Next three training sessions were performed using linear structured scales of 10 cm () to score the intensity of the descriptive terms, in which “0” meant “no intensity” and “10” meant “extremely intense”. The reference samples were considered to have the highest intensity of “10”.
Pure pineapple juice samples with added lemon juice, overcooked pineapple juice or water, were used during the training sessions. The judges were served 50 ml of each sample and 70 ml of reference samples. Water was provided for palate cleansing between samples. A final selection step was carried out through tests that analyzed the judge’s performances. Therefore, analysis of variance (ANOVA) was performed with three factors: sample, replication, judges. Fourteen of the candidates were finally selected as trained judges according to their discriminatory power (Psamples < 0.05), their reproducibility (Psamples*replication ≥ 0.05), while the interaction “judges*samples” expressed their consensus (Pjudges*samples ≥ 0.05).
2.3.6 Sensory tests on the pasteurized juices
The fourteen trained judges, then considered as panelists, evaluated the nine pasteurized pineapple juices. The juice samples were served in plastic cups coded with three digit numbers generated with Microsoft Excel through the “RANDBETWEEN” function. All tests were performed in individual booths with red light when evaluating taste and aroma, and white light when evaluating colors and viscosity. The panelists were asked to reevaluate the references at each session to memorize them. Each panelist received the juices in a monadic way. The sensory evaluation was conducted in triplicate, using a Randomized Complete Block design with the panelists as blocks and the nine pasteurized pineapple juices as the experimental units randomized in the blocks.
2.3.7 Sensory acceptance test
In addition to the Quantitative Descriptive Analysis, acceptance tests were conducted for the nine juices by set of triplication. Each panelist was asked to give his overall impression of each juice. In each session, a five-point hedonic scale was used with the following terms: “Dislike very much” = 1, “Dislike slightly” = 2, “Neither like nor dislike” = 3, “Like slightly” = 4 and “Like very much” = 5.
2.3.8 Statistical analysis
The data obtained from the physicochemical analyses, QDA and acceptance tests were first analyzed using ANOVA with Minitab 17 to determine significant differences between the juices. When a significant difference (p < 0.05) was detected, Tukey's means test was applied to evaluate the difference by paired comparisons. Planting density and fertilizer K2O:N ratio were also considered as sources of variation to evaluate whether they affected juice quality. A multiple block statistical analysis, known as Common Components and Specific Weights Analysis (CCSWA) (CitationHanafi et al., 2006; CitationQannari et al., 2001) was then used to describe the link between the sensory descriptors and the physicochemical parameters.
A unidimensional approach performed in R software was finally used to identify the most discriminative juice parameters presented as boxplots. Besides a great variability between the box lengths, the presence of outliers showed the discriminative power of a parameter. Afterwards, the preference data were summarized and presented as bar plots to identify the most liked juice in relation to its agronomic treatment.
3 Results
3.1 Physicochemical characterization of the pasteurized pineapple juices
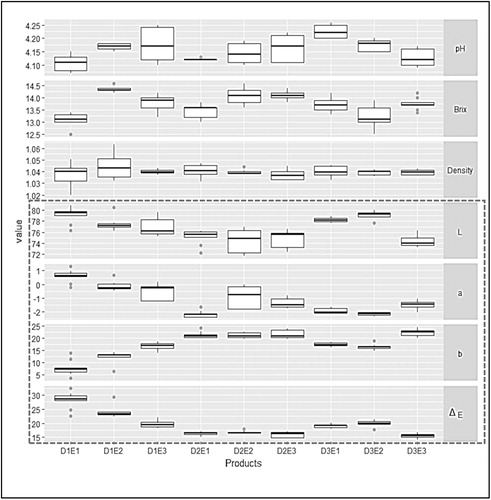
The pH, degree Brix and density of the nine pasteurized pineapple juices are presented in . The pH of the juices varied significantly (p < 0.05) from 4.1 to 4.2. As far as pH is concerned, only D3E1 (pH = 4.22) had a significantly higher pH than D1E1 (4.11); all the other treatments have similar pH (4.12–4.18). The administrated K2O:N ratio significantly (p < 0.05) influenced the degree Brix of the juices, which ranged from 13.1 to 14.4; the treatment with lowest degree Brix was D1E1 and the treatment with highest degree Brix was D1E2. There was no significant difference in density between the pasteurized pineapple juices (p > 0.05), which varied between 1.04 and 1.05.
Table 2 Physicochemical characteristics of the nine pasteurized pineapple juices.
All juices were significantly different (p < 0.05) with regards to the color parameters a*, L*, b* and ΔE (). Lightness L* ranged from 74.4 to 79.2. Redness a* varied from negative values (-2.2) to positive values (+ 0.6). Yellowness b* fluctuated between 7.8 and 22.2. The total color difference “ΔE” values ranged between 15.5 and 28.2. Both planting density and K2O:N ratio significantly influenced yellowness and the total color difference of the juices (p < 0.05). Pasteurized juices obtained from planting density D2 (i.e. D2E1, D2E2 and D2E3) had a comparable total color difference “ΔE” (16.01–16.75).
Table 3 L*, a*, b* and ΔE values for the nine pasteurized pineapple juices.
3.2 Sensory profiles of the pasteurized pineapple juices
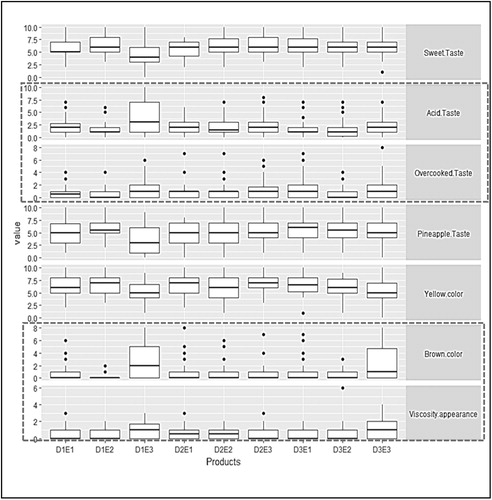
The shows the scores for all seven descriptors evaluated by the trained panelists. The panelists scored the sweet taste of all juices over 5, except for juice D1E3, which was scored 4.6. The acid taste was scored between 1.4 and 4.1. With respect to pineapple aroma, juice D1E3 received the lowest score (3.5) while all other scores were close to or greater than 5. The overcooked taste attribute of the juices, known as a consequence of a prolonged heat treatment during pasteurization, was scored between 0.5 and 1.6.
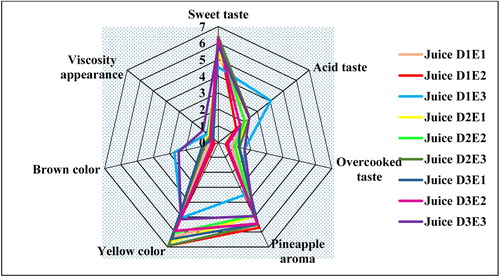
The panelists scored the yellow color of all juices over 5, with means ranging from 5.0 to 6.9. The brown color was scored from 0.2 to 2.7, and viscosity from 0.4 and 1.2. Significant differences (p < 0.05) were observed in taste, aroma, color and viscosity of the pasteurized pineapple juices (). The overcooked taste was not considered in the evaluation of the agronomic treatments since it is linked to the pasteurization process, which takes place after harvest.
Table 4 Significant influence of the treatments on the juice’s sensorial parameters.
3.3 Overall characterization of the pasteurized pineapple juices
The Common Components and Specific Weights Analysis (CCSWA) shows the relations between the sensory attributes and physicochemical characteristics of the juices (). The first common component mainly opposed juice D1E1 to juice D3E3. Juice D1E1 is characterized by a high total color difference ΔE expressed by its high lightness L* and positive redness a*. In contrast, juice D3E3 showed a high value for yellowness b*. Juices D2E1, D2E2 and D2E3 appear to have descriptions similar to juice D3E3, but their contribution to the common components were low.
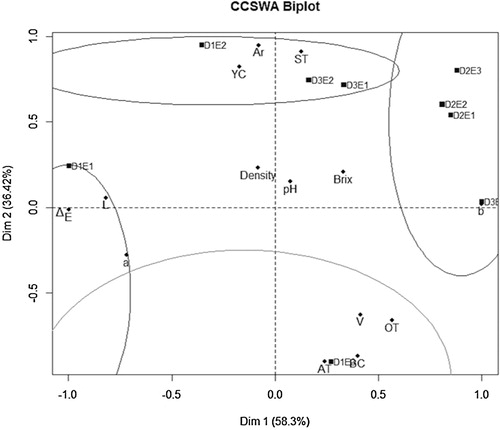
The second component mainly opposed juice D1E2 to juice D1E3. Juice D1E2 is described as having a very sweet taste (ST), pineapple aroma (Ar) and yellow color (YC). D3E2 and D3E1 had descriptions comparable to juice D1E2, while they showed low contributions to the common components. Juice D1E3 is characterized by a very acid (AT) and overcooked taste (OT), brown color (BC) and perceptible viscosity (V). It is also characterized by a low sweet taste, pineapple aroma and yellow color. No common relations were found for the pH, the degree Brix and juice density.
3.4 Discriminative characteristics of the pasteurized juices
The unidimensional analysis boxplots show the parameters that discriminate the pasteurized pineapple juices. For the physicochemical characteristics (), the color parameters L*, a*, b* and ΔE showed discriminating power to a little extent. Concerning the sensory parameters (), the acid taste, overcooked taste and brown color appear to be very discriminative for the juices, and viscosity a little.
3.5 Sensory acceptance of the pasteurized pineapple juices
Significant differences (P < 0.05) were found for the degree of acceptance for all pasteurized pineapple juices as evaluated by the panelists ().
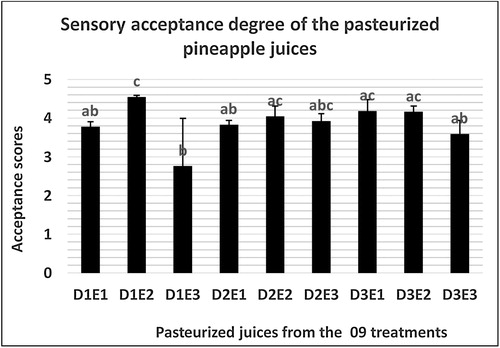
The pasteurized juice obtained from D1E2 received the highest mean score (above 4.5), followed by juices D3E1 (mean score = 4.2), D3E2 (mean score = 4.2) and D2E2 (mean score = 4.0). Juice D1E3 received the lowest mean score (below 3).
4 Discussion
4.1 Effects of the agronomic treatments on the physicochemical parameters of the juices
The pH of the pasteurized pineapple juices varied significantly (p < 0.05) from 4.1 to 4.2, but irrespective of planting density and K2O:N ratio (p > 0.05). The insignificant effect of the K2O:N ratio, expressing the effect of potassium fertilization, is not in accordance with the findings of (CitationAgbangba, 2016), who reported that potassium gifts significantly decreased the pH of pasteurized pineapple juice. The author studied the effects of mineral fertilization on the physicochemical and sensorial qualities of Smooth cayenne juice. The pineapple cultivar used (Smooth cayenne) is different from the one used in the present study, which was Perolera Sugarloaf. The pH values (4.1–4.2) measured in the present study were higher than reported in the literature, which range between 3.3 and 3.6 (CitationFDA, 2007). The pineapple variety used for this normative pH range was not specified, but is probably Smooth cayenne as Sugarloaf just recently entered the international market.
As far as the total soluble solids are concerned, significant differences (p < 0.05) were observed between juices. The increase of the K2O:N ratio from E1 to E2 significantly increased the degree Brix of the juices for planting density D1 (13.1–14.4) and slightly less for planting density D2 (13.5–14.1). This evolution of the degrees Brix agrees with the results found in the study of the effects of mineral fertilization on physicochemical and sensorial qualities of Smooth cayenne pineapple juice in Benin (CitationAgbangba, 2016). The author reported an increase in the degree Brix of pineapple juice as a function of an increase in potassium fertilization up to a dose of 9.3 g/plant at a planting density of 60 000 plants/ha. However, higher amounts decreased the degree Brix. No significant difference was observed for the degrees Brix of the pineapple juice at planting density D3. So, high planting densities do not affect the total soluble solids of pineapple juice. This observation is in contrast to the findings of many authors, who reported that high densities reduce the total soluble solids of pineapple juice (CitationMustaffa, 1988; CitationBartholomew et al., 2003). The degrees Brix of the nine pineapple juices are all above 10 as recommended for fruit juice without additional acids (CitationCAC, 1981). There was no significant variation (p > 0.05) in juice density due to planting density or the K2O:N ratio. The juice density values, which ranged from 1.04 to 1.05, meet the international standard (1.06) for fruit juice (CitationFAO, 2015).
The pasteurized juices significantly differed in terms of color (p < 0.05), which overall is the most discriminative physicochemical parameter of the juices. Yellowness (b*) increased with the K2O:N ratio and the planting density (7.8–22.2). This is consistent with studies reporting that adequate potassium nutrition is associated with fruit color improvement in many horticultural crops (CitationGeraldson, 1985; CitationKumar et al., 2006; CitationGaneshamurthy et al., 2010).
Indeed, the large uptake of potassium (K) decreased the amount of magnesium (Mg) in the plant (CitationTurner and Barkus, 1983) and thus promoted a high K/Mg ratio, resulting in yellow pulp in ripe fruits (CitationGaneshamurthy et al., 2010). The pasteurized juices obtained from planting density D2 (i.e. D2E1, D2E2 and D2E3) had a similar total color difference “ΔE”, with a mean value of 16.3. Their color differences were about the lowest among all the nine pasteurized juices. Thus, based on the yellow standard calibration used for color measurement, it appears that pasteurized juices from fruits from planting density D2 were more yellow than all other juices.
4.2 Effects of the agronomic treatments on the juices sensory characteristics
The sensorial results indicated significant differences (p < 0.05) between all pasteurized pineapple juices in terms of sweetness and acidity, pineapple aroma, yellow and brown colors, and apparent viscosity. Of all descriptors, only acid taste significantly increased with planting density and K2O:N ratio. The acid taste of juice D1E3 received the highest average score from the panelists (4.1), although juice D1E1 was the most acid according to its pH value (pH = 4.1). However, the differences between juice D1E1 and juice D1E3 in terms of pH (p = 0.173) and acid taste (p = 0.135) were not significant. Sensory analysis enables the perception of differences in product quality that may be more difficult to detect by conventional analytical methods or through instrumental techniques (CitationMiguel et al., 2010).
Juice D1E2 was scored as the sweetest juice, fully in accordance with its degree Brix of 14.4, which was higher than that of all other juices. Indeed, total soluble solids have a direct and positive influence on the sweetness of pineapple (CitationAppiah et al., 2012). No significant effect of planting density or K2O:N ratio was found for yellow color and pineapple aroma (p > 0.05). Nevertheless, a past research work has linked an increase in the amount of potassium in Smooth cayenne pineapple plants to an improvement of aroma (CitationAgbangba, 2016).
The overcooked taste (mean score 0.5–1.6) perceived in the juices is proof of the typical cooked flavor perception in pasteurized juices (CitationNgadi et al., 2009) related to the pasteurization treatment used (85 °C at 15 min). The brown color (mean score 0.2–2.7) perceived by the panelists for all juices can also be explained as an expression of the effects of pasteurization using the applied method (85 °C at 15 min). Indeed, the processing of pineapple fruits into pasteurized juice is known to lead to a brown color of the juice when temperatures reach 55 °C–95 °C (CitationRattanathanalerk et al., 2005; CitationHounhouigan et al., 2014).
4.3 Juices acceptance: consequence for practical choices
The preference results showed that, in general, all pasteurized juices from fruits treated with K2O:N ratio E2 ( = 1.0) were well accepted by the panelists. Juice D1E2 (obtained from treatment D1: 54 400 plants/ha and E2: 1.0) was the most liked. This is certainly due to the fact that sweetness, yellow color and pineapple aroma are attributes that are of utmost importance to pineapple juice consumers. Actually, both color, a physicochemical parameter, and sensory attributes are discriminating, which confirms that color is one of the most important factors consumers take into account when purchasing a juice product (CitationAsare, 2012). Flavor also, including taste and odor, is key in quality perception of foods (CitationKeast, 2009). Juices D3E2 (obtained from treatment D3: 74 000 plants/ha and E2: 1.0) and D2E2 (D2: 66 600 plants/ha, E2: 1.0) were not significantly different from D1E2 in terms of acceptance, as is also true for juices D3E1 (obtained from treatment D3: 74 000 plants/ha and E1: 0.37). The least appreciated pasteurized pineapple juice stands out as D1E3 with a mean score corresponding to a juice that is neither liked nor disliked. This is caused by its low sweetness and yellowness, but especially its high acidity confirming the discriminative aspect of the acid taste.
5 Conclusion
This study was performed to evaluate the effect of three planting densities and three fertilizer formulations on the physicochemical and sensorial characteristics of pasteurized pineapple juice produced in Benin. Fruits from planting density D2, just as D3, yielded the more yellow pasteurized juices as well as the sweetest ones. A K2O:N ratio equal to 1.0 (E2) on average led to juices with a rich pineapple aroma, sweetness and color. These attributes, being highly important for pineapple juice consumers, showed that the best agronomic treatments were D1E2, D3E2, D3E1 and D2E2. The treatment that copied current farmer practices, namely D1E1 (planting density = 54 400 plants/ha; K2O:N ratio equal to 0.37), yielded fruits that produced a pasteurized juice of low quality, especially regarding the sensory attributes. Further studies should be conducted to evaluate the effects of storage on the quality of both the fruits and the pasteurized juices in order to conclude on the efficacy of the best treatments.
Declaration of Competing Interest
The authors have no confict of interest.
Acknowledgments
The authors acknowledge the Applied Research Fund (ARF) of NWO/WOTRO (Netherlands) for funding the DAPIS project, under which this work was performed. They are also thankful to all consortium members and their collaborators. This project is implemented by a consortium of research institutions from Benin and the Netherlands (FSA/UAC and FQD/WUR), public (Table Filière Ananas – TFA) and private (Groupe Magnificat – GM) practitioners from Benin. It is led by the GM, a private for Profit Company from Benin.
References
- F.T.AdossouNews from Benin: introduction to pineapple industry in BeninNewsletter of the Pineapple Working Group19 ed2012International Society for Horticultural Science
- C.E.AgbangbaAgronomic Responses of Ananas Comosus to Mineral Fertilizer in Benin: Growth, Yield and Fruit Quality, PhD Thesis2016Université Cheikh Anta Diop (UCAD)Dakar[Online] http://intranet.isra.sn/aurifere/opac_css/docnum/CR1600007.pdf [Accessed 21 February 2018]
- F.AppiahP.KumahD.OppongPredicting the consumer acceptability of dried MD2 and smooth cayenne pineapple pulp from chemical compositionJ. Food Res.12012210216
- R.AsareComparative Assessment of Quality of Fruit Juice from Three Different Varieties of Pineapple, Master of Science Thesis2012Kwame Nkrumah University of Science and TechnologgyKumasi(Online]. http://hdl.handle.net/123456789/5878. [Accessed 13 September 2016)
- D.P.BartholomewE.MalézieuxG.M.SanewskiE.SinclairInflorescence, and fruit development and yieldD.P.BartholomewR.E.PaullK.G.RohrbachThe Pineapple: Botany, Production and Uses2003CABI Publishing, UKWallingford
- CACCodex Standards for Pineapple Juice Preserved Exclusively by Physical Means1981Codex Alimentarus Commission (CAC)85
- FAOFood and Agricultural Organisation, FAO/INFOODS-Density Database2015
- FAOSTATFood and Agricultural Organization-statistical Database, Recorded Data for Pineapples Production Quantity in Benin2015, Rome, Italy [Online]. http://www.fao.org/faostat/en/#data/QC. [Accessed 6 June 2018]2015
- V.N.Fassinou HotegniW.J.M.LommenJ.G.A.J.Van Der VorstE.K.AgbossouP.C.StruikAnalysis of pineapple production systems in BeninActa Hortic.92820124758
- V.N.Fassinou HotegniW.J.M.LommenJ.G.A.J.Van Der VorstE.K.AgbossouP.C.StruikBottlenecks and opportunities for quality improvement in fresh pineapple supply chains in BeninInt. Food Agribus. Manage. Assoc.172014139170
- FDAFood and Drug Administration, Approximate pH of Foods and Food Products[Online]. http://www.webpal.org/SAFE/aaarecovery/2_food_storage/Processing/lacf-phs.htm. (Accessed 2 March 2018)2007
- A.N.GaneshamurthyG.C.SatishaP.PatilPotassium nutrition on yield and quality of fruit crops with special emphasis on banana and grapesKarnataka J. Agric. Sci.2420102938
- C.M.GeraldsonPotassium nutrition of vegetable cropsR.D.MunsonPotassium in Agriculture1985ASA-CSSA-SSSAMadison, WI, USA
- M.HanafiG.MazerollesE.DufourE.M.QannariCommon components and specific weight analysis and multiple co-inertia analysis applied to the coupling of several measurement techniquesJ. Chemom.202006172183
- A.HeptonD.P.BartholomewCultural systemD.P.BartholomewR.E.PaullK.G.RohrbachThe Pineapple: Botany, Production and Uses2003WallingfordCABI Publishing, UK
- M.H.HounhouiganA.R.LinnemannM.M.SoumanouM.A.J.S.V.BoekelEffect of processing on the quality of pineapple juiceFood Rev. Int.30201423
- INSAEInstitut National de la Statistique et de l’Analyse économique, RGPH 3 (Troisième Recensement Général de la Population et de l’Habitation)2004DED (Direction des Etudes Démographiques) Cotonou
- R.S.J.KeastFood quality perceptionE.Ortega-RivasProcessing Effects on Safety and Quality of Foods2009CRC PressBoca Raton, Fl
- A.R.KumarN.KumarM.KavinoRole of potassium in fruit crops – a reviewAgric. Rev.272006284291
- C.MarangoniN.F.MouraSensory profile of Italian salami with coriander (Coriandrum sativum L.) essential oilCiência e Tecnologia de Alimentos312011119123
- M.C.MeilgaardG.V.CivilleB.T.CarrSensory Evaluation Techniques4th ed.2006CRC PressBoca Raton
- A.C.A.MiguelS.AlbertiniG.F.BegiatoJ.R.P.S.DiasM.H.F.SpotpPerfil sensorial e aceitação de melão amarelo minimamente processado submetido a tratamentos químicosCiência e Tecnologia de Alimentos302010589598
- M.M.MustaffaInfluence of plant population and nitrogen on fruit yield and quality and leaf nutrient content of ‘Kew’ pineappleFruits431988455458
- M.O.NgadiL.YuM.AmialiE.Ortega-RivasFood quality and safety issues during pulsed electric field processingCRC Press T. A. F. GProcessing Effects on Safety and Quality of Foods2009
- M.Owureku-AsareJ.Agyei-AmponsahS.W.K.AgbemavorJ.ApateyA.K.SarfoA.A.OkyereL.A.TwumM.T.DodobiEffect of organic fertilizers on physical and chemical quality of sugar loaf pineapple (Ananas comosus L.) grown in two ecological sites in GhanaAfr. J. Food Agric. Nutr. Dev.15201599829995
- M.B.PaulaR.V.CarvalhoF.D.NoyerL.F.S.SouzaEfeito da calagem, potássio e nitrogênio na produção e qualidade do fruto do abacaxizeiroPesquisa Agropecuária Brasileira26199113371343
- E.M.QannariP.CourcouxE.VigneauCommon components and specific weights analysis performed on preference dataFood Qual. Prefer.122001365368
- M.RattanathanalerkN.ChiewchanW.SrichumpoungEffect of thermal processing on the quality loss of pineapple juiceJ. Food Eng.662005259265
- A.SpironelloJ.A.QuaggioL.A.J.TeixeiraP.R.FurlaniJ.M.M.SigristPineapple yield and fruit quality affected by NPK fertilization in a tropical soilRevista Brasileira de Fruticultura, Jaboticabal - SP262004155159
- H.StoneJ.SidelSensory Evaluation Practices2nd ed.1993From Academic Press, Inc.1250 Sixth Avenue, San Diego
- D.W.TurnerB.BarkusThe uptake and distribution of mineral nutrients in the banana in response to supply of K, Mg and MnFertil. Res.419838999