
 ?Mathematical formulae have been encoded as MathML and are displayed in this HTML version using MathJax in order to improve their display. Uncheck the box to turn MathJax off. This feature requires Javascript. Click on a formula to zoom.
Abstract
For space geodetic measurements, estimates of tropospheric delays are highly correlated with site coordinates and receiver clock biases. Thus, it is important to use the most accurate models for the tropospheric delay to reduce errors in the estimates of the other parameters. Both the zenith delay value and mapping function should be assigned correctly to reduce such errors. Several mapping function models can treat the troposphere slant delay. The recent models were not evaluated for the Egyptian local climate conditions. An assessment of these models is needed to choose the most suitable one.
The goal of this paper is to test the quality of global mapping function which provides high consistency with precise troposphere delay (PTD) mapping functions. The PTD model is derived from radiosonde data using ray tracing, which consider in this paper as true value.
The PTD mapping functions were compared, with three recent total mapping functions model and another three separate dry and wet mapping function model. The results of the research indicate that models are very close up to zenith angle 80°. Saastamoinen and 1/cos z model are behind accuracy. Niell model is better than VMF model. The model of Black and Eisner is a good model. The results also indicate that the geometric range error has insignificant effect on slant delay and the fluctuation of azimuth anti-symmetric is about 1%.
Keywords:
1 Introduction
One of the major error sources that limit the accuracy in GPS is mismodeling of the tropospheric delay. This delay is experienced by radio waves propagating through the electrically neutral atmosphere. The tropospheric delay is usually divided into two components; hydrostatic (or dry) and non-hydrostatic (or wet) delays. Both dry and wet delays are usually described as a product of the delay at the zenith and a mapping function.
Thus, the mapping function error should be minimized. This constant needs of better mapping function in the analysis of space geodetic data, is the motivation for the assessment of three dry and wet mapping functions. In addition, another three models that do not separate dry and wet terms are assessed. This is done through comparison with PTD (precise troposphere delay) database. Tropospheric mapping functions model, tropospheric azimuthal asymmetry and signal excess path in troposphere are also analyzed here using the PTD database.
2 Data analysis
CitationAbdelfatah et al. (2015) developed a new tropospheric delay model for Egypt (PTD). The metrological data were storage for ten points of the radiosonde from web site (http:/weather.uwyo.edu/upperair/sounding.html). Tropospheric delay model using a ray trace of radiosonde data were used for evaluation the mapping functions (). The PTD database was used to assessment six recent mapping functions that are used for propagation delay will be outlined in details, in Egypt meteorological conditions.
Fig. 1 Tropospheric effect on ray tracking (CitationAbdelfatah, 2015).
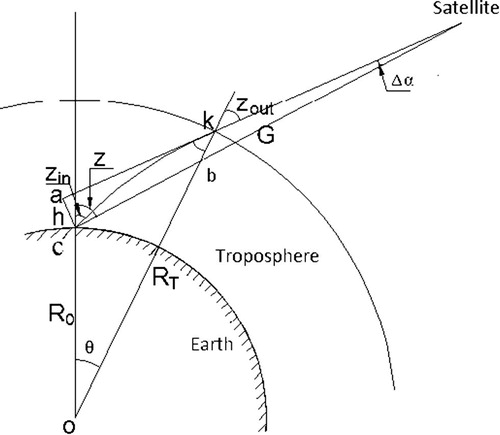
From PTD database, slant delay zenith angles70–88° with interval 2° is calculated. Tropospheric delay at zenith is also computed to be able to separate the PTD mapping function. The lower zenith angles are not included since all the mapping functions show the same good agreement (CitationBoehm and Schuh, 2004) at such angles. The effect of azimuth angles was taken into account indirectly. The azimuth was studied between 0° and 360° with interval of 45°. The data were processed at three days per month in year 2014 - and for 36 stations from Latitude 22° to 32° with interval 2° and from Longitude 25° to 35° with interval 2°.
3 Mapping function data analysis
Some mapping functions do not map separately the two components of the atmospheric delay. Usually there are interested in modeling the zenith dependence of the total atmospheric delay, but certain applications may require independent modeling of each component. As an example, if a WVR is used to estimate the wet components of the delay, mapping function only need to map the hydrostatic component (CitationMendes, 1999). Keeping in mind these possible applications, the dry and wet mapping functions performance will be briefly discussed.
CitationMarini (1972) continued fractional form is the main functional formulation for development of most mapping functions as:(1)
(1) where E is the elevation angel a, b and c are coefficients which depend on the refractivity the path through the atmosphere.
Researchers used the expression from above equation to calibrate coefficients by means of a least squares fit to several ray-traced calculated between low elevation angle (e.g. 3.3o) to zenith. In the following, recent mapping functions are reviewed:
3.1 Black and Eisner mapping function model
This model mainly simplifies the above model, and applies for both dry and wet delay. Its mathematical form is given as (CitationBlack and Eisner, 1984):(2)
(2)
It is worthwhile to mention that both Black and Black and Eisner models are designed to correct the Doppler observations.
3.2 Chao mapping function model
The CitationChao (1972) mapping function is based upon the fit to an average refractivity profile derived from radiosonde observations taken over the period of one year. The continued fraction series for each component is truncated after three coefficients as:(3)
(3) Here he replaced the second sin by tangent of the elevation angle to ensure the series goes to unity at zenith and the coefficients are expressed as:
for dry delay: b = 0.00143 and c = 0.0445
for wet delay: b = 0.00035 and c = 0.017
3.3 Niell model
CitationNiell (1996) introduced his mapping function (NMF) based on temporal changes and geographic location rather than on surface meteorological parameters. NMF developed expression for calculating the mapping function for both hydrostatic and wet delay for elevation angle down to 3°. He used radiosonde data at 26 stations around the world. NMF had been derived from temperature and relative humidity profiles, which are, in some sense, averaged over broadly varying geographical regions. NMF is different for wet and dry tropospheric components. The wet mapping function is given as follows (CitationLeick, 2004):(4)
(4) where E is elevation angle. a, b, and c are coefficients depend on station latitude.
Dry mapping function, on the other hand, is more complex compared to the wet mapping function (e.g. CitationElsobeiey, 2012). It should include height correction as shown below (e.g. CitationSharifi and Souri, 2013).(5)
(5) where
(6a)
(6a)
(6b)
(6b)
(6c)
(6c) a, b, and c are coefficients depend on station latitude, aavg, bavg, and cavg are coefficients depend on station latitude, aamp, bamp, and camp are coefficients depend on station latitude and h is station height. t is a day of the year and To is a constant equals to 28 or 211 for stations at the north and south of the equator, respectively.
In addition to latitude and season dependence due to varying solar illumination, the hydrostatic mapping function should also be dependent on the height above the geoid of the point of observation because the ratio of the atmosphere “thickness” to the radius of curvature decreases with height. This does not apply to the wet mapping function since the water vapor is not in hydrostatic equilibrium, and the height distribution of the water vapor is not expected to be predictable from the station height (CitationNiell, 1996, Citation2001).
3.4 Vienna Mapping Function (VMF)
The hydrostatic and wet Vienna mapping functions are given as (CitationBoehm and Schuh, 2004):(7)
(7)
(8)
(8) where
ah, bh, and ch are hydrostatic mapping coefficients depend on station latitude.
aw, bw, and cw are wet mapping coefficients depend on station latitude.
The more significant improvement in VMF over NMF is that the coefficients ah, and aw are fitted to ray tracing with the NWM of the European Center for Medium-Range weather forecast (ECMWF) in six-hour intervals. On the other hand, the coefficients bh, bw, ch, and cw, are obtained through empirical representations (CitationKouba, 2007). An updated version of the VMF, with improved empirical representation of the coefficients bh, bw, ch, and cw is known as VMF1. The hydrostatic and wet coefficients b and c are given as:(9a)
(9a)
(9b)
(9b)
(9c)
(9c)
(9d)
(9d)
VMF1 data are generated and available from the ECMWF NWM with (2.0° × 2.5°) grid. VMF1 grids include hydrostatic and wet mapping functions coefficients as well as the hydrostatic and wet ZPD. Four files are produced per day at 0, 6, 12, and 18 h UT. ECMWF also produces hydrostatic and wet mapping functions coefficients for most IGS stations since 2004 (CitationKouba, 2007). Each file contains a time series of records, containing the following information: station name, modified Julian date, hydrostatic coefficient “ah”, wet coefficient “aw”, hydrostatic zenith delay in meter, wet zenith delay in meter, mean temperature in Kelvin, pressure at the station in hPa, temperature at the station in degree Celsius, water vapor pressure at the station in hPa, and the approximate orthometric height in meter.
3.5 Saastamoinen model
The standard model of CitationSaastamoinen (1973) is normally used to compute dry delays given surface pressure data (CitationEl-Fiky, and Mousa, 2004). At a given altitude, the relationship between pressure and dry delay is linear; at sea level, a 1 mbar pressure change corresponds to a delay change of about 2.3 mm. In the absence of local pressure data, global models for the dry delay can be reasonably accurate given latitude, ellipsoid height, and day of year; pressure varies over a range of up to about ±5%, leading to comparable errors in the modeled dry delay. The refractivity can be alternatively but equivalently deduced from gas laws. CitationSaastamoinen (1973) models the Tropospheric delay, expressed in meters as,(10)
(10)
The mapping function developed in Saastamoinen (CitationKleijer, 2004) is based upon a truncated binomial series expansion of Snell's law for spherical atmosphere. In Saastamoinen model, there are three kinds of mapping function. The first one is obviously MF (z); this is the mapping function of the flat earth model or single layer model. The second one is tan2 z/cos z. The third one (δR) is an implicit one. The Saastamoinen model drives ban expression for the tropospheric delay is given by:(11)
(11) where the Saastamoinen mapping function is given by:
(12)
(12)
(13)
(13) B(hs) and δR are corrections terms that dependent on the height and zenith, respectively of the observing site.
The tropospheric mapping function that is calculated from the above mentioned models were compared to the one taken from the PTD database (CitationAbdelfatah et al., 2015), which is used at the present study as reference. In the first step, the behavior of 1/Cos, Saastamoinen and Black & Eisner as a total mapping functions are examined. In addition, the NMF, VMF, and Chao mapping function model (dry and wet). Based on PTD database results differences between models and the PTD delay were computed. The root mean squared scatter (RMS) around the mean of that difference is also used to check the stability of the mapping functions (see for example, CitationMousa, 1997). In addition, latitude effects of the delay are taken into account indirectly. At last, the averages were presented as a function of both zenith angles and stations. Here results of models with total mapping function, dry part and wet part are presented in separate sections.
4 Results and discussions
4.1 Total Mapping Function
The results of total mapping functions are given in which summarizes the variation error for all total mapping functions model with zenith angles. Similar to results of seasons, the bias during most of seasons of classic model show a good agreement with the PTD model in zenith angles up to 76°, however 1/Cos and Saastamoinen model break down rapidly. This fact is not surprising for Saastamoinen, as it was developed for observations above zenith angle80° and no correction tables are provided above this cutoff angle. 1/Cos mapping function shows bad performance for all zenith angles. Black & Esiner model have accuracy better than Saastamoinen and 1/Cos models.
Fig. 2 Mean annual biasin total mapping function models with different zenith angles.
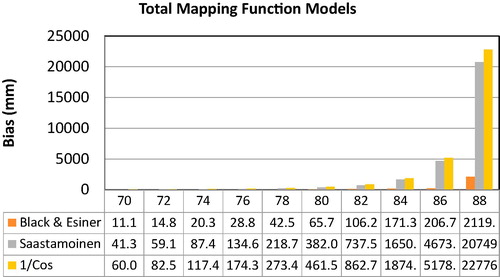
For more details, the average accuracy by Black & Esiner is 219.26 ± 3.69 cm however; Saastamoinen and 1/Cos models have accuracy 2131.98 ± 4.55 cm and 2334.67 ± 4.57 cm, respectively.
Black & Esiner achieves a fair performance for zenith angles below 80°, but break down rapidly at higher zenith angles ().
4.2 Dry mapping function
NMF was built using one year of radiosonde profiles from the northern hemisphere (CitationNiell, 1996); the spatial and temporal variability of the mapping function is accounted for with only a latitude and seasonal dependence. VMF is derived from NWP using ECMWF which is different from Egyptian climate. Dry NMF and VMF are dependent on (zenith angle, latitude, and day of year). Dry NMF includes height correction term. VMF contains also of longitude parameter.
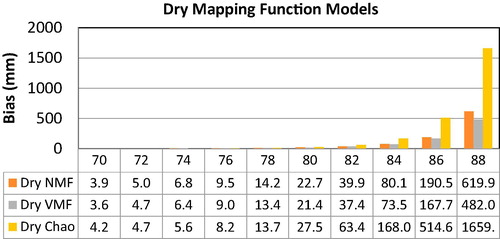
The plots shown, earlier clearly illustrate the good performance of the dry VMF and dry NMF mapping functions and the poor performance of the Chao mapping function.
In contrast, the variation of bias during most seasons of classic model show a good agreement with the PTD model in zenith angles up to 70°, however Chao model did not achieve good accuracy in high zenith angles.
summarize the error budget of zenith angles for all dry mapping function models. It is to be noted here that dry VMF shows performance better than dry NMF for all zenith angles. In contrast, dry NMF shows better performance than VMF in RMS.
Fig. 3 Mean annual biasin dry mapping function models with different zenith angles.
4.3 Wet mapping function
illustrated the error budget of wet mapping function models. The estimated errors value of NMF and VMF model, give 6.3 mm at zenith angle 82°. It is sufficiently accurate for precise geodetic application.
Fig. 4 Mean annual biasin wet mapping function models with different zenith angles.
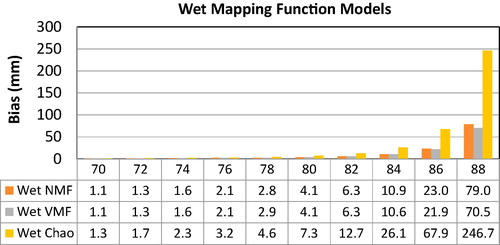
The wet mapping function of Chao reveals a fair global performance for zenith angles below 76°, but degrades significantly for higher zenith angles (lower elevation angles).
4.4 Geometric range error
The geometric delay part is separated from PTD database model for each elevation angle in order to assess its effect. The results are seen from , the geometric delay is insignificant up to zenith angle of 80° (E = 10° where E is elevation angle). The calculated values at the geometric delay are near to the value calculated by CitationMendes (1999).
Fig. 5 Total geometric range error (m) using PTD database model and Mendes model.
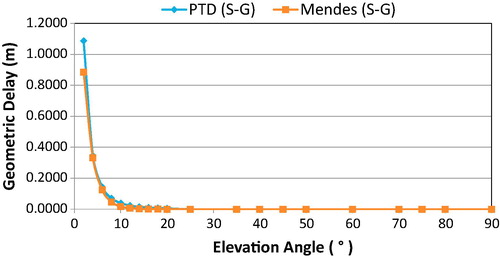
CitationMendes (1999) develop model for the delay caused by the bending based on ray tracing results:(14)
(14) With a = 2.256 ± 0.0092 m, b = 2.072 ± 0.0054°.
The results of PTD data base model in (S-G) is shown in . The results can be neglected up to zenith angle 80° and it near to Mendes model.
The separation of the neutral-atmosphere propagation delay into two components is advantageous, as the geometric delay is only significant for radio signals coming from high zenith angles (below about 80°); furthermore, for a horizontally stratified atmosphere, S and G are identical in the zenith direction and the geometric delay is zero. The results of the evaluation of the total mapping functions show surprisingly poor performance for the Egypt sites, although dry and wet models showed good agreement. It is worth noting here that all the total mapping functions overestimate the total delay. This might be attributed to the special topography of the Egypt sites.
Errors due to models that use total mapping function is generally greater than of the ones use separate dry and wet mapping function. Three-dry mapping functions have been analyzed.
The geometric delay is essentially a function of the elevation angle, and it is significant only at elevation angles below 10°, reaching more than 1.08 m at 2°elevation angle.
5 Conclusions
In the present paper six mapping function models were assessed by using PTD database. These models are separated into two major groups: three total mapping functions models (dry and wet), and three other models, which separate dry and wet mapping function. The assessment was performed using 36 stations obtained PTD through one year covering Egypt. The assessment of mapping function models indicated that total mapping functions achieve poor accuracy in all cases. The dry NMF shows smaller biases with respect to dry VMF. The wet VMF is the best model. All models which does not separate dry and wet mapping function cannot achieve the required accuracy needed for high accurate applications.
The geometric range error is insignificant effect on slant delay and it can be neglected in accurate geodetic applications up to zenith angel 80°.
Notes
Peer review under responsibility of National Research Institute of Astronomy and Geophysics.
References
- Abdelfatah, 2015. Database for Precise Troposphere Delay Model for Egypt, as Derived from Radiosonde Data, Ph.D. Thesis, Faculty of Engineering, Zagazig University.
- M.A.AbdelfatahA.E.MousaG.S.El-FikyPrecise troposphere delay model for egypt, as derived from radiosonde dataJ. NRIAG2015 Manuscript Number: NRIAG-D-14-00033R1
- H.D.BlackA.EisnerCorrecting satellite doppler datat for tropospheric effectsJ. Geophys. Res.89D2198426162626
- J.BoehmH.SchuhVienna mapping functions in VLBI analysesGeophys. Res. Lett.3112004L0160310.1029/2003 GL018984
- Chao, C.C., 1972. A model for tropospheric calibration from delay surface and radiosonde ballon measurements. JPL Technical Memoradum, JET Propulsion Laboratoty, Pasadena, Calif., USA, pp. 391–396.
- El-Fiky, G.S., Mousa, A.K., 2004. Test of Global Zenith Hydrostatic Delay Models of GPS Measurements for the Egyptian Climate, vol. 39, no. 1. Ain Shams University Faculty of Engineering.
- Elsobeiey, M., 2012. An Improved Model For Precise Point Positioning With Modernized Global Positioning System. PhD. Thesis, Civil Engineering Dep., Ryerson University.
- Kleijer, F., 2004. Troposphere Modeling and Filtering for Precise GPS Leveling, Netherlands Geodetic Commission, Delft University of Technology.
- JanKoubaImplementation and testing of the gridded Vienna Mapping Function 1 (VMF1)J. Geod.822007193205
- A.LeickGPS Satellite Surveying32004John Wiley & Sons, Inc.Hoboken, New Jersey
- J.W.MariniCorrection of satellite tracking data for an arbitrary tropospheric profileRadio Sci.721972223231
- Mendes, V.B., 1999. Modelling the neutral-atmosphere propagation delay in radiometric space techniques. Ph.D. dissertation. Department of Geodesy and Geomatics Engineering. Technical Report no. 199, University of New Brunswick, Fredericton, New Brunswick.
- A.K.MousaCharacteristics of Wet Tropospheric Delay Deduced from Water Vapor Radiometer Data and their Implications for GPS Baseline Solution Accuracy Ph. D. Thesis1997Faculty of Science, Kyoto UniversityKyoto, Japan
- A.E.NiellGlobal mapping functions for the atmosphere delay at radio wavelengthsJ. Geophys. Res.101B2199632273246
- A.E.NiellPreliminary evaluation of atmospheric mapping functions based on numerical weather modelsPhys. Chem. Earth262001475480
- J.Saastamoinencontribution to the theory of atmospheric refractionBull. Geodesique10719731334
- Sharifi, M.A., Souri, A.H., 2013. Symmetric neutral-atmosphere mapping functions: a review of the state-of-the-art artificial satellites, 48(4). http://www.10.2478/arsa-2013-0014.