
 ?Mathematical formulae have been encoded as MathML and are displayed in this HTML version using MathJax in order to improve their display. Uncheck the box to turn MathJax off. This feature requires Javascript. Click on a formula to zoom.
Abstract
Using the IAP experiment on board, the DEMETER and TEC from GPS data, unusual ionospheric variations have been observed some days before the 7.4 magnitude New Zealand earthquake. Both sets of data recorded perturbations 10 days before the earthquake at about the same time. The total ion density per centimeter cube (cm−3), recorded a variation of 6.94 while the differential total electron content (DTEC) in total electron content unit 1016 electron per metre square gave a value of 2.93TECU. The observed anomalies were screened for false alarm using the geomagnetic indices of Kernnifzer digit (Kp) and disturbance storm time (Dst.) It was however seen that the state of the ionosphere was geomagnetically quiet during this period; hence the observed variations were seismogenic.
Keywords:
1 Introduction
The damaging nature of earthquakes and their frequent occurrences characterize the natural disasters that continue to challenge the existence of life on planet earth as thousands of lives and properties valued at billions of US dollars are destroyed every year. Their challenges are particularly more damaging in some third world countries like India, New Zealand, Pakistan, Haiti, China, Japan and Indonesia, where a large chunk of the world’s population resides (CitationMeli and Alcocer, 2000). The location of some of these countries in the Circum-Pacific Ring of Fire, characterized mainly by subduction tectonics, have increased their occurrence rate, thus causing over eighty percent of the more damaging earthquakes to be concentrated there. Comparatively, other regions like the East Atlantic, where the West Africa is located, their impacts are generally low though not completely free (CitationMurty et al., 2005). The pains and challenges posed by this repetitive natural disaster have prompted scientists to conduct broad-based researches on various phenomena relating to this disastrous event with a view to predicting them. Thus, for many decades, understanding earthquake corollaries and ways of mitigating them have continued to dominate discussions at many scientific and social fora.
Earthquakes of varying types and magnitudes occur every year. Generally, earthquakes refer to any seismic event originating from either natural or human activities, which generate seismic waves that propagate through the earth’s interior. Thus, excepting earthquakes from natural causes, whose occurrences are sometimes more catastrophic, earthquakes can also be induced by human activities like mining (CitationFrancesco and Bizzarri, 2014; CitationBommer et al., 2015), oil exploration and exploitation activities (CitationMcGarr, 2014; CitationDavies et al., 2013), groundwater over exploitation (CitationKlose, 2013; CitationGupta, 1983), dam construction (CitationVerdugo and Gonzalez, 2015) etc. However, earthquakes originating from human activities are usually of low magnitudes (tremors/microseisms). In all cases, particularly those of natural origin, the amount of elastic strain energy released during earthquake and their effects have continued to desperately, confer on man dire need to find reliable precursors for it. Thus, common questions of research interest provoked from the resulting scenario are: “what happened in the weeks, days and even hours before this terrifying event occurred? And were there indicators that such a disaster was on the way? Scientists have, however, acknowledged that all seismic electromagnetic anomalies are hallmark of processes, which started days prior to the main event and persisted few days after it (CitationAkhoondzadeh et al., 2010). This seismic event by itself rarely kills people or animals, but the secondary events triggered by it like collapse of buildings, fires, tsunamis (seismic sea waves) and volcanoes, are actually the main cause of human disaster. Better designs and constructions of dwelling places, safety systems, early warnings and planning, are some ways that could help in mitigating their risk (CitationCelebi et al., 2012).
Earthquakes are very complicated physical processes being neither regular nor linear. This has conferred on it a high degree of sophistication such that predicting it from its dynamic relation between its parameters always results in a high degree of uncertainty. Hence, it has become absolutely imperative that we find more reliable approaches of studying, monitoring and understanding the underlying physical and chemical processes that usually precede them. Preparatory to an earthquake activity, a vast amount of energy is usually transferred due to crustal movement and at the instant of the shock, a break down occurs between the source of the energy and the environment. Studies have shown that these alterations before, during and after such events do have different physical and chemical effects on the lithosphere, atmosphere and ionosphere (CitationChmyrev et al., 2013; CitationRozhnoi et al., 2009, CitationKamogawa, 2006; CitationHayakawa and Molchanov, 2002; CitationRapoport et al., 2004) thus making their detection possible. Consequently, perturbations in threshold state of lithospheric, atmospheric and ionospheric parameters can serve as earthquake indicators (precursor). If these ionospheric perturbations are real and systematic, then they could serve as short-term precursor, happening before, between and after the seismic events. All precursors are not expected for all events, hence a single precursor cannot be used alone in forecasting earthquake but an integrated approach employing different precursors from different experiments is the best.
1.1 The DEMETER satellite data
DEMETER is an acronym that stands for Detection of Electromagnetic Emissions Transmitted from Earthquake Regions. It is a microsatellite that was launched by the French Space Agency: Centre National D’etudes Spatiales (CNES) at about 06:30 UTC from Baikonour (Kazakhstan) on 29th June, 2004 aboard a Dnepr rocket launcher. Its transmission into space was done with a very high precision and it reached the required orbit with the following parameters: altitude of 709 km, inclination of 980, orbit period (100 min), orbits per day (14) (data available in half orbit) (CitationCussac et al., 2006). DEMETER was designed like a rectangular shaped box with dimensions of 60 × 85 × 11 cm and a total mass of 129 kg. DEMETER’s orbit was polar, circular and nearly sun-synchronous and measurements were made at approximately two different local times 10:30 and 22:30 UTC (CitationKintner et al., 2013).
However, the altitude of this satellite was reduced to about 660 km in December 2005 and it was located onboard a Low Earth Orbit (500 to 2000 km in altitude) and visible for 10–20 min at a time. Medium Earth Orbit (2000 km to a little below 35,786 km) and Geostationary satellites (orbiting the earth above the Equator at a constant distance of 35,786 km and covering about 1/3 of the earth’s surface per time) also exist (CitationParrot, 2012; CitationSonakia, 2014). DEMETER was operated in two modes (i) a survey mode that recorded low bit rate data all around the Earth at invariant latitudes less than ∼ 65°. This mode was equipped with an onboard processing facilities used in reducing telemetry flow rate to 25 kb/s, and (ii) a burst mode that recorded high bit rate data of 1.7 mb/s above seismic active regions. Burst mode recording was automatically triggered whenever satellites crossed a seismic zone. In general, the time and space locations of either of the two modes were determined as function of the ground volcanic and seismic targets (CitationParrot et al., 2014)
The primary scientific objectives of DEMETER experiments were to investigate the disturbances of the ionosphere from seismo-electromagnetic effects and from anthropogenic activities which cover Power Line Harmonic Radiation, Very Low Frequency (VLF) Transmitters, and High Frequency broadcasting stations). This involved detection and characterization of ionospheric electrical and magnetic perturbations in connection with seismic activity. The scientific payload of the DEMETER is made up of a three-axis magnetic search-coil instrument (IMSC), four electrical sensors (ICE), two Langmuir probes (ISL), a plasma analyzer (IAP), energetic particle detector (IDP) and electronic units (BANT). The IMSC captor was set at the end of a 1.9 m long boom while the ICE captors were kept at the extremes of four booms each 4 m long, to avoid electromagnetic disturbances to the sensors from the satellite (CitationHayakawa, 2016).
IMSC unit had three orthogonal magnetic antennae joined to a pre-amplifier unit with a shielded wire of 80 cm. This magnetometer is made up of a core in perm alloy on which the main coil of several thousand turns (12,000) of copper wire were wound and a secondary coil with just a few turns. The flat frequency response of the VLF went from 100 Hz up to 17.4 kHz. The IMSC measured the three components of the magnetic field in a frequency range from a few Hz to 20 kHz (CitationParrot et al., 2006; CitationKintner et al., 2013)
Instrument champ Electrique (ICE) experiments were on the DEMETER mission with the aim of providing a near continuous survey of the electromagnetic and or electrostatic waves which may arise from coupling the seismic activity with the upper atmosphere and ionosphere. It used four spherical electrodes with embedded pre-amplifiers to measure the three components of the electric field in a frequency range from DC to 3.5 MHz.
The solid state energetic particle detector (IDP) with a wide geometrical factor was designed to measure trapped electron fluxes in the range of 70 keV–0.8 MeV. It also provided information on the electron fluxed between 0.8 and 2.5 MeV. The ultimate aim of this experiment was to measure high energy electrons and protons (CitationBuzzi, 2007, CitationAkhoondzadeh et al., 2010).
The RNF experiments were used for continuous recording of other electromagnetic phenomena like whistler. It consisted of a neural network system, which was utilized to automatically identify and classify electromagnetic waves from the extremely low frequency to very high frequency signals usually encountered by the satellite, hence identification of whistlers on board the DEMETER.
The instrument d’ Analyse du plasma (IAP) unit generated a continuous record of the main parameters of the thermal ion population with two goals: (a) detection of disturbances in the ionosphere that may result from the coupling between seismic event on the ground and upper atmosphere and ionosphere, and (b) provision of sufficient time resolution for ionospheric parameters such as plasma density and ion composition required for the analyzes of plasma wave data obtained from ICE and IMSC experiments. The plasma analyzer instrument was carefully designed to record the parameters of the thermal population, which are the densities of the main ionospheric ions: hydrogen (H+), helium (He+) and oxygen (O+) (within a range of 102–5.105 ions/cm3), their temperatures (from 500–5000 K) and the ion flow velocity in the earth’s frame of reference (CitationBerthelier et al., 2006).
The Langmuir probe experiment, technically called instrument Sonde de Langmuir (ISL), was designed for in-situ measurements of the bulk ionospheric thermal plasma parameters. This instrument has two sensors: a classical cylindrical sensor and a spherical sensor whose surface was segmented into seven sections (six electrically isolated spherical caps and other part of the sphere used as a guard electrode). The ISL experiment measured the electron density of plasma (108–5⋅1011 m−3), electron temperature (600–10,000 K) and satellite potential (∼±3 V) in the ionosphere from which the relative ion and electron density along orbits of the DEMETER satellite were derived. Variations of these parameters were given with a time resolution of 1 s (CitationBerthelier et al., 2006, CitationBrien and Cornely 2015).
The DEMETER satellite mission ended on 9th December, 2010 but its data are archived at Centre de Données de la Physique des Plasmas (CDPP) and can be accessed through the web server (http://demeter.cnrs-orleans.fr//). The data are organized and plotted in half orbits. CDPP provides a huge array of data to investigate variations in electromagnetic emissions; production of plasma inhomogeneities and other ionospheric phenomena associated with seismic events. Its high sensitivity promotes the reliability of its data. In this research, data from the IAP and ISL sensors in the burst mode were used. However, there were some days that the satellites operated on safe mode and on such days, there were no records of any experiments (CitationParrot, 2012).
1.2 GPS TEC data
The Global Positioning System (GPS) satellites have become primary sensors to measure signatures related with natural hazards such as earthquake. The GPS is a group of satellite that orbits the earth twice daily at an altitude of about 20,000 km. The huge network of GPS receivers (a few thousands all over the planet) explains simultaneous coverage in universal scale with high temporal resolution. From a list of International Global navigation satellite system service (IGS) station code, the IGS station within the radius of the earthquake preparation zone (1520.55 km) at DUND lying 655 km from the epicenter was selected. A request for the observation file was made 30 days before and 10 days after earthquake. Applying the RINEX Gopi software, total electron content (TEC) was calculated from the observation data. Thus, total electron content (TEC) variations are often investigated for seismo- ionospheric precursors due to TEC data global analysis, continuous observation and satisfactory time- and space-resolution plus enormous amount of the data available. TEC is defined as the total number of electrons integrated along the path from the receiver to each GPS. The GPS satellites transmit two frequencies of signals (LI = 1575.42 MHz and L2 = 1227.60 MHz). These GPS receivers are capable of detecting ionospheric TEC perturbations caused by surface-generated Rayleigh, acoustic and gravity waves. TEC can be used to estimate spatial sizes and temporal dynamics of pre-earthquake ionospheric effects in any seismogenic region. TEC factor is predominantly associated with density in the F-layer which is greater than in the other layers (CitationSunil et al., 2015); providing an opportunity to detect any acoustic, gravity, or both types of waves perturbations in the upper atmosphere This technique has been used to identify perturbations due to an earthquake by CitationCalais and Minster (1995). CitationZaslavski et al. (1998) have employed a statistical approach with TEC data from TOPEX – POSEIDON to check connections between ionospheric perturbations and seismic event. CitationLiu et al. (2002), equally used a statistical technique to obtain the ionospheric TEC from data measured by a network of the GPS in Taiwan. As a part of the earthquake process, the Earth’s surface is being deformed due to the accumulation of strain and slips over time. GPS is used to monitor this movement by measuring precisely the position (within 5 mm or less) of stations near active faults relative to each other. TEC data based on the date and geographic location of seismic event from about 30 days before to 10 days after the main seismic event have been processed in this study. The GPS station nearest to the epicenter of this event had a code of DUND (Dunedin New Zeeland of latitude -45.880 and longitude 170.596).
1.3 Geomagnetic data
Regional but significantly large-scale changes in atmospheric electricity over seismically active zones before the seismic shock are transformed to the ionosphere by means of a large-scale electric field. From the penetration of this electric field into the ionosphere, electron concentration anomalies are observed when the region affected has an area with a diameter larger than 200 km2 (CitationDobrovolsky et al., 1979). However, the disparities in the ionospheric parameters are not only due to earthquakes as there are numerous possibilities of ionospheric distresses that can originate from other sources (solar activity, acoustic gravity waves, traveling ionospheric disturbances, plasma dynamics, and large meteorological phenomena). Consequently, the observed parameters may exhibit variations in the absence of seismic activity; hence, it is difficult to isolate pre-seismic ionospheric phenomena from the ionospheric turbulences due to the solar-terrestrial activities (CitationOndoh, 2008). Thus, to differentiate the seismo-ionospheric perturbations from geomagnetic instabilities, the geomagnetic indices Dst and Kp were checked. The Kp index screens the planetary activity on a universal scale whereas the Dst index registers the equatorial ring current variations (CitationMayaud, 1980). The ionospheric influence of a geomagnetic storm has a global effect being observed all over the world while, the seismogenic impact is observed only by places with distance less than 2000 km from the potential epicenter (CitationPulinets et al., 2003).
2 Methodology
The earthquake used in this study, had relevant information including time of occurrence, geographic location and magnitude of event, closest orbits to the epicenter (at a resolution of 200 for longitude and 100 for latitude) were selected 30 days before and 10 days after the earthquake. This time period was carefully selected to allow enough time in monitoring of the ionospheric plasma parameter from its natural to perturbed state enhancing separation of seismic anomalies from the background of natural variations, expecting the former to appear at the end of the period. Different time windows ranging from five days to two months have been used to monitor the ionosphere but principally, reports on seismo-electromagnetic variations are observed three weeks or less to the earthquake day (CitationPíšaet al., 2011; CitationRong et al., 2008; CitationParrot, 2012). The total ion density (Oxygen, Hydrogen and Helium ions from the IAP Sensor) were obtained by downloading data files from the DEMETER website. Data from each orbit were confined to the two modes but only the burst mode data were used in this research.
The median and the inter-quartile range of the data were used to obtain their upper and lower limits in order to distinguish seismic variances from the background of regular variations. A reference value k was selected to be 2.1. Any perturbations outside these bounds were anomalous. These involved computation of upper and lower boundaries, median value and inter-quartile range using Eqs. (Equation(1)(1)
(1) Equation(3)
(3)
(3) ) below:
(1)
(1)
(2)
(2)
(3)
(3) where X, XH, XL, M, IQR and Dx are parameter values, upper bound, lower bound, median of the data, inter-quartile range and differential of x respectively. From Eq. (Equation3
(3)
(3) ), if the absolute value of Dx is greater than k, (i.e., |Dx| > k), (|Dx| > k), then the behaviour of x is considered to be anomalous. K values must be selected to be proportional to earthquake magnitude and therefore, for large events with M > 7.0, values greater than 2 may be used. Variations of the ionospheric parameters depend on the local time (CitationAkhoondzadeh et al., 2010).
3 Results and discussion
Perturbations in the plasma parameters of the ionosphere obtained by DEMETER and GPS data obviously presented itself 10 days prior to Auckland Island earthquake above the vicinity of the impending seismic event. A comprehensive report on the findings in all three data sets is shown in . Days are relative to the earthquake day (0) with negative and positive indicting pre and post days. A very striking revelation was that the observed variations −10 days occurred at about the same time (22:00 and 22:30 UTC) in both sets of data on that day. The GPS recorded an anomalous value of 2.93TECU at 22:00 UTC while the IAP displayed a very sharp value of 6.94 in the night time half orbit of that same day in the total ion density. displays the DTEC (2a) together with the geomagnetic indices. In other to discriminate these twin perturbations from geomagnetic activities, the geomagnetic indices of kp and Dst were checked (b and c). These presented a quiet geomagnetic activity on that day. However, the observed TEC perturbations 7 days before the earthquake was geomagnetically induced as the kp indicated an activity during that period. In the same vein, the DEMETER variations of -13 and -1 were not seimo- induced as the geomagnetic indices were active. It is worthy to note that all the observed total ion density irregularities were detected in the night time half orbits () showing that the signals were better depicted in the night. This is consistent with the report of CitationPulinets and Boyarchuk (2004), which showed that the efficiency of the anomalous electric field penetration into the ionosphere at night is higher than in daytime. The unusual variations observed in the investigated parameters from the GPS and DEMETER data had a similar (positive) sign.
Fig. 1 Auckland Island New Zealand Earthquake of 30-09-07 m = 7.4 (a) Night. (b) Morning.
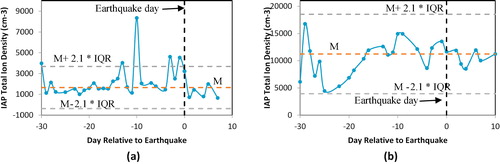
Fig. 2 Results of (a) DTEC. (b) Kp geomagnetic index. (c) Dst geomagnetic for Auckland islands earthquake of 30-09-2007.
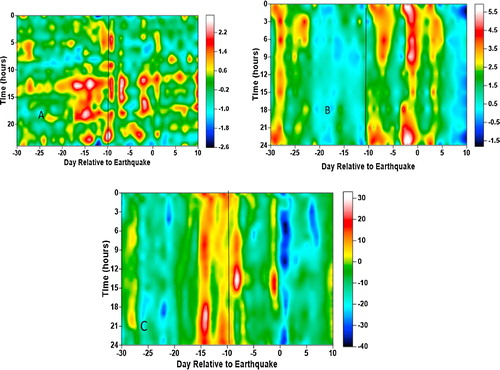
Table 1 List of the earthquake and detected anomalies (Day is relative to the earthquake day).
Also, by virtual inspection from −17 through −14 around 13:00 h, the DTEC showed anomalous behaviours. Correlating these perturbations with the Kp and Dst plots, these indices of geomagnetic activities were quiet about this time, suggesting a seimo-induced perturbations. On the other hand, the GPS detected anomalies of 7 and 2 days prior to the seismic event could not have been solely seismogenic since the state of the ionosphere was not geomagnetically quiet. In fact both indices of geomagnetic activities used pictured strong activities two days to the earthquake. The case is also similar to the IAP total ion density variation observed a day to the earthquake occurring in geomagnetically activity period. However, from , both GPS and DEMETER data revealed only pre-seismic anomalies.
4 Conclusion
Ionospheric data investigated at the height of the satellite have been processed together with TEC data (density integrated along the total ionosphere) at the time of a major earthquake. We have displayed in this study, the effectiveness of DEMETER IAP device to identify striking anomalies in total ion density parameter and also GPS data to observe anomalies in total electron content variations, in the neighborhood of strong earthquake epicenter some days before its occurrence. It should however be noted that the pre-seismic ionospheric abnormalities which occurred 10 days before this earthquake on both data sets were positive. Since geomagnetic activity was very quiet throughout the days around the studied earthquake date, the identified anomalies can be inferred as pre-seismic ionospheric variations. Nonetheless, it is essential to bear in mind, that the ionosphere exhibits complicated behavior even under quiet geomagnetic condition and the measured parameters sometimes display variations in quiet seismic condition that can be associated with other unknown factors. The seismo ionospheric anomalies represented in this paper are promising for the short term prediction but attention has to be paid to further investigation required to obtain a very precise regional model of quiet time for ionosphere to classify seismic precursors from the background of daily variations.
Acknowledgements
The authors would like to acknowledge the NASA Jet Propulsion Laboratory for the TEC data, the NOAA for the geomagnetic index and CNRS/LPC2E for the DEMETER data.
Notes
Peer review under responsibility of National Research Institute of Astronomy and Geophysics.
References
- M.AkhoondzadehM.ParrotM.R.SaradjianElectron and ion density variations before strong earthquakes (M>6.0) using DEMETER and GPS dataNat. Hazards Earth Syst. Sci.102010718
- J.J.BerthelierM.GodefroyF.LeblancE.SeranD.PeschardP.GilbertJ.ArtruIAP, the thermal plasma analyzer on DEMETERPlanet. Space Sci.542006487501
- J.J.BommerH.CrowleyR.PinhoA risk-mitigation approach to the management of induced seismicityJ. Seismolog.1922015623646
- M.O.BrienP.R.CornelyAnalyzing anomalies in the ionosphere above Haiti surrounding the 2010 earthquakeJ. Young Investigators29520153640
- Buzzi, A., 2007. DEMETER Satellite Data Analysis of Seismo-Electromagnetic Signals. Unpublished Doctorate Thesis, Faculty of Science, Department of Physics, Roma Tre University of Rome.
- E.CalaisJ.B.MinsterGPS detection of ionospheric perturbations following the January 17, 1994, Northridge earthquakeGeophys. Res. Lett.22199510451048
- Celebi, M., Page, R.A., Seekins, L., 2012. Building Safer Structures (USGS Earthquake Hazards Program). Retrieved from http://earthquake.usgs.gov/learn/publication%20/saferstructure/.
- V.ChmyrevA.SmithD.KatariaB.NestorC.OwenDetection and monitoring of earthquake precursor. Twinsat, A Russia – UK satellite projectAdv. Space Res.526201311351145
- T.CussacM.ClairP.Ultré-GuerardF.BuissonG.Lassalle-BalierM.LeduC.ElisabelarX.PassotN.ReyThe Demeter microsatellite and ground segmentPlanet. Space Sci.542006413427
- R.DaviesG.FoulgeraA.BindleyaP.StylesInduced seismicity and hydraulic fracturing for the recovery of hydrocarbonsMar. Pet. Geol.452013171185
- I.R.DobrovolskyS.I.ZubkovV.I.MyachkinEstimation of the size of earthquake preparation zonesPure Appl. Geophys.117197910251044
- Francesco M., Bizzarri, A., 2014. Anthropogenic triggering of large earthquakes. Scientific Reports 4, Article number: 6100. 10.1038/srep06100
- H.K.GuptaInduced seismicity hazard mitigation through water level manipulation at Kryna India: a suggestionBull. Seismolog. Soc. Am.731983679682
- M.HayakawaO.A.MolchanovSeismo- Electromagnetics: Lithosphere-Atmosphere-Ionosphere Coupling2002Terra Scientific Publishing Company, TokyoTokyo
- Hayakawa, M., 2016. Earthquake Prediction with Radio Techniques. Google Books Results 265.
- M.KamogawaPre-seismic lithosphere-atmosphere–ionosphere couplingEOS Trans. Am. Geophys. Union87402006417424
- Kintner, P.M., Coster, A.J., Rowell, T.F., Mannucci, A.J., Mendillo, M., Heelis, R., 2013. Mid latitude Ionospheric Dynamics and Disturbances. America: American Geophysical Union.
- C.D.KloseMechanical and Statistical evidence of the causality of human-made mass shifts on the Earth’s upper crust and the occurrence of earthquakesJ. Seismolog.1712013109135
- J.Y.LiuY.J.ChuoS.A.PulinetsH.F.TsaiX.ZengA study on the TEC perturbations prior to the Rei-LiM.HayakawaO.A.MolchanovChi-Chi and Chai-Yi earthquakes. In Seismo-Electromagnetics: Iithosphere-Atmosphere-Ionosphere Coupling2002Terra Scientific Publishing CompanyTokyo297301
- P.N.MayaudDerivation, Meaning and use of geomagnetic indices, Geophysical Monograph 221980American Geological UnionWashington DC
- A.McGarrMaximum magnitude earthquakes induced by fluid injectionJ. Geophys. Res. Solid Earth1192201410081019
- Meli, R., Alcocer, M.S., 2000. Challenges in the implementation of earthquake disaster reduction programs. In: Proceeding at the12th World Conference on Earthquake Engineering (2465).
- T.S.MurtyN.NirupamaI.NistorA.D.RaoWhy the Atlantic generally cannot generate trans-oceanic tsunamiIndian Soc. Earthquake Technol. J. Earthquake Technol.4242005227236
- Ondoh, T., 2008. Investigation of precursory phenomena in the ionosphere, atmosphere and groundwater before large earthquakes of M >6.5. Adv. Space Res. vol. 43, pp. 214–223.
- M.ParrotStatistical analysis of automatically detected ion density variations recorded by DEMETER and their relation to seismic activityAnn. Geophys.5512012149155
- M.ParrotD.BenoistJ.J.BerthelierJ.BleckiY.ChapuisF.ColinF.ElieP.FergeauD.LagoutteF.LefeuvreC.LegendreM.LevequeJ.L.PinconB.PoirierH.C.SeranP.ZamoraThe magnetic field experiment IMSC and its data processing onboard DEMETER: scientific objectives, description and first resultsPlanet. Space Sci.5452006441455
- M.ParrotF.NemecO.SantolikStatistical Analysis of VLF radio emissions triggered by power line harmonic radiation and observed by the low-altitude satellite DEMETERJ. Geophys. Res. Space Phys.1197201457445754
- Píša, D., Parrot, M., Santolík, O. 2011. Ionospheric density variations recorded before the 2010 Mw 8.8 earthquake in Chile. J. Geophys. Res. vol. 116, A08309. 10.1029/2011JA016611
- S.A.PulinetsK.A.BoyarchukIonospheric Precursors of Earthquakes2004Springer, Verlag Publishers. GermanyBerlin
- S.A.PulinetsA.D.LegenT.V.GaivoronskayaV.K.DepuevMain phenomenological features of ionospheric precursors of strong earthquakesJ. Atmos. Solar Terrestrial Phys.65200313371347
- Y.RapoportV.GrimalskyM.HayakawaChange of ionosphere plasma parameters under the influence of electric field which has lithospheric origin and due to radon emanationPhys. Chem. Earth.292004579587
- Z.RongJ.FengO.Xin-yanIonospheric perturbations before Pu’er earthquake observed on DEMETERActa Seismol. Sin.21120087781
- A.RozhnoiM.SolovievaO.MolchanovK.SchwingenschuhM.BoudjadaP.F.BiagiT.MaggipintoL.CastellanaA.ErminiM.HayakawaAnomalies in VLF radio signals prior the Abruzzo earthquake (M = 6.3) on 6 April 2009Nat. Hazards Earth Syst. Sci.9200917271732
- A.SonakiaInvestigation of lonospheric perturbation due to Seismic activity using satellite and ground based observationsInt. J. Res. Eng.1220141519
- A.S.SunilM.S.BagiyaC.D.ReddyM.KumarD.S.Durbha Sai RameshPost-seismic ionospheric response to the 11 April 2012 East Indian Ocean doublet earthquakeEarth Planets Space6720153710.1186/s40623-015-0200-8
- R.VerdugoJ.GonzalezLiquefaction- induced ground damages during the 2010 Chile earthquakeScienceDirect.792015280295
- Y.ZaslavskiM.ParrotE.BlancAnalysis of TEC measurements above active seismic regionsPhys. Earth Planet. In.1051998219228