
 ?Mathematical formulae have been encoded as MathML and are displayed in this HTML version using MathJax in order to improve their display. Uncheck the box to turn MathJax off. This feature requires Javascript. Click on a formula to zoom.
Abstract
The application of a GIS – based Dempster – Shafer data driven model named as evidential belief function EBF- methodology to groundwater potential conditioning factors (GPCFs) derived from geophysical and hydrogeological data sets for assessing groundwater potentiality was presented in this study. The proposed method’s efficacy in managing degree of uncertainty in spatial predictive models motivated this research. The method procedural approaches entail firstly, the database containing groundwater data records (bore wells location inventory, hydrogeological data record, etc.) and geophysical measurement data construction. From the database, different influencing groundwater occurrence factors, namely aquifer layer thickness, aquifer layer resistivity, overburden material resistivity, overburden material thickness, aquifer hydraulic conductivity and aquifer transmissivity were extracted and prepared. Further, the bore well location inventories were partitioned randomly into a ratio of 70% (19 wells) for model training and 30% (9 wells) for model testing. The synthesized of the GPCFs via applying the DS – EBF model algorithms produced the groundwater productivity potential index (GPPI) map which demarcated the area into low – medium, medium, medium – high and high potential zones. The analyzed percentage degree of uncertainty for the predicted lows potential zones classes and mediums/highs potential zones classes are >10% and <10%, respectively. The DS theory model-based GPPI map’s validation through ROC approach established prediction rate accuracy of 88.8%. Successively, the determined transverse resistance (TR) values in the range of 1280 and 30,000 Ω my for the area geoelectrically delineated aquifer units of the predicted potential zones through Dar – Zarrouk Parameter analysis quantitatively confirm the DS theory modeling prediction results. This research results have expand the capability of DS – EBF model in predictive modeling by effective uncertainty management. Thus, the produced map could form part of decision support system reliable to be used by local authorities for groundwater exploitation and management in the area.
1 Introduction
The spatial prediction of groundwater potential using the standard method is important for groundwater resources management (CitationRahmati et al., 2016; CitationMogaji and Omobude, 2017). Groundwater being a hidden subsurface treasures resource not easily seen with the naked eyes is very difficult to quantify potentially. Subsequently, planners and hydrological engineers have resolved to engage the efficacy of the predictive standard methods in groundwater potentiality mapping. Indeed, this has contributed immensely to managing groundwater resource sustainably (CitationPourghasemi and Beheshtirad, 2015). This precious natural resource often served as a driven resource in all works of life such as industrial and agricultural purposes (CitationPradhan, 2009; CitationAyazi et al., 2010; CitationManap et al., 2013; CitationNeshat et al., 2014; CitationNampak et al., 2014). Consequently, the increasing demand for such natural resource in all climatic regions in the world by the way of rapid population growth, urbanization, drought among others, cannot be over emphasized (CitationMagesh et al., 2012; CitationTodd and Mays, 2005; CitationOikonomidis et al., 2015). Therefore, the optimal maximization of this vital natural resources i.e. potentiality evaluation requires efficient management (CitationOikonomidis et al., 2015).
Recently, the usage of the multi-criteria predictive standard methods has been reportedly a good alternative in environmental decision making venture (CitationAkinlalu et al., 2017; CitationOni et al., 2017; CitationMogaji and Lim, 2017). Thus some renowned GIS – based spatial integration models such as weights-of-evidence, probabilistic frequency ratio, Shannon’s entropy, logistic regression, artificial neural network, analytical hierarchy process and evidential belief function have been fully engaged in groundwater potential mapping (CitationAl-Abadi, 2015a, CitationCorsini et al., 2009; CitationLee et al., 2012a, CitationCitation; Pourtaghi and Pourghasemi, 2014; CitationNaghibi et al., 2014; CitationDavoodi Moghaddam et al., 2013; CitationOh et al., 2011; CitationOzdemir, 2011a, Citation2011b; CitationCorsini et al., 2009; CitationLee et al., 2012b; CitationKaliraj et al., 2014; CitationMogaji, 2016; CitationNampak et al., 2014; CitationMogaji et al., 2015a). However, it is important to note that the commonest groundwater potential conditioning factors (GPCFs) often used in these priors studies include lineament density, lineament intersection density, drainage density, slope, lithology and rainfall, etc. However, the studies on the use of the geophysical and hydrogeological inclined GPCFs such as (aquifer resistivity, aquifer thickness) and (transmissivity and storativity), respectively in spatial predictive mapping of groundwater potentiality are few. According to CitationSener et al. (2005)Citationand Madan et al. (2010), these latter GPCFs have direct bearing and an in situ contact with the subsurface fluid flow mechanism. Moreover, among the often used multi-criteria index predictive model, few studies have applied the data-driven evidential belief functions methodology.
This current research introduce the EBF model in mapping the groundwater potentiality leads at a given study area in Perak province, Malaysia. The conceptual novel of this study deals with the construction of groundwater productivity potential index (GPPI) map via synthesizing the geoelectrical and hydrogeologic data sets driven factors including overburden resistivity (OVR), overburden thickness (OVT), aquifer resistivity (ACR), aquifer thickness (ACT), hydraulic conductivity (K), aquifer transmissivity (Tr) using the proposed model algorithms. Through utilizing this model in-built degree of uncertainty relationship functionality, estimate of the degree of uncertainty characteristics of the predicted potential zones which according to CitationFeizizadeh et al.(2014) can provide the possibilities of measuring the level of confidence in decision making was analyzed over the promising potential zones identified in the investigated area. Further, the efficiency of the model was evaluated using the result of the reacting operating characteristics (ROC) technique and the analyzed result of the Dar – Zarrouk Parameters (DZP) determined for the area underlain aquifer formation materials. The application of Dempster – Shafer data driven evidential belief function (DS – EBF) in groundwater potentiality mapping using the subsurface derived groundwater potential conditioning geoelectric and hydraulic parameters provides originality to this study.
2 The study area description
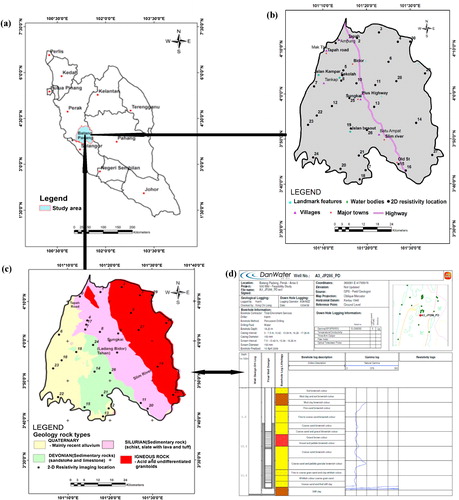
The study area is situated in the southern region of Perak and shares boundaries with Selangor in Peninsular Malaysia. The area is bounded by longitudes 101°0′E–101°40′E and latitudes 3°37′N–4°18′N (). The detail of the area geography, hydrology, hydrogeology and geology (c) have been discussed and documented in CitationMogaji et al. (2015a). Literatures have generally reported that the study area is characterized to be underlain with varying aquifer types such as confined aquifer and unconfined aquifer (CitationMogaji et al., 2015b). The delineation and mapping of these groundwater reservoir (aquifer) conditions as well their potential productivity requires standard methods to regionally manage them for optimal groundwater resource maximization.
Fig. 1 The study area description materials showing a: map of Peninsular Malaysia; b: site location map depicting the 2D Resistivity imaging location point; c: the area geologic rock types map and d: typical borehole litho – log of the area.
3 Materials and methodology
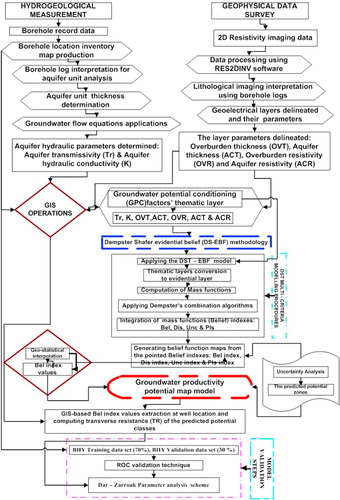
The used data in this study encompasses, the obtained borehole pumping test (BPT) measurements data (Hydrogeological measurement) and the field acquired geophysical data. , presents an overview of the applied DS – EBF methodology for the regional assessment of the groundwater productivity potential mapping in the study area. The approach were implemented at seven different phases: The hydrogeological measurement was staged at phase (1) where borehole pumping test (BPT) survey analysis for the purpose of groundwater wells location inventory mapping, the bore well yield record analysis, the bore litho – log interpretation (d) and the determination of K and Tr parameters for each occupied borehole well in the area. Phase (2) involved the regional field geophysical prospecting investigation where 2D resistivity imaging geophysical data acquisition, processing and interpretations were carried out and determination of Dar – Zarrouk Parameter (DZP) from the interpreted geoelectrical parameters (layer thickness (h) and layer resistivity (ρ)) at each occupied (b and ). The application of GIS tool constituted the Phase (3), at this phase, production of thematic maps of GPCFs parameters such OVT, OVR, ACT, ACR, Tr and K were processed and also the overlay and spatial analysis between the produced GPPI map and the determined transverse resistance (TR) values were evaluated. The DS – EBF methodology details constituted Phase (4) where the EBF model theory applicability in groundwater potentiality mapping was explored. The 5th phase deals with the production of groundwater productivity potential index map for the area. The quantification of degree of uncertainty over the predicted potential zones make up Phase (6). The validation of the model results for its efficiency analysis has the 7th Phase. The details of these aforementioned phases are highlighted below.
Fig. 2 The methodological flowchart adopted for the study.
3.1 The hydrogeology measurement phase
At this phase, the available BPT data record and borehole litho - log were analyzed. With the BPT survey, the inventory map of the well location was prepared for the regional analysis of the area hydrogeological condition. The adopted pumping test principle in the BPT technique involved the use of Cooper and Jacob’s straight-line methods for analyzing the pumping test results of the measured drawdown reading with respect to time in each drilled boreholes occupied as detailed in the study of CitationAnomohanran (2015). Each of the drawdown readings were analyzed at each tested wells after a specific time intervals of pumping. Employing, the linear regression technique, the variables of the drawdowns on an arithmetic axis versus time on a logarithmic axis were plotted to determine the aquifer hydraulic properties such as yield rate and Tr parameters. According to , the bore wells groundwater productivity values (i.e. yield rate) in the range of 0.39–43.73 m3/h were analyzed for data driven application of the DS – EBF modeling via randomly partitioning into 70% (19 groundwater wells) as training data set while the remaining 30% (9 groundwater wells) are for the model validation. Afterward, the available borehole litho – log (d) were interpreted to determine the aquifer unit thickness (h). With the application of the groundwater flow equation as used in CitationPradhan et al. (2013), the aquifer hydraulic parameter (K) was determined. The determined values for each of the Tr and K parameters at each located borehole were processed in GIS environment to produced their thematic maps.
Table 1 Borehole yield rating inventory records of the area.
3.2 Field geophysical prospecting investigation phase
The geophysical survey approach adopted at this phase was the 2-D resistivity imaging technique. For the 2-D survey, the established 30 survey location points that cut across the diverse geological settings in the area (b and c) were combed by deploying both Wenner–Schlumberger and Schlumberger arrays using the ABEM SAS 4000 measuring system. The details of the 2D resistivity imaging data acquisition, processing and interpretation at each occupied locations (b) are discussed in CitationMogaji et al. (2015b). The typical 2D resistivity imaging obtained from the interpreted data is shown in . Based on this interpretation, the following subsurface parameters including OVR, OVT, ACR, and ACT were determined at each 2-D resistivity imaging location: ( and ). The summary of the obtained subsurface parameters at each location is presented in . Afterward, the secondary order parameters often refers to as Dar – Zarrouk Parameters (DZP) i.e. transverse resistance (TR) via applying the renowned relevant equation (Equation1(1)
(1) ) according to CitationMaillet (1974) was determined using the interpreted geoelectrical parameters (ρ and h)
(1)
(1)
Fig. 3 Examples of the 2D resistivity imaging sections showing how geoelectrical parameters were delineated on the identified rock types in the area. Where a, b, c and d are the sections located on Alluvium, Devonian, Silurian and Igneous rock types, respectively.
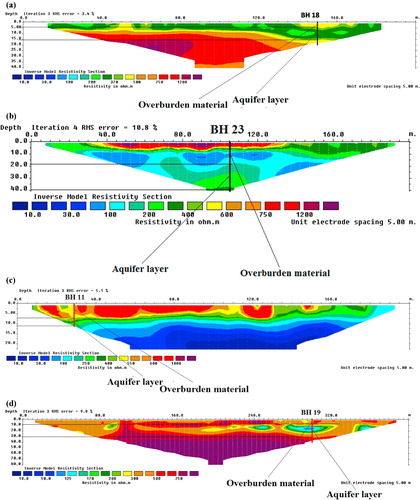
Table 2 The interpreted geoelectric and the computed Dar – Zarrouk Parameters (DZP) obtained from the 2-D resistivity sections.
3.3 Generating the thematic maps of the groundwater potential conditioning factors (GPCFs)
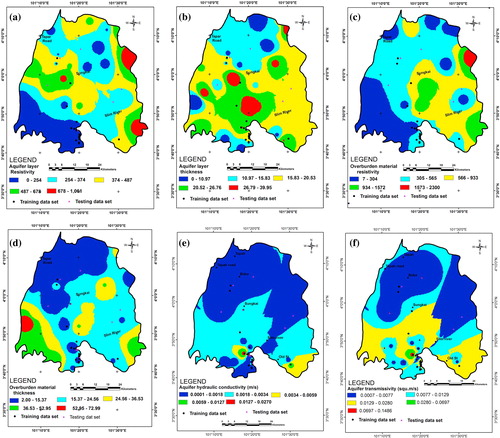
According to CitationMogaji and Omobude (2017), the factors that are believe to be influencing the occurrence and storage potential of groundwater are referred to as groundwater potential conditioning factors (GPCFs). Based on the discussion above, this study is considering the OVR, OVT, ACR, ACT, Tr, and K. The hydrological significances of these GPCFs have been reported in literatures. To mention few, CitationOyedele et al. (2011), reported that the resistivity parameter of the weathered formation (aquiferous unit) and the delineated overburden unit thickness have been successfully evaluated for groundwater potential rating in an area. The parameters K and Tr on the other hand, have been established as the major driver of groundwater discharge in an area for they largely determined the variability of groundwater potential from place to place (CitationOkogbue and Omonona, 2013; CitationIkechukwu, 2012; CitationTizro et al., 2010; CitationLee et al., 2012a). However, very few studies have considered the Tr and K factors in spatial modeling of groundwater potentiality and groundwater vulnerability assessment (CitationAdepelumi et al., 2006; CitationMogaji et al., 2011; CitationMogaji, 2017). With these aforementioned factors, the direct influence of subsurface stratigraphic layer, physical properties on the conduit movement of groundwater in the subsurface can be effectively evaluated. But then, in order to model multi-criterially these GPCFs in the mechanism of DS-EBF algorithm, their values at the geophysical and hydrogeological measurement points were spatially processed in GIS environment for producing their raster map shown in . The produced maps were further converted into evidential layers to serve as an input for the multi-criterially DS – EBF model.
Fig. 4 Groundwater conditioning parameters/factors for the EBF – DST and MCDA-AHP models: (a) Aquifer layer resistivity; (b) aquifer layer thickness; (c) overburden material resistivity; (d) overburden material thickness; (e) aquifer hydraulic conductivity and (f) aquifer transmissivity.
3.4 The EBF) Model
In reference to our published works CitationMogaji et al. (2015a, Citation2016), the theory of this model which has its origin from the Bayesian generalization was reviewed for this study. Its efficacy in several environmental studies including mineral potential mapping (CitationMoon, 1990; CitationCarranza and Hale, 2002; CitationCarranza et al., 2005), landslide susceptibility (CitationMohammady et al., 2012; CitationLee et al., 2012c; CitationPourghasemi et al., 2013), aquifer vulnerability mapping (CitationAl-Abadi, 2015b) has been documented. The DS-EBF model theory according to CitationLee et al. (2012c), support four series of mass functions including belief (Bel), disbelief (Dis), uncertainty (Unc) and Plausibility (Pls). The model inbuilt uncertainty functionality according to CitationPark (2010), put it at advantage over other spatial data integration models viz- a –viz its ability to mapping of target zones as well as predicting the degree of uncertainty of the same zones. Exploring this singular attribute of the DS – EBF model in the field of groundwater hydrology, a more precision and biasless groundwater potentiality prediction model map can be produced (CitationAlthuwaynee et al., 2012; CitationLee et al., 2012c).
According to the DS – EBF model basic theory reviewed (CitationAl-Abadi, 2015b; CitationMogaji et al., 2016), the relationships mapping applications in groundwater vulnerability and groundwater recharge potential mapping have been defined easily using the renowned Eqs. (Equation(2)(2)
(2) Equation(7)
(7)
(7) ). Thus, they were applied to the prepared GPCFs () and the groundwater well yield inventory locations to model the GPPI map of the area following procedural approach in CitationNeshat and Pradhan (2015)Citationand Pourghasemi and Beheshtirad (2015) where the weight values for each GPCFs obtainable from the Belief values were calculated and synthesized for the GPPI map construction.
(2)
(2) where
: number of groundwater wells that occurred in
;
: total number of existed wells with productive yield in the study area;
: number of pixels in the study area.
The Bel function can be calculated as(3)
(3)
The likelihood ratio for supporting the opposite target proposition is calculated as(4)
(4)
The Dis function is calculated as(5)
(5)
The uncertainty (Unc) and the plausibility (Pls) values area were obtained using Eqs. (Equation(6)(6)
(6) Equation(7)
(7)
(7) )
(6)
(6)
(7)
(7)
By exploring these EBF model’s algorithm, the weighted values for the considered GPCFs were determined ().
Table 3 Spatial relationship between the groundwater potential conditioning parameters (GPCFs) productive groundwater well using DS – EBF model.
4 Results and discussion
4.1 The DS – EBF algorithm applicability result in groundwater mapping
The results of the applied DS – EBF algorithms given in Eqs. (Equation(3)(3)
(3) Equation(7)
(7)
(7) ) to the spatially modeled groundwater potential conditioning factors () established the estimate of the following DS – EBF mass series function namely: belief, disbelief, uncertainty, and plausibility as presented in . According to column 2 and 6 of , the correlation between groundwater occurrence and aquifer formation (ACR) reflects that resistivity values in the range of 80–254 Ω m and 254–374 Ω m class boundaries have the highest Bel values of 0.83 and 0.1, respectively. Such resistivity class boundaries formation according to CitationOlorunfemi and Fasuyi (1993) typified a saturated formation. This is unlike the class boundaries formation of 678–1061 Ω m that indicate very low saturated unit and characterized with the lowest belief value. This thus revealed that this area high degree of potential storage prospect is relatively in agreement with the DS – EBF modeling output. Further, the ACT estimates in column 2, the class boundaries of 20.53–26.76 m and 26.76–39.95 have highest Bel values of 0.41 and 0.27, respectively (Column 6). Similarly, the class boundary with low ACT value of 8–10.97 m has the lowest Bel value (Column 6). According to CitationOladapo et al. (2009)Citationand Mogaji (2016), an area underlain with thicker aquifer unit often characterized with high groundwater yield. Thus, the area groundwater potentiality occurrences quite correlated with DS –EBF modeling output of the ACT factor determined. Precisely, the groundwater storage prospect assessment correlation across the other GPCFs such as OVT, OVR, K and Tr show similar trend revelation of the likes of both ACR and ACT results discussed. In addition, the quantitative comparison analysis among the columns 3, 7, 8 and 9 of has also indicated groundwater potentiality mapping efficacy of the DS-EBF model. This clue is as numerically interpreted in Column 3 where the area groundwater storage prospect potentiality agreed with the Dis, Unc and Pls results in columns 7, 8 and 9, respectively. The comparison results has quantitatively established that the class boundaries with high Bel values across the modeled geoelectrical-based GPCFs are found to be associated with the low degree values of Dis, Unc and high degree values of Pls. The Dis and Unc component of the DS functional series in accordance with CitationMogaji (2017) has further confirmed the integrity of Bel index estimate whose both low and higher values are observed correlated with the low and high groundwater potentiality storage prospect interpretations of Column 3 in the area. This result is in agreement with the findings of CitationLee et al. (2012c)Citationand Althuwaynee et al. (2012).
However, in order to synthesize the hydrogeological significance of these geoelectrical parameters induced GPCFs in , the multi – criterially functionality of this renowned Dempster’s rule of combination algorithms as used in the studies of CitationCarranza and Hale (2002)Citation, Mogaji et al. (2015a)Citation, Mogaji et al. (2016)Citationand Al-Abadi (2015b) were explored. The results of the calculated combined degrees of mass functions/beliefs at each observation location points as depicted in are presented in . Moreover, through the efficacy of the geospatial technique GIS software, the results in were spatially modeled to produce the integrated maps of DS - EBF model shown in . The spatial correlation analysis of maps result revealed that zones of high Bel values (a) are characterized with zones with low Dis (b), low Unc (c) and high Pls (c) values spatially modeled for the area. Thus, having explored the data driven evidential belief function algorithms (Eqs. (Equation(3)(3)
(3) Equation(7)
(7)
(7) )), the above analyzed four mass function series (Belief, Disbelief, Uncertainty and Plausibility) supported by the DS – EBF model has presented the quantitative relationships between the groundwater potentiality occurrences and the conditioning factors (CitationLee et al., 2012c; CitationAlthuwaynee et al., 2012; CitationNampak et al., 2014).
Fig. 5 The evidential and spatial attributes scoring template model used in the study.
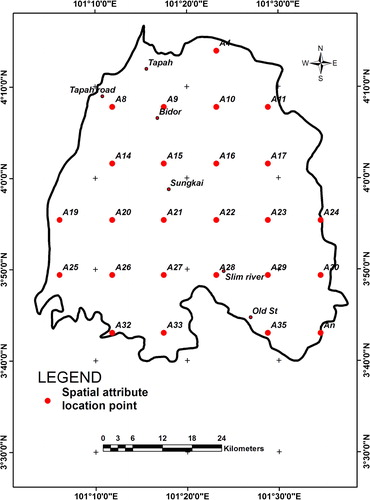
Fig. 6 Integrated results of DS - EBF model; (a) belief, (b) disbelief, (c) uncertainty, (d) plausibility.

Table 4 Belief functions component indexes computed results for the synthesized GCPs hydrogeologic. evidential themes.
4.2 The construction of groundwater productivity potentiality map
This study employed the conceptual approach reported in the studies of CitationMoon (1990)Citationand Tangestani and Moore (2002 in constructing the area groundwater potentiality map. This entail the modeling of DS – EBF model-based Bel index values in column 4 of computed using Eq. (Equation8(8)
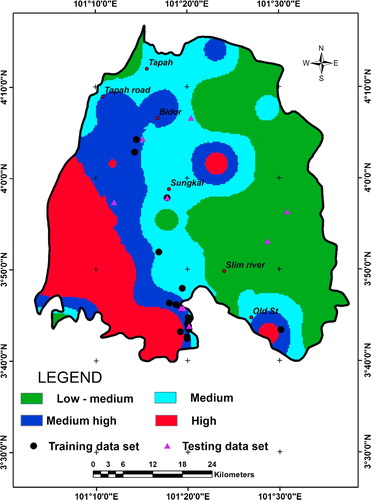
(8) ). The clue is such that the Bel index among the supported four mass function series of the model, gives a more exact evidence indicating the existence of groundwater reservoir formation occurrence in the area compared to the other mass function series indexes. Thus, through exploiting the spatial analyst module in GIS environment as used in the studies of CitationAkinlalu et al. (2017)Citation, Mogaji (2017)Citationand Mogaji (2016), the computed Bel index values in column 4 of were spatially modeled for constructing the groundwater productivity potentiality index map for the area ().
(8)
(8) where,
: lower degree of belief for each layers of parameters type or range;
: degree of uncertainty for each layers of parameters type or range; x; the A, B, …, G denoting each parameters types and
.
Fig. 7 Groundwater productivity potential index (GPPI) map of the area.
4.3 The uncertainty modeling assessment of the area potentiality prediction results
In a means to reduce the level of biasness in the use of the predictive modeling result for the purpose of environmental decision making, the quantification of the degree of the model uncertainty is essential (CitationFeizizadeh et al., 2014). This study explored the capability of the DS – EBF model to model the level of uncertainty degree associated with the predicted potential zones in the investigated area (). Through, the use of the given DS algorithm in Eq. (Equation9(9)
(9) ), the Unc index values (Column 6 of ) characterizing the area were determined. Applying the Spatial analyst command algorithm in the GIS environment, the degree of uncertainty values associated with the demarcated potential mapping zones in were quantitatively evaluated (). Revealing from , the percentage level of uncertainty characterizing the predicted potential zones in the area is in the range of 2–17% with Unc < 10% associated with the mediums and highs potential zones whereas the Unc > 10% is related with the low potential zones. Generally, all the predicted potential classes revealed by GPPI map () can be explore for groundwater exploration for the reason of low degree/percentage of uncertainty characterizing them. However, those mapped mediums and highs potential zones with lowest uncertainty degree are more promising for higher groundwater productivity potentiality that will reliably serve as a new leads site for future borehole development in the area. It can thus be implies that based on the area extent coverage estimated for the predicted potential classes (see column 4 of ), about 63% of the area can be explored for groundwater resource development
(9)
(9) where
degree of uncertainty for each layers of parameters type or range
Table 5 The potential zones uncertainty degree quantified analysis and the area coverage extent.
4.4 The DS – EBF modeling output validation assessment
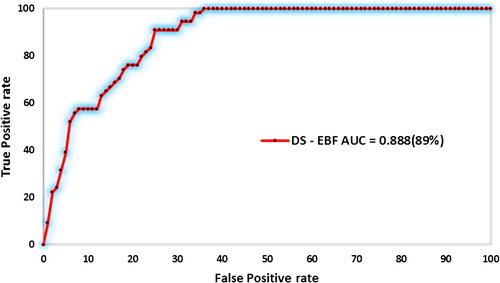
Assessing the performance efficiency of the multi-criteriality potential of the DS – EBF model involving the geoelectrically and hydrogeologically derived based GPCFs in groundwater potential mapping is considered a clue for establishing the DS – EBF model as a good alternative MCDA model technique in the field of groundwater hydrology. This study employed two approaches in achieving this objective. Firstly, the reacting operating characteristics (ROC) validation technique was explored. With this technique, ROC curve plots was produced using both AcrGIS 10.2 and IDRISI software where the, randomly partitioned bore well location inventories of ratio 70:30 were spatially analyzed with the DS-EBF-based GPPI map () for both model training and model testing, respectively. The ROC curve plot has the false positive rate on the X-axis and the true positive rate on the Y-axis as shown in . According to , the area under the curve (AUC) value of 0.888 which implies the 88.8% prediction accuracy rate of the adopted DS – EBF model approach. Secondly, the Dar –Zarrouk Parameter analysis of the delineated aquifer materials properties obtained from the processed and interpreted geophysical 2D resistivity measurement location over the predicted potential zones of the DS-EBF-based GPPI map was determined. This was burned out of the view that the productivity of the predicted potential classes are functions of the hydraulic properties of the underlain aquifers (CitationSoupious et al., 2007; CitationShahid et al., 2014). The similar approach of CitationTizro et al. (2010)Citation, Oborie and Udom (2014)Citationand Maillet (1974) employed for determining the transverse resistance (TR); longitudinal conductance (S)), properties of the aquifer units material was explored in this study. Thus, through applying the given Eq. (Equation1(1)
(1) ), the result of the computed TR for the aquifer unit is as presented in . According to , the determined TR values for the aquifer unit were in the range of 996–30,000 Ω m2 (Column (8) of ). With the application GIS – based spatial analyst tool, the associated TR parameter values characterizing the predicted potential classes () were spatial analyzed. The analyzed results established that the low potential zones have TR values vary from 996 to 13,566 Ω m2 whereas the mediums/high potential classes are characterized with TR values in the range of 1280–30,000 Ω m2. According to CitationTizro et al. (2010), the aquifer transmissivity (Tr) is directly related to TR which implies that at higher TR, the Tr will also be higher and thus the groundwater potential will be good. Thus, the mapped medium and high potential classed revealed by GPPI map () are quantitatively characterized with higher groundwater potentiality compared with the low predicted zones. It can be deduced from the two validation approach discussed, that the DZP analyzed results quite agreed with the mapped mediums/high potential classes with the lowest Unc degree quantified. Hence, it is concluded that the map produced by the DS - EBF model exhibited satisfactory result in the investigated area. Therefore, the predicted mediums/high potential areas are reliable to be explore for groundwater resources development in the study area.
Fig. 8 The ROC technique validation result.
5 Conclusions
In groundwater potential mapping, the used of multi- criterially spatial integration models are promising due to their capability of producing logical accuracy spatial prediction models. But then, the aspect of modeling degree of uncertainty in predictive mapping of promising zones that often reduces predictive model precision and reliability in the field of groundwater hydrology are often trivialized. Thus, this current research is focused on proving the effectiveness of GIS - based Dempster Shafer data driven evidential belief function model (DS - EBF) to addressing this multi-criterially spatially predictive models shortcoming in a given groundwater resource development project. This model was explored using a case study at the Perak province, Malaysia for the purpose of producing reliable environmental decision making tool that can be used for maximizing the optimal exploration of groundwater resources in the area. In order to achieve this research aim, a database consisting of groundwater record data (well locations; yield; transmissivity) and geophysical measurement record data was constructed. Afterward, the proposed model was used to quantitatively establish spatial relationship between the known productive bore well locations and the derived geoelectrically and hydrogeologically induced groundwater potential conditioning factors consisting of aquifer layer thickness, aquifer layer resistivity, overburden material resistivity, overburden material thickness, aquifer hydraulic conductivity and aquifer transmissivity obtained. Based on the likelihood and probabilistic applications of this model’s algorithms, four mass function series indexes including the Belief (Bel), Disbelief (Dis), Uncertainty (Unc) and Plausibility (Pls) were determined. The afterward comparative analysis of the integrated degrees of these mass function indexes enabled production of the area groundwater productivity potentiality index (GPPI) map. The analyzed degree of uncertainty over the predicted potential classes revealed by the produced DS-EBF-based GPPI map quantitatively established >10% percentage degree of uncertainty for the predicted low potential zones whereas it is <10% for the predicted mediums/highs potential classes in the area Furthermore, the efficiency performance evaluation of the DS – EBF model through applications of ROC curve technique provided the model prediction rate of 88.8%. The result of the Dar - Zarrouk Parameter analysis on the delineated aquifer units using the transverse resistance values determined in the range of 1280–30,000 Ω m2 revealed the quantitatively the prolificness of the delineated aquifer unit’s material within the DS-EBF-based predicted potential zones. With these results of DZP-based transverse resistance and the DS-EBF-based percentage degree of uncertainty for the mediums/highs potential classes of the produced GPPI model map, about 63% of the investigated areas can be reliably explore for groundwater resource development.
In summary, this study results have proven the efficiency of DS – EBF model in the field of groundwater hydrology via producing reliable groundwater potential decision making tool using groundwater potential conditioning factors based on the subsurface data sets induced geoelectric and hydraulic parameters. Thus, this study has wider established the applicability of Dempster – Shafer data driven evidential belief function (DS- EBF) model as a cost-effective approach for improving groundwater resources prospectivity mapping in the field of groundwater hydrology/hydrogeological study. The map obtained by this method can be used by local authorities and water policy makers as a preliminary reference in selecting suitable sites for drilling new boreholes. Thus, considerable contributions to the groundwater literatures can be derived from this research findings.
Acknowledgments
This project was carried out using the financial support from RUI, Investigation of the impacts of summertime monsoon circulation to the aerosols aransportation and distribution in Southeast Asia which can lead to global climate change, 1001/PFIZIK/811228. The authors are equally grateful to Universiti Sains Malaysia (USM) for providng one year Post – Doctoral fellowship Dr. Kehinde Anthony Mogaji (BW001607). Also special appreciation goes to my University back in Nigeria (Federal University of Technology Akure (FUTA) for granting me study leave to utilize the fellowship for research study
Notes
Peer review under responsibility of National Research Institute of Astronomy and Geophysics.
References
- A.AdepelumiM.J.Yi-jJ.H.KimB.D.AkoJ.S.SonIntegration of surface geophysical methods for fracture detection in crystalline bedrocks of southwestern NigeriaHydrogeol. J.14200612841306
- A.A.AkinlaluA.AdegbuyiroK.A.N.AdiatB.E.AkeredoluW.Y.LateefApplication of multi-criteria decision analysis in prediction of groundwater resources potential: a case of Oke-Ana, Ilesa Area Southwestern NigeriaNRIAG J. Astron. Geophys.2017
- A.M.Al-AbadiGroundwater potential mapping at northeastern Wasit and Missan governorates, Iraq using a data-driven weights of evidence technique in framework of GISEnviron. Earth Sci.201510.1007/s12665-015-4097-0
- A.M.Al-AbadiThe application of Dempster-Shafer theory of evidence for assessing groundwater vulnerability at Galal Badra basin, Wasit governorate, east of IraqAppl. Water Sci.201510.1007/s13201-015-0342-7
- O.F.AlthuwayneeB.PradhanS.LeeApplication of an evidential belief function model in landslide susceptibility mappingComput. Geosci.4420122012120135
- O.AnomohanranScienceDirectHydrogeophysical and hydrogeological investigations ofgroundwater resources in Delta Central, NigeriaJ. Taibah Univ. Sci.920152015576810.1016/j.jtusci.2014.06.003
- Ayazi, M.H., Pirasteh, S., Arvin, A.K.P., Pradhan, B., Nikouravan, B., Mansor, S., 2010. Disasters and risk reduction in groundwater: Zagros Mountain Southwest Iran using geoinformatics techniques. Disaster Adv. 3, 51–57.
- Carranza, E.J.M., Hale, M., 2002. Evidential belief function for dat-driven geologically constrained mapping of gold potential, Baguio distric, Philippines. Ore Geol. Rev. 117–132.
- E.J.M.CarranzaT.WoldaiE.M.ChikambweApplication of data-driven evidential belief functions to prospectivity mapping for aquamarine-bearing pegmatites, Lundazi District, ZambiaNat. Resour. Res.141200510.1007/s11053-005-4678-9
- A.CorsiniF.CerviF.RonchettiWeight of evidence and artificial neural networks for potential groundwater mapping: an application to the Mt. Modino area (Northern Apennines, Italy)Geomorphology1112009798710.1016/j.geomorph.2008.03. 015
- D.Davoodi MoghaddamM.RezaeiH.R.PourghasemiZ.S.PourtaghiB.PradhanGroundwater spring potential mapping using bivariate statistical model and GIS in the Taleghan watershed IranArab. J. Geosci.201310.1007/s12517-013-1161-5
- B.FeizizadehP.JankowskiT.BlaschkeA GISbased spatially-explicit sensitivity and uncertainty analysis approach for multi-criteria decision analysisComput. Geosci.6420148195
- Ikechukwu, B.I., 2012. Evaluation of the aquifer hydraulic characteristics from electrical sounding data in Imo River Basin, South Eastern Nigeria: the case of Ogwashi-Asaba Formation. Int. J. Modern Eng. Res. (IJMER) 2(5), 3237–3244 (http://www.ijmer.com, ISSN: 2249-6645).
- S.KalirajN.ChandrasekarN.S.MageshIdnetification of potential groundwater recharge zones in Vaigai upper basin, Tamil Nadu, using GIS-based analytical hierarchical process (AHP) techniqueArab. J. Geosci.720141385140110.1007/ s12517-013-0849-x
- S.LeeJ.HwangI.ParkApplication of data-driven evidential belief functions to landslide susceptibility mapping in Jinbu, KoreaCATENA10020121530
- S.S.LeeK.Kyo-YoungP.I.YongsungRegional groundwater productivity potential mapping using a geographic information system (GIS) based artificial neural network modelHydrogeol. J.201211710.1007/s10040-012-0894-7
- S.LeeK.Yong-SungO.Hyun-JooApplication of a weights-of-evidence method and GIS to regional groundwater productivity potential mappingJ. Environ. Manage.961201291105
- K.J.MadanV.M.ChowdaryA.ChowdhuryGroundwater assessment in Salboni Block, West Bengal (India) using remote sensing, geographical information system and multi-criteria decision analysis techniquesHydrogeol. J.187201017131728 November 2010
- N.S.MageshN.ChandrasekarJ.P.SoundranayagamDelineation of groundwater potential zones in Theni district, Tamil Nadu, using remote sensing, GIS and MIF techniquesGeosci. Front.322012189219
- R.MailletThe fundamental equations of electrical prospectingGeophysics1241974529556
- M.A.ManapW.N.A.SulaimanM.F.RamliB.PradhanN.SuripA knowledge driven GIS modeling technique for groundwater potential mapping at the Upper Langat Basin, MalaysiaArab. J. Geosci.6201316211637
- K.A.MogajiG.M.OlayanjuM.I.OladapoGeophysical evaluation of rock types impact on aquifer characterisation in the basement complex areas of Ondo state, Southwestern, Nigeria: Geo-electric assessment and geographic information approachInt. J. Water Resour. Environ. Eng.3420117786
- K.A.MogajiH.S.LimK.AbdullahRegional prediction of groundwater potential mapping in a multifaceted geology terrain using GIS-based Demspter-Shafer modelArab. J. Geosci.201510.1007/s12517-014-1391-1
- K.A.MogajiH.S.LimK.AbdullahModeling of groundwater recharge using a multiple linear regression (MLR) recharge model developed from geophysical parameters: a case of groundwater resources managementEnviron. Earth Sci.20157320151217123010.1007/s12665-014-3476-2
- K.A.MogajiG.O.OmosuyiA.O.AdelusiH.S.LimApplication of GIS-based evidential belief function model to regional groundwater recharge potential zones mapping in hardrock geologic terrainEnviron. Process.3120162016
- K.A.MogajiCombining geophysical techniques and multi-criteria GIS-based application modeling approach for groundwater potential assessment in southwestern NigeriaEnviron. Earth Sci.752016118110.1007/s12665-016-5897-6
- K.A.MogajiDevelopment of AHPDST vulnerability indexing model for groundwater vulnerability assessment using hydrogeophysical derived parameters and GIS applicationPure Appl. Geophys.201710.1007/s00024- 017-1499-9
- K.A.MogajiH.S.LimGroundwater potentiality mapping using geoelectrical-based aquifer hydraulic parameters: a GIS-based multi-criteria decision analysis modeling approach TerrAtmos. Ocean. Sci.283201747950010.3319/TAO.2016.11.01.02
- Mogaji, K.A., Omobude, O.B., 2017. Modeling of geoelectric parameters for assessing groundwater potentiality in a multifaceted geologic terrain, Ipinsa Southwest, Nigeria – A GIS-based GODT approach. NRIAG J. Astron. Geophys.
- M.MohammadyH.R.PourghasemiB.PradhanLandslide susceptibility mapping at golestan province, Iran: a comparison between frequency ratio, Dempster-Shafer, and weights-of-evidencemodelsJ. Asian Earth Sci.612012221236
- W.M.MoonIntegration of geophysical and geological data using evidential belief functionIEEE Trans. Geosci. Remote Sens.2841990711720
- S.A.NaghibiH.R.PourghasemiZ.S.PourtaghiA.RezaeiGroundwater qanat potential mapping using frequency ratio and Shannon’s entropy models in the Moghan watershed, IraqEarth Sci. Inform.201410.1007/s12145-014-0145-7
- H.NampakB.PradhanM.A.ManapApplication of GIS based data driven evidential belief function model to predict groundwater potential zonationJ. Hydrol.5132014283300
- A.NeshatB.PradhanS.PirastehH.Z.M.ShafriEstimating groundwater vulnerability to pollution using a modified DRASTIC model in the Kerman agricultural area, IranEnviron. Earth Sci.71201431193131
- Neshat, A., Pradhan, B., 2015. Risk assessment of groundwater pollution with a new methodological framework: application of Dempster–Shafer theory and GIS. Nat. Hazards 10.1007/s11069-015-1788-5.
- E.OborieG.J.UdomDetermination of aquifer transmissivity using geoelectrical sounding and pumping test in pats of Bayelsa State, NigeriaJ. Phys. Environ. Sci. Res.2220143240
- H.J.OhY.S.KimJ.K.ChoiE.ParkS.LeeGIS mapping of regional probabilistic groundwater potential in the area of Pohang City, KoreaJ. Hydrol.3992011158172
- D.OikonomidisS.DimogianniN.KazakisK.VoudourisA GIS/Remote Sensing-based methodology for groundwater potentiality assessment in Tirnavos areaGreece J. Hydrol.5252015197208
- C.O.OkogbueO.V.OmononaGroundwater potential of the Egbe-Mopa basement area, central NigeriaHydrol. Sci. J.5842013826840
- Oladapo, M.I., Adeoye, O.O., Mogaji, K.A., 2009. Hydrogeophysical study of the groundwater potential of Ilara-Mokin southwestern, Nigeria. Global J. Earth Sci. 15(2), 195–204.
- M.O.OlorunfemiS.A.FasuyiAquifer types and the geoelectric/hydrogeologic characteristics of part of central basement terrain of Nigeria (Niger State)J. Afr. Earth Sci.1631993309317
- T.E.OniG.O.OmosuyiA.A.AkinlaluGroundwater vulnerability assessment using hydrogeologic and geoelectric layer susceptibility indexing at Igbara Oke, Southwestern NigeriaNRIAG J. Astron. Geophys.62017452458
- K.F.OyedeleO.T.FatunaO.J.CokerGeophysical assessment of subsurface coastal sediments and their engineering implicationsArab. J. Geosci.42011543550
- A.OzdemirGIS-based groundwater spring potential mapping in the Sultan Mountains (Konya, Turkey) using frequency ratio, weights of evidence and logistic regression methods and their comparisonJ. Hydrol.4112011290308
- A.OzdemirUsing a binary logistic regression method and GIS for evaluating and mappingthe groundwater spring potential in the Sultan Mountains (Aksehir, Turkey)J. Hydrol.4052011123136
- N.W.ParkApplication of Dempster-Shafer theory of evidence to GIS-based landslide susceptibility analysisEnviron. Earth Sci.6222010367376
- H.R.PourghasemiR.MoradiS.M.Fatemi-AghdaC.GokceogluB.PradhanGIS-based landslide susceptibility mapping with probabilistic likelihood ratio and spatial multicriteria evaluation models (North of Tehran, Iran)Arabian Journal of Geosciences201310.1007/s12517-012-0825-x
- H.R.PourghasemiM.BeheshtiradAssessment of a data-driven evidential belief function model and GIS for groundwater potential mapping in the Koohrang Watershed, IranGeocarto Int.306201566268510.1080/10106049.2014.966161
- B.PradhanA.NeshatS.PirastehH.Z.M.ShafriEstimating groundwater vulnerability to pollution using a modified DRASTIC model in the Kerman agricultural area, IranEnviron. Earth Sci.201310.1007/s12665-013-2690-7
- B.PradhanGroundwater potential zonation for basaltic watersheds using satellite remote sensing data and GIS techniquesCent. Eur. J. Geosci.12009120129
- O.RahmatiT.NaserN.FarhadL.SaroSpatial analysis of groundwater potential using weights-of-evidence and evidential belief function models and remote sensingArab. J. Geosci.920157910.1007/s12517-015-2166-z
- E.SenerA.DavraM.OzcelikAn integration of GIS and remote sensing in groundwater investigation: a case study in Bunduc TurkeyHydrogeology1352005826839
- S.ShahidS.K.NathA.S.KamalGIS integration of remote sensing and topographic data using fuzzy logic for ground water assessment in Midnapur District, IndiaGeocarto Int.172014697410.1080/10106040208
- P.M.SoupiousM.KouliF.VallianatosA.VafidisG.StavrouslakidsEstimation of aquifer hydraulic parameters from surface geophysical methods: a case study of Keitis Basin in Chania (Crete - Greece)J. Hydrol.338200712213110.1016/j.jhydrol.2007.02.028
- M.H.TangestaniF.MooreThe use of Dempster-Shafer model and GIS in integration of geoscientific data for porphyry copper potential mapping, north of Shahr-e-Babak, IranInt. J. Appl. Earth Observ. Geoinform.4120026574
- T.A.TizroK.S.VoudourisM.S.MashayekhiHydrogeological framework and estimation of aquifer hydraulic parameters using geoelectrical data: a case study from West IranHydrogeol. J.201018201091792910.1007/ s10040-010-0580-6
- D.K.ToddL.W.MaysGroundwater Hydrology2005WileyNewYork