
 ?Mathematical formulae have been encoded as MathML and are displayed in this HTML version using MathJax in order to improve their display. Uncheck the box to turn MathJax off. This feature requires Javascript. Click on a formula to zoom.
1 Introduction
For several decades, geophysical prospecting method coupled with geotechnical analysis has become increasingly useful in evaluating the subsurface for both pre and post engineering investigations. Shallow geophysical tool is often used alongside geotechnical method to evaluate subsurface soil for engineering study to obtain information which may include the subsurface lithology and their thicknesses, competence of the bedrock and depths to its upper interface, and competence of the material that make up the overburden, especially the shallow section which serves as host for foundations of engineering structures (CitationAina et al., 1996; CitationAdewumi and Olorunfemi, 2005; and CitationIdornigie et al., 2006). This information helps the engineers to correctly locate and design the foundation of engineering structures. The information also serves as guide to the choice of design and suitable materials needed for road construction (CitationAkinlabi and Adeyemi, 2014). Lack of knowledge of the properties of subsurface may leads to the failure of most engineering structures. Therefore, it is of great importance to carry out a pre-construction investigation of a proposed site in order to ascertain the fitness of the host earth material.
Fig. 6 Percentage passing 0.075 mm sieve (PCS) versus apparent resistivity (ρa).
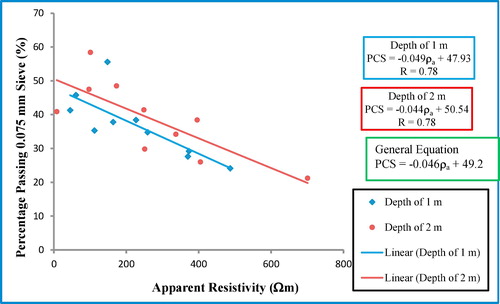
Fig. 7 Specific gravity (SG) versus apparent resistivity (ρa).
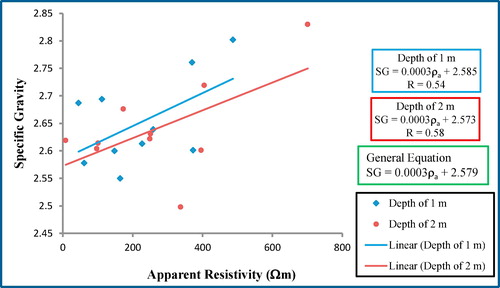
Fig. 8 Liquid limit (LL) versus apparent resistivity (ρa).
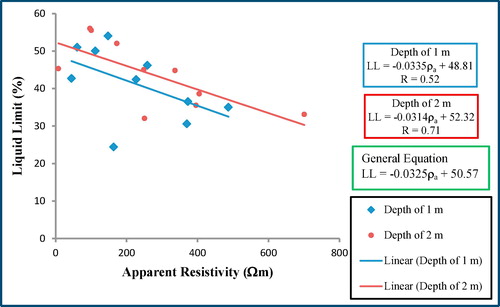
Fig. 9 Plastic limit (PL) versus apparent resistivity (ρa).
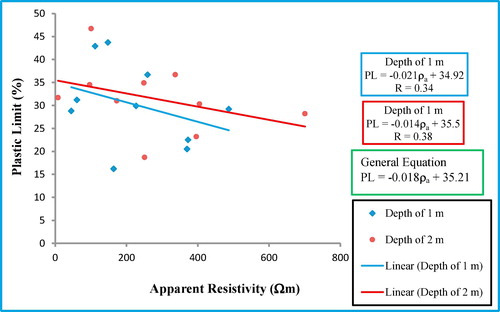
Fig. 10 Plasticity index (PI) versus apparent resistivity (ρa).
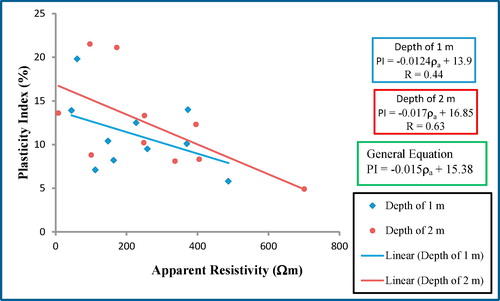
Fig. 11 Linear shrinkage (LS) versus apparent resistivity (ρa).
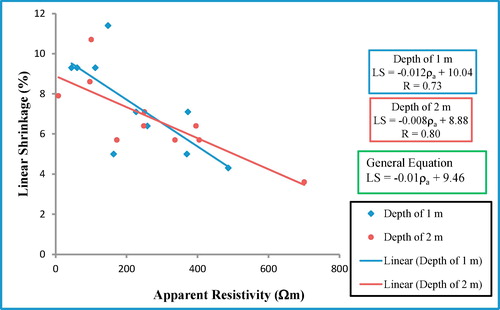
Fig. 12 Optimum moisture content (OMC) versus apparent resistivity (ρa).
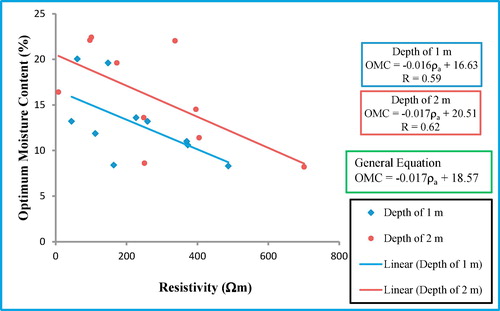
Fig. 13 Maximum dry density (MDD) versus apparent resistivity (ρa).
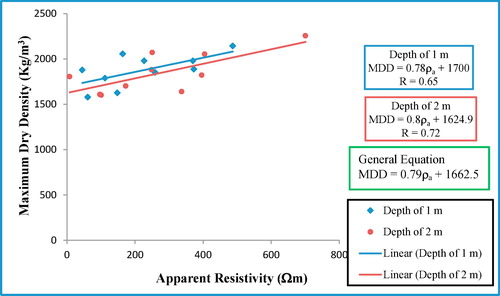
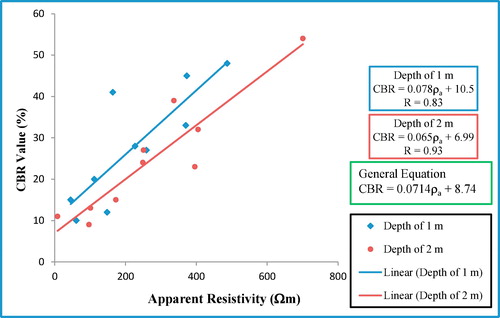
Fig. 14 California bearing ratio (CBR) versus apparent resistivity (ρa).
The pre-construction investigation may involve direct mechanical boring, pitting and trenching for subsoil sequence delineation, groundwater table mapping, soil sampling, and geotechnical laboratory analysis. It may also involve non-invasive geophysical investigation (CitationOlorunfemi et al., 2010). Where site investigation involves both geotechnical and geophysical investigations, it is often to reduce cost (by reducing the number of borings) and improve on the subsoil imaging through 1-D and 2-D geophysical data gathering and modeling (CitationOlorunfemi and Mesida, 1987; CitationBarker, 1997; and CitationOlorunfemi, 2008).
Geophysical investigations are mostly non-invasive whereas geotechnical investigations are mostly invasive. Compact subsoil is characterized by reduced porosity and moisture content with consequent increase in electrical resistivity. It is therefore possible to use electrical resistivity measurements as indices of subsoil competence and other engineering properties.
This research is aimed at establishing a relationship between electrical resistivity and several geotechnical parameters in form of an empirical equation. The need for these equations was brought out of the fact that geotechnical method is invasive, destructive, time consuming and non-cost effective, compared to electrical method. With the aid of the established equations, geotechnical parameters at a less cost can be estimate from electrical resistivity measurement.
1.1 Description of the case study area
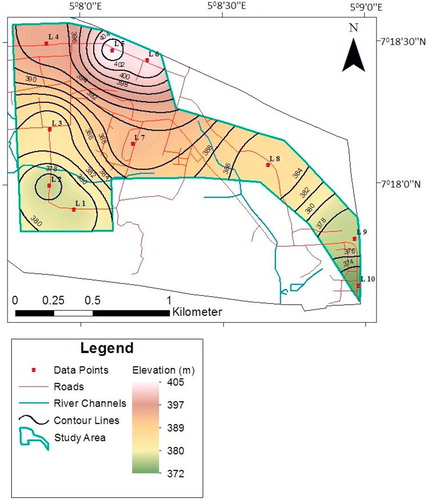
The case study area is a part of the Federal University of Technology, Akure campus. The University campus () is situated on the northwestern flank of Akure, and it occupies an area of about 5 km2 and lies between Latitudes 7°17′–7°19′N and Longitudes 5°7′–5°9′E. The topography of the area () indicates a general gentle slope with gradual increase in elevation from the east and south towards the north-western part and elevation ranging between 372 and 405 m above mean sea level. There are several stream channels trending approximately east-west and north-south direction. The area has mean annual rainfall ranging between 1000 and 1500 mm. The annual mean temperature ranges from 21.9 to 30.4 °C. Humidity is relatively high during the wet season and low during the dry season with values ranging annually from 39.1 to 98.2% (CitationAkinbode et al. (2008)). The vegetation is of tropical rain forest which is characterized by thick forest.
Fig. 1 Map of the Federal University of Technology, Akure (FUTA) showing the study area.
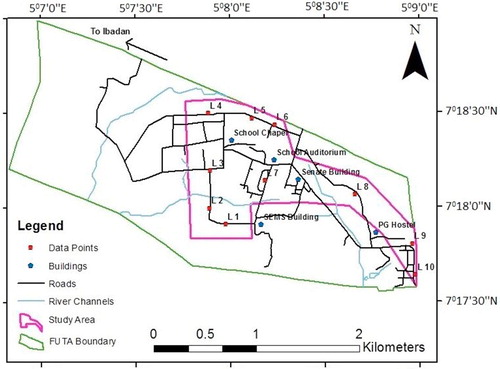
Fig. 2 Topographic map of the study area.
1.2 Geology of the case study area
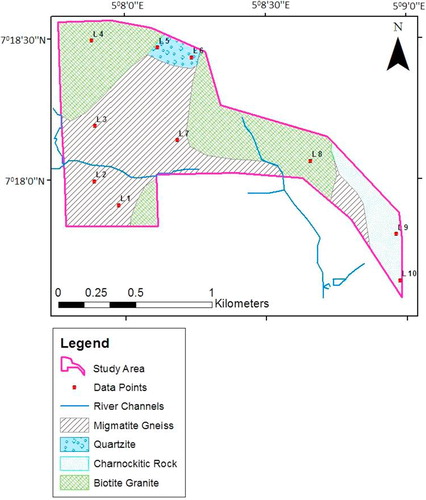
The case study area is underlain by rocks of the Precambrian Basement Complex of Southwestern Nigeria (CitationRahaman, 1989). The dominant rock types within the area are Granite, Charnockite, Quartzite, and Migmatite-gneiss (). A quartzite ridge that extends over 100 m is located towards the northern part of the area. However, Charnockites occur as discrete bodies mainly in the eastern part. Outcrops of migmatite-gneiss occur around the center and towards the southwestern part of the area. Granites occur as intrusive or low-lying outcrop within the migmatite-gneiss. Field observation however shows that the granite rocks constitute extensive outcrops in the northwestern and northeastern parts of the area. The geology and boundaries of lithological units were inferred in places where they are concealed by superficial residual soil (CitationKareem, 1997).
Fig. 3 Geological map of the study area showing the sample locations (modified after CitationKareem, 1997).
2 Methodology
Geological mapping of the study area was carried out and this was used to modify the existing geological map of case study area. The geology was considered in selecting ten (10) locations () where electrical resistivity measurements were carried out and soil samples were taken for the geotechnical analysis. The locations were selected in such a way that it spreads across the various geological distributions. This is to ensure that, the sample locations did not limit to a particular geological unit.
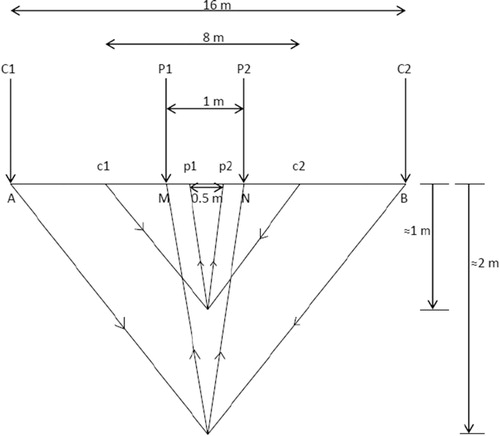
At each of the locations, two electrical resistivity measurements were obtained using Schlumberger configuration. The depth of investigation of electrical resistivity survey using Schlumberger configuration is about one-eighth of the current electrode separation (0.125AB) (CitationRoy and Apparao, 1971). Since the targeted depth of probes are 1 and 2 m, the first reading (depth of 1 m) was taken at current electrode separation (AB) of 8 m and potential electrode separation (MN) of 0.5 m (). The current electrode separation (AB) was increased to 16 m and the potential electrode separation (MN) were increased to 1 m for the second measurement (depth of 2 m). The apparent resistivity at each of the locations was computed by multiplying the obtained resistance (R) with the equivalent geometric factor (G). A Global Positioning System (GPS) was used to take the coordinates of the data locations.
Fig. 4 Schlumberger configuration flow pattern used for the electrical resistivity measurement.
The selected locations for the electrical resistivity measurements were pit and disturbed soil samples were taken at the depth of 1 and 2 m. A total of twenty (20) soil samples were collected for geotechnical analysis.
The Natural Moisture Content (NMC) determination of the subsoil samples collected was carried out in the laboratory within 24 h after collection. This was followed by Unconfined Compression Test (UCS) on a small portion of the soil samples. The remaining soil samples were air dried by spreading them out on trays in a fairly warm room for four days. Large soil particles (clods) in the samples were broken with a wooden mallet. Care was taken not to crush the individual particles. All the methods employed in carrying out the geotechnical test were carried out in accordance with the procedures specified by the British Standard Institution CitationBS 1377 (1975). The other geotechnical analysis carried out after the soil samples were air dried include Grain Size Analysis, Specific Gravity Test, Consistency (Atterberg) Limit Tests, Compaction Test, and California Bearing Ratio (CBR).
3 Results and discussion
3.1 Comparative analysis of the electrical resistivity and geotechnical results
The regression plots of the apparent resistivity (ρa) values against each of the determined geotechnical parameters show an empirical equation of the form;(1)
(1)
‘Gp’ represent the geotechnical parameter, ‘ρa’ represent the apparent resistivity, ‘M’ is the gradient of the trend line, and ‘C’ is the intercept on the geotechnical parameters (vertical) axis. From the plot, the relationship between the geotechnical parameters and the apparent resistivity is best described by a linear relationship where the geotechnical parameters (Gp) are taken as dependent variable and the apparent resistivities (ρa) are taken as independent variable, i.e. the determined geotechnical parameter of the subsoil varies with the electrical conductivity of the subsoil. The correlation also show that the relationship do not depend on the depth where the soil samples were taken but the composition of the subsoil.
3.2 Relationship between geotechnical parameters (Gp) and apparent resistivity (ρa)
shows the summary of the geotechnical results and the apparent resistivity values obtained at the depth of 1 and 2 m. – show the regression plots of the determined geotechnical parameters (Gp) against the apparent resistivities (ρa). The trend line and empirical equations show an inverse relationship between apparent resistivity (ρa) and Moisture Content (MC), clay and silt content, Liquid Limit (LL), Plastic Limit (PL), Plastic Index (PI), Linear Shrinkage (LS), Optimum Moisture Content (OMC) and Unconfined Compression Shear Strength (UCSS). The other geotechnical parameters such as Specific Gravity (SG), Maximum Dry Density (MDD) and California Bearing Ratio (CBR) exhibit a direct relationship with apparent resistivity (ρa).
Fig. 5 Natural moisture content (NMC) versus apparent resistivity (ρa).
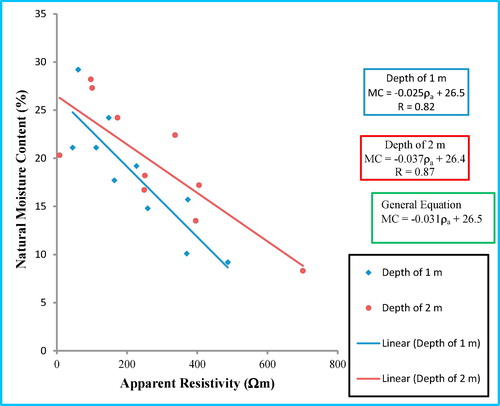
Fig. 15 Unconfined compression shear strength (UCSS) versus apparent resistivity.
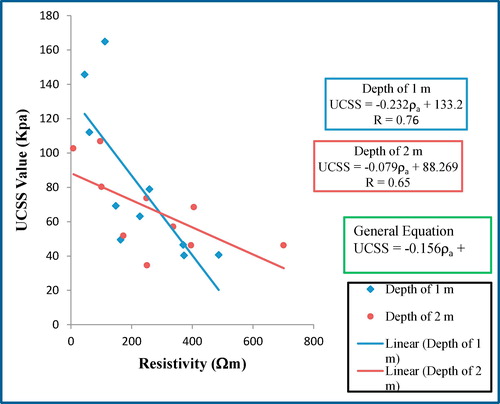
Table 1 Summary of the results of the apparent resistivity and geotechnical parameters at the depth of 1 and 2 m.
Generally the electrical resistivity of subsoil decreases with increasing moisture content (CitationFahad et al. (2012)). This was established with the correlation plots. It was also observed that the electrical resistivity of subsoil increases with increase in compaction and decrease in porosity. The trend line equations for the cross plots of the geotechnical parameters (GP) and apparent resistivity (ρa) at the depth of 1 and 2 m give a good coefficient of correlation which range from 0.52 to 0.93. Except that of plastic limit which has 0.34 and 0.38 at 1 and 2 m respectively, and plasticity index with 0.44 at 1 m depth. The derived empirical equations for all the geotechnical parameters and their corresponding coefficient of correlation are shown in .
Table 2 Empirical equations relating the geotechnical parameters and apparent resistivity.
Hence, the equations generally gave a good relationship between the two parameters (Geotechnical results and apparent resistivity values). The cross plot relationship between the two parameters at depths 1 and 2 m are of same trend and virtually same equations with close range of coefficient of correlation (R) (–). Hence, depth has no significant influence on the relationship. What influences the relationship is the composition of the weathering end product of geology of the area.
4 Conclusion
The research was carried out to establish an empirical relationship that relates the Apparent Resistivity (ρa) and the geotechnical parameters of subsoil, for the evaluation of the geotechnical parameters from known value of the apparent resistivity (ρa) of the subsoil. Geotechnical analyses were carried out on twenty (20) subsoil samples taken at the depth of 1 and 2 m. The subsoil sample locations were distributed across the geology of the case study area where apparent resistivity (ρa) values were determined. It was observed that, the results of the geotechnical analyses and the electrical resistivity correlates with the composition of the weathering end-product of rocks.
The cross correlation of the apparent resistivity (ρa) and the analyzed geotechnical parameters at the depth of 1 and 2 m show that Specific gravity, maximum dry density and California bearing ratio exhibit a direct relationship with apparent resistivity. These parameters increase with increase in the apparent resistivity values. Other analyzed parameters which include moisture content, clay and silt content, liquid limit, plastic limit, plasticity index, linear shrinkage, optimum moisture content, and unconfined compression shear strength exhibit inverse relationship. They decrease with increase in apparent resistivity values.
The cross plots of the geotechnical parameters with the apparent resistivity (ρa) at the depth of 1 and 2 m generally give a relatively good correlation with coefficient of correlation (R) ranging from 0.52 to 0.93, except for plastic limit that weakly correlates with apparent resistivity, whose coefficient of correlation is 0.34 and 0.38 at 1 and 2 m depth respectively, and plasticity index with coefficient of correlation of 0.44 at 1 m depth.
The fact that, almost all the geotechnical parameters gave a relatively strong coefficient of correlation with apparent resistivity implies that reliable engineering geotechnical parameters can be estimated from electrical resistivity measurements using the established empirical equations for each of the parameters. The relationship established between the two parameters (Geotechnical and Apparent Resistivity parameters) was not influenced by the depth at which the soil samples were taken since the empirical equations at both depths were similar.
Notes
Peer review under responsibility of National Research Institute of Astronomy and Geophysics.
References
- I.AdewumiM.O.OlorunfemiUsing geoinformation in construction managementJ. Appl. Sci.542005761767
- A.AinaM.O.OlorunfemiJ.S.OjoAn integration of aeromagnetic and electrical resistivity methods in dam site investigationGeophysics6121996349356
- O.M.AkinbodeA.O.EludoyinO.A.FashaeTemperature and relative humidity distributions in a medium-size administrative town in southwest NigeriaJ. Environ. Manage.871200895105
- I.A.AkinlabiG.O.AdeyemiDetermination of empirical relations between geolectrical data and geotechnical parameters in foundation studies for a proposed earth damPac. J. Sci. Technol.1522014278287
- Barker, R.D., 1997. Electrical imaging and its application in engineering investigation. In: McCann, D.M., Eddleston, M., Fenning, P.J., Reeves, G.M. (Eds.), Modern Geophysics in Engineering Geology. Geological Society Engineering Geology Special Publication, vol. 12, pp. 37–43.
- B.S. 1377, 1975. Methods of Tests for Soils for Civil Engineering Purpose, British Standard Institution HMSO London.
- I.S.FahadB.A.SyedB.S.OsmanIntegrating geo-electrical and geotechnical data for soil characterizationInt. J. Appl. Phys. Math.222012104106
- A.I.IdornigieM.O.OlorunfemiA.A.OmitogunIntegration of remotely sensed and geophysical data sets in engineering site characterization in a basement complex area of southwestern NigeriaJ. Appl. Sci. Res.292006541552
- Kareem, 1997. Geological Map of Federal University of Technology, Akure: Unpublished M. Tech Thesis, Dept. of Applied Geology, Federal University of Technology, Akure, 109p.
- Olorunfemi, M.O., 2008. Voyage on the Skin of the Earth: A Geophysical Experience. Inaugural Lecture 211, Obafemi Awolowo University, Ile – Ife, Nigeria, 75p.
- M.O.OlorunfemiE.A.MesidaEngineering geophysics and its application in engineering site investigations – (Case Study from Ile-Ife Area)Nigerian Eng.22219875766
- M.O.OlorunfemiO.J.AkintorinwaI.B.IginlaG.O.BayowaMicro-resistivity measurements, near-surface sequence delineation, and empirical relationships with engineering geotechnical parametersPac. J. Sci. Technol.1112010537544
- Rahaman, M.A., 1989. A review of the basement geology of Southwestern Nigeria. In: Kogbe, C.A. (Ed.), Geology of Nigeria, second revised ed. Rock View (Nig.) Ltd., Jos, Nigeria, pp. 39–56.
- A.RoyA.ApparaoDepth of investigation in direct current methodsGeophysics3651971943959