
Abstract
The Temsah field is located in eastern part of the Nile delta to seaward. The main reservoirs of the area are Middle Pliocene mainly consist from siliciclastic which associated with a close deep marine environment. The Distribution pattern of the reservoir facies is limited scale indicating fast lateral and vertical changes which are not easy to resolve by applying of conventional seismic attribute. The target of the present study is to create geophysical workflows to a better image of the channel sand distribution in the study area. We apply both Average Absolute Amplitude and Energy attribute which are indicated on the distribution of the sand bodies in the study area but filled to fully described the channel geometry. So another tool, which offers more detailed geometry description is needed. The spectral decomposition analysis method is an alternative technique focused on processing Discrete Fourier Transform which can provide better results. Spectral decomposition have been done over the upper channel shows that the frequency in the eastern part of the channel is the same frequency in places where the wells are drilled, which confirm the connection of both the eastern and western parts of the upper channel. Results suggest that application of the spectral decomposition method leads to reliable inferences. Hence, using the spectral decomposition method alone or along with other attributes has a positive impact on reserves growth and increased production where the reserve in the study area increases to 75bcf.
1 Introduction
Seismic atPlease check the hierarchy of the section headings.tributes are defined as parameters and mensuration’s obtained from seismic data like amplitude, frequency, and attenuation, in addition to combinations of these (CitationSheriff, 1994; CitationCoren et al., 2001; CitationChopra and Marfurt, 2007). These attributes Since a long time used to supply us by important information and details about the geologic features, lithology, and stratigraphic channels (CitationTaner, 2001; CitationChopra and Marfurt, 2007; CitationAzevedo and Pereira, 2009). However, the most important implementation of seismic attributes is to acquire information from the raw seismic data which is not easily obvious (CitationAnees, 2013). Amplitude derived attributes are useful in providing structural and stratigraphic details by providing physical parameters about the subsurface like acoustic impedance, and other properties. However, the evaluating reservoir properties are more accurate based on the frequency attributes (CitationTaner, 2001; CitationBrown, 2001; CitationChopra and Marfurt, 2007). Based on using different attributes which displaying the feature of his interest and correlate between them in order to decrease the uncertainty (CitationChopra and Marfurt, 2007). Therefore, and Perhaps it is a favorite way for the delineation of future prospective reservoirs of Temsah field is the conventional seismic attributes along with the 3D visualization technique. In this work, we show an example of the joint application of common frequency cubes and amplitude tuning cubes for hydrocarbon detection in the study area. I will apply Conventional seismic attributes such as average absolute amplitude and Energy attribute, and try to detect geometry of the expected channel in the study. Still, the FFT technique of spectral decomposition has diligently detected the possible, channels geometry, and associated reservoir lithology.
Table 2 The different parameter used for estimation Gas Initial In Place (GIIP) in the new prospect.
1.1 Study area
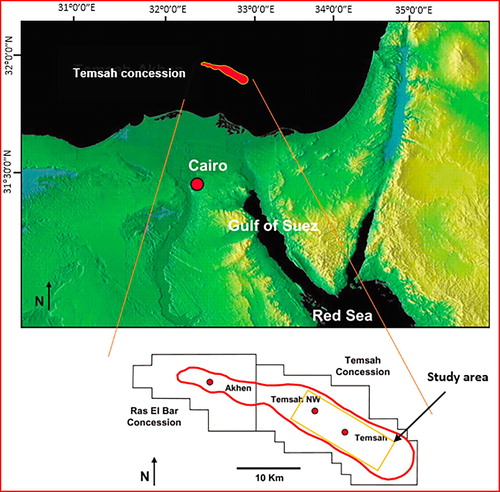
The area of study is situated in the Temsah Concession of Nile Delta offshore, located to the north from the Mediterranean shoreline about 65 km. Its 7 km to the north of the Mediterranean shoreline, lies between latitudes 31° 43′ 41.10″ and 31° 59′ 45.39″ N, and longitudes 31° 58′ 30.03″ and 32° 13′ 27.01″ E and covering an area of about 400 km2 in water depth ranging from 70 m to 120 m. The concession shareholders are IEOC (50%) and BP (50%) with PETROBEL as operating company ().
Fig. 1 Index map showing the location of the Temsah Field in offshore Nile delta, Egypt.
1.2 General geological setting
NE Nile Delta sequence appears to be thicker on the delta’s eastern flank, possibly due to the effects of longshore paleocurrents which swept large amounts of fluvial deposits eastwards (CitationSchlumberger, 1984). The Pliocene cycle defined by CitationRizzini et al. (1978), is classified into Kafr El Sheikh and El Wastani Formations (CitationAbd El Aal et al., 1994).
Sedimentation of the Pliocene in the Nile Delta consists of a deep marine sequence of Early Pliocene age unconformably overlying “fluvio-marine” Abu Madi & Qawasim Fm (Central sub-basin) and Rosetta “evaporites” (Eastern sub-basin) formations. These marine sequences are the shaly sediments of the Kafr El-Sheikh Formation.
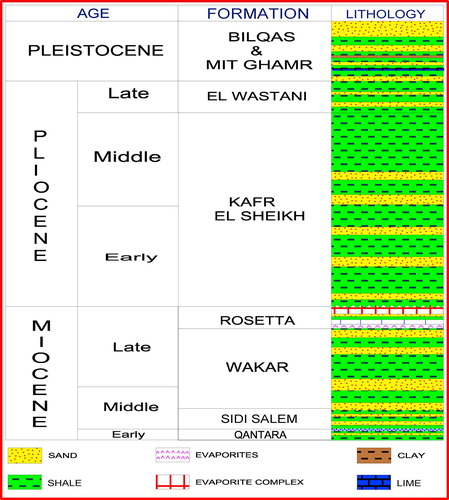
The sedimentary sequence penetrated by wells in the study area consists of thick Miocene-Pleistocene siliciclastic (). The stratigraphic units are arranged from older to younger as below:
Fig. 2 Compiled stratigraphic column of the study area. Petrobel internal report (2001).
Two channels have been identified in the study area referred to as the upper channel and lower channel. The two channels display a consolidated stratigraphic/structural trapping style and were deposited in a restricted deep marine turbiditic condition. Based on subsurface correlations and conventional petrophysical analysis, the canyon fill comprises multiple stacked channels that are as much as 165 m in gross thickness and that have 50 m of pay with an average nonshale porosity of 28% and average water saturation of 28%. An extensional normal fault cuts the two channels ().
Fig. 3 (a and b) Seismic inline through the D.1 and D.S.1 wells location with gamma-ray log correlation, (c) schematic section, and (d) paleogeographic map illustrating the expected form of Temsah channels and faults. Upper Channel is younger and incises into lower Channel.

2 Materials and methods
The study has 3D post-stack seismic volume acquired in 2003 and processed by PGS in 2004 over a total area of 400 km2 (). The seismic data were calibrated with the help of log and synthetic trace (–). Data were extensively visualized, colored-contoured and conventionally interpreted using the integrated Petrel reservoir characterization two-time horizons, within which Clear channel of fluid bearing has been clearly explaining in terms of main reflectors; namely, (Upper channel sand, lower channel Sand). To resolve subtle faults and assisted interpretation of channel geometries we application the following attributes.
Fig. 5 Avg. Abs. Amp (AAA) along “lower sand” map in Temsah area.
2.1 Average Absolute Amplitude (AAA)
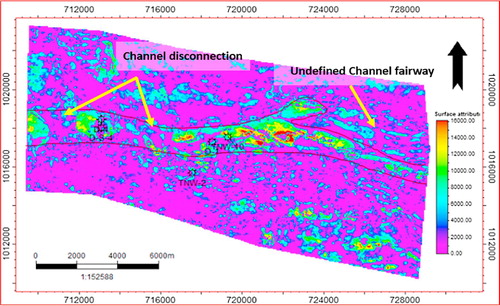
Its measure of reflectivity within a time or depth window can be utilized as an indicator of direct hydrocarbon in a zone intersted. This attribute was applied along two target levels surfaces (upper and lower channel sand) in Kafr El-Sheikh Formation. Average magnitude attribute map at the top upper channel shows a low amplitude in a few parts of the channel discontinuities on the channel fairway at the west and the poorly defined fairway at the east. Where the lower channel appears as low morphology with this attribute ( and ).
Fig. 4 Average Absolute Amplitude (AAA) along “Upper sand” map in Temsah area.
2.2 Energy attribute
It is a measure of reflectivity in the specified time-gate and there for the higher the Energy, the higher the Amplitude.
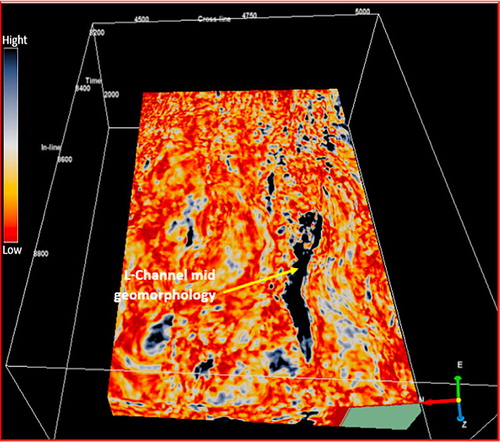
Horizon upper channel generate from average Absolut magnitude map appears as a low amplitude character in some parts of the channel, and found discontinuities on the channel at the west, and the poorly defined fairway at the east channel, On the other hand, these parts (west and east) channel appear as High energy (). This indicator on the east part may be connected with the upper channel. Notice the average energy for the lower channel is relatively high geomorphology () compared to previously examined with Average Absolute Magnitude (AAA).
Fig. 10 Average energy map at depth 1500 m (upper channel) in Temsah area.
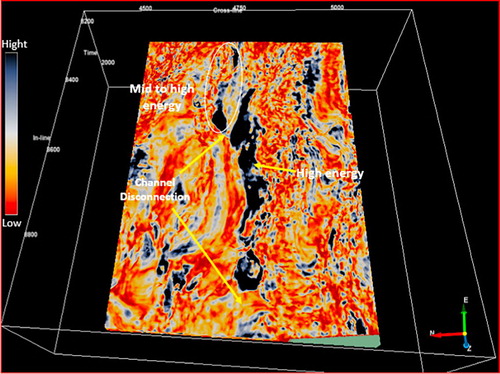
Fig. 12 Average energy map at depth 1800 m (lower channel) in Temsah area.
2.3 Spectral decomposition
CitationCastagna et al. (2003) utilized matching pursuit decomposition for instantaneous spectral analysis to recognize low-frequency shadows beneath hydrocarbon reservoirs. Peyton (1998) used coherency and spectral decomposition to interpret incised valleys. CitationPartyka et al. (1999)Citationand Rastogi (2013) used windowed spectral analysis to produce discrete-frequency energy cubes for applications in reservoir characterization. CitationHardy et al. (2003) demonstrated that average frequency characteristic delivered from sine bend fitting firmly associates with shale volume in a specific region. Spectral decomposition changes the seismic data into the frequency domain via mathematic methods such as discrete Fourier transform (DFT), Continuous Wavelet Transform (CWT), and different strategies. The changed outcomes incorporate tuning cubes and a variety of discrete common frequency cubes.
3 Results and discussion
According to the previous seismic attribute maps along the two channels in the study area, we could investigate some problems regarding channel delineation and geomorphology. There is a disconnection at the East part of the upper channel, which could separate the channel into two parts, secondary the channel fairway at the western part is not clearly defined, and lower channel appears as a low geometry. Based on all the previous attribute maps along the upper and lower channels, we can conclude that the seismic amplitude extractions failed to fully describe the channel extension. So another tool, which offers more detailed geometry description is needed. The Seismic spectral decomposition analysis usually offers much better channel geometry delineation.
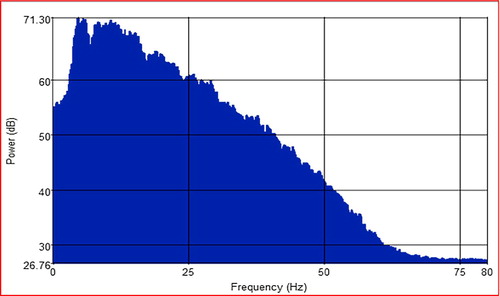
Prior to running the spectral decomposition, the seismic data peak frequency is about 25 Hz, and the frequency band is from 10 Hz to 80 Hz ().
Fig. 6 Amplitude Spectrum for the full seismic data within the reservoir interval.
First of all, on the basis of fine interpretation, seismic data for the zone of intrigue have been changed from the time domain into the frequency domain via discrete Fourier transform, and in turn produced an amplitude tuning cube. In this way we outline, that reservoir dissemination is within low frequencies and high amplitudes. On the contrary, low-frequency high amplitude hardly represents the distribution of hydrocarbon in the study area. In this way integrating tuning cubes with common frequency cubes is fundamental for exact hydrocarbon detection. The three frequency ranges () are: 5 Hz (the most minimal frequency range in the seismic dataset) in Red color, 25 Hz (the predominant frequency in the seismic dataset) in Green color, and 65 Hz (the highest frequency range in the seismic dataset) in Blue color ( and ).
Fig. 7 The amplitude variation of interesting zone (upper channel) on different common frequency sections.
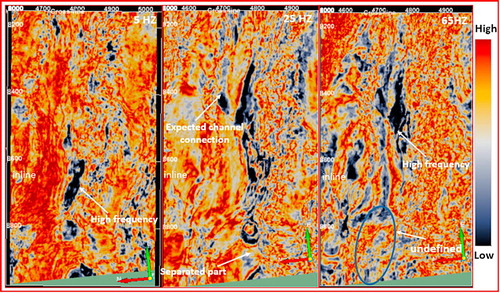
Fig. 8 The amplitude variation of interesting zone (lower channel) on different common frequency sections.
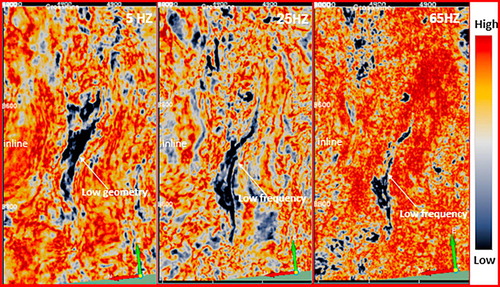
Fig. 9 Red, Green and Blue values calculated by three basic frequency The three frequency ranges are: 5 Hz in Red color, 25 Hz in Green color, and 65 Hz in Blue color.

Comparing the results of the spectral decomposition () with the AAA map and energy attribute. The dim parts at the middle part of the Upper channel on the AAA map () and the energy attribute () Seem to match with low-frequency range in the spectral decomposition map. This means that this channel seems to be connected. The end of the channel from the east side coincides with the low to middle-frequency range on the spectral decomposition map (in green to blue color), which defines the channel fairway. Some parts of the channel appear in white color which implies they have all frequency ranges; this meshes to the thickest parts of the channel. The same workflow was applied with the Spectral decomposition images combined to highlight lower channel edges and thins as well as overbank heterogeneity ().
Fig. 11 Color blended frequency map over the upper channel in Temsah area. The map shows the channel connectivity at the middle part which could not appear on the AAA map and the channel fairway is better defined at the end of the channel from the west side and separated at East Side.
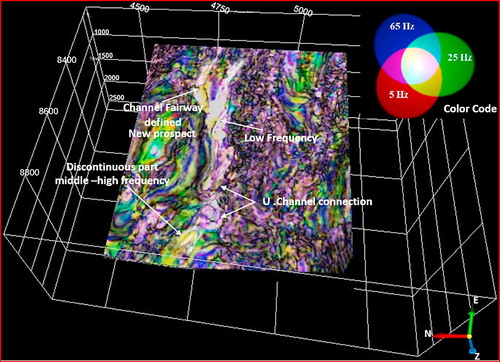
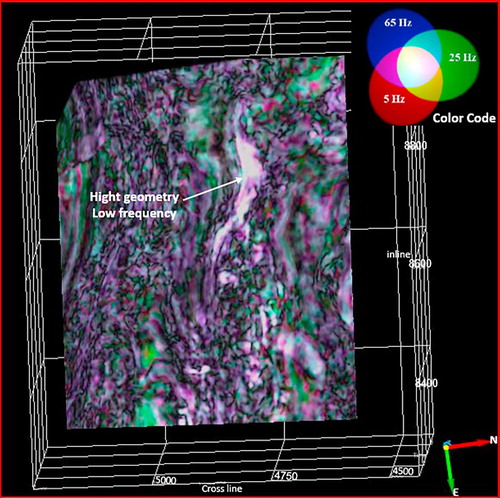
Fig. 13 Spectral decomposition images combined to give the final map; a bright, saturated White color indicates that all three frequencies are ‘bright’ in that area.
Finally, We used Monte Carlo simulation to predict the distribution of the Gas in place (GIIP) regarding changing the petrophysical parameters in the upper channel and the new prospect. This probabilistic (Monte Carlo Simulation) method covered the range of probable outcomes with P90, P50 and P10 outcomes as low, best and high estimates, respectively. shows average results of probabilistic P10 = 34.89, P50 = 62.44 and P90 = 93.6 values for upper channel area and the mean estimate of GIIP channel is 57.63 BCF. Where the average results of probabilistic for a new prospect are P10 = 32.26, P50 = 56.71 and P90 = 83.63 and the mean estimate of GIIP is 57.63 (). Parameters used in gas in place calculation are summarized in the following
Fig. 14 Monte Carlo simulation histogram showing probability distribution for the Gas in Place to the west part of the upper channel With 63.35 BCF mean GIIP.
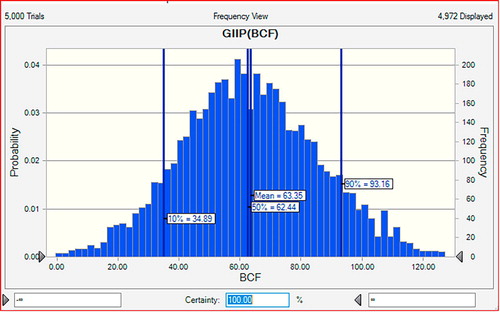
Fig. 15 Monte Carlo simulation histogram showing probability distribution for the Gas in Place to the east part of the upper channel (new prospect) With 57.53 BCF mean GIIP.
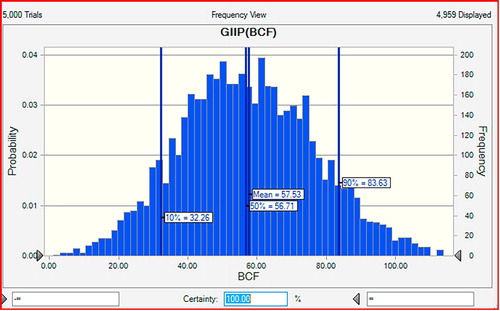
Table 1 The different parameter used for estimation Gas Initial In Place (GIIP) in the upper channel.
With the comparison between both the western parts of the channel, which contains this volume of gas with the eastern part of the same channel (new prospect) which appear as low frequency and coincided with the frequency of the west part of the channel. This means that the east part of this channel is a good place to new wells
4 Conclusion
The following conclusions are drawn from the research:
| I. | Based on the implementation of seismic attributes such as average absolute amplitude and energy attribute we can say that these attributes filled to fully describe the channel extension. | ||||
| II. | The spectral decomposition and 3D visualization techniques offer much better about channel geometry, where the upper channel in the study area appears connected at the eastern part and disconnected at the western part resulting from the effect of the normal fault between them and the lower channel more clearly with this technique. | ||||
| III. | The eastern part of the upper channel takes the same frequency that appears in the middle part of it, in which some wells were drilled that provide optimistic signs for hydrocarbon exploration to the eastern part of this channel. | ||||
| IV. | Base on the application of spectral decomposition and estimate the Gas Initial In Place (GIIP) to the upper channel There are main opportunity to more develop the Temsah field in The eastern part reach to 57bcf. | ||||
Acknowledgement
The authors are indebted to both Geophysics Department, Faculty of Science, Azhar University, Petrobel Company and the Egyptian General Petroleum Corporation (EGPC) for providing the raw seismic reflection data over the Temsah field to be used in this study.
Notes
Peer review under responsibility of National Research Institute of Astronomy and Geophysics.
References
- Abd El Aal, A., Roger, J., Price, Jon, Vaitl, D., Shrallow Jeffery, A., 1994. Tectonic evaluation of the Nile Delta, its impact on sedimentation and hydrocarbon potential. In: Gulf of Suez Petroleum Company, 12th Exploration and Production Conference, EGPC, Cairo, pp. 19–34.
- Anees, M., 2013. Seismic attribute analysis for reservoir characterization. In: 10th Biennial International Conference and Exposition.
- L.AzevedoG.R.PereiraSeismic Attributes in Hydrocarbon Reservoir Characterization2009Universidade de Aveiro, Departamento Geosciences
- Brown, A.R., 2001. Understanding seismic attributes. Geophysics 66(1), 47–48.
- J.P.CastagnaS.SunR.W.SiegfriedInstantaneous spectral analysis: detection of low-frequency shadows associated with hydrocarbonsThe Leading Edge222003120127
- Chopra, S., Marfurt, K.J., 2007. Seismic Attributes for Prospect Identification and Reservoir Characterization. Tulsa, Oklahoma, USA, 457p.
- F.CorenV.VolpiU.TinivellaGas hydrate physical properties imaging by multi-attribute analysis—Blake Ridge BSR case historyMar. Geol.17812001197210
- H.H.HardyR.A.BeierJ.D.GastonFrequency estimates of seismic tracesGeophysics6812003370380
- G.A.PartykaJ.GridleyJ.LopezInterpretational applications of spectral decomposition in reservoir characterizationLeading Edge1831999353360
- Rastogi, 2013. Recent developments in spectral decomposition of seismic data (techniques and applications). The Leading Edge 33, 164–170.
- Rizzini, A., Vezzani, F., Cococcetta, V., Milad, G., 1978. Stratigraphy and sedimentation of Neogene-Quaternary section in the Nile Delta area. Mar. Geol. 27, 327–348.
- Schlumberger, 1984. In Geology of Egypt. Paper Presented at the Well Evaluation Conference, Schlumberger, Cairo, pp. 1–64.
- Sheriff, R.E., 1994. Encyclopedia dictionary of exploration geophysics. Soc. Expl. Geophys.
- Taner, M.T., 2001. Seismic attributes. Canadian Society of Exploration Geophysicists Recorder, September, pp. 49–56.