
Abstract
This research aimed at assessing the approaching of Multi-Spectral Remote Sensing (MS-RS) data for estimating water quality (WQ) of Rosetta branch (RB) using stepwise regression technique. The methodology was based on developing an algorithm for estimating WQ using the Worldview-2 bands reflectance. Results showed that the optical WQ parameters as total suspended solids (TSS) and chlorophyll-a (Chl-a) were acceptably estimated using MS-RS data with high confident. The optical WQ parameters are the most likely affecting the reflected radiation that sensed by the satellite. However, this research expanded to select non-optical WQ parameters such as pH value and biological demand (BOD) that is less likely affecting the radiation reflectance, nevertheless, still correlated to optical WQ parameters. The determination coefficient showed significant high values for ortho-phosphate (OP), total dissolved solids (TDS), Chl-a and pH with different mathematical formulations depending on pollution level. The results showed that, it is promising to perform routine WQ monitoring programs on different water bodies, even for those has relative narrow width as RB, using MS-RS data.
1 Introduction
Egypt faces a rapidly increasing deterioration of its surface and groundwater due to heavy discharges of polluted domestic and industrial effluents into its water bodies. In addition, excessive use of pesticides and fertilizers in agriculture also causes water pollution problems (CitationJahin et al., 2009).
According to CitationRifaat and Mohamed (2004) the Nile River system receives a large quantity of industrial, agriculture and domestic wastewater; however, it is still able to recover in virtually all the locations, with very little exception. The Rosetta branch (RB), as part of this system, flows downstream Delta Barrage to the north-west about 225 km and ends with Idfina barrage which regulates the excess flow of the branch. It is considered the main source of fresh water for the western side of the Nile Delta. Idfina barrage regularly releases water to the Mediterranean Sea during winter closure period.
Along RB, there are two main causes of pollution which degrade the quality of water. These are agricultural and industrial points discharging directly into the branch. The major agricultural source, further Talla and Sabal drains, is Rahawy drain. The significance of that drain is that, besides agriculture drainage water, it carries sewage effluents of a side of great Cairo (i.e., about 2.2 million m3/day) besides some industrial effluent. These effluents would conceivably alter the composition of natural environment of the branch and consequently affect the ecological conditions prevailing (CitationEl Gammal and El Shazely, 2008).
The traditional measurement of water quality requires in situ sampling, which is a costly and time-consuming effort. Because of these limitations, it is impractical to cover the whole water body or obtain frequent repeat sampling at a site. This difficulty in achieving successive water quality sampling becomes a barrier to water quality monitoring and forecasting (CitationSenay et al., 2001). It would be advantageous to watershed managers to be able to detect, maintain and improve water quality conditions at multiple river and lake sites without being dependent on field measurements (CitationShafique et al., 2003).
Remote sensing techniques have the potential to overcome these limitations by providing an alternative means of studying and monitoring water quality over a wide range of both temporal and spatial scales. Several studies have confirmed that remote sensing can meet the demand for the large sample sizes required for water quality studies conducted on the watershed scale (CitationSenay et al., 2001). Hence, it is not surprising that a significant amount of research has been conducted to develop remote sensing methods and indices that can aid in obtaining reliable estimates of these important hydrological variables. These methods ranged from semi-empirical techniques to analytical methods for estimating and producing quantitative water quality maps (CitationDekker, 1997 as cited in CitationShafique et al., 2001). Several research articles (CitationGitelson et al., 1993; CitationDekker et al., 1996, Citation2002) had developed different prediction models for lake water quality parameters using satellite spectral bands with several ratios or indices. These water quality parameters have included chlorophyll-a, suspended matter and turbidity, as they most likely change the water color.
Most satellite remote sensing studies have chosen optical property parameters such as chlorophyll a, turbidity or colored dissolved organic matters (CitationCoskun et al., 2008). Recently, there have been some studies advocating for the use of a satellite remote sensing approach to determine nutrient distributions in lakes because of the advantage of synoptic coverage that is not available from traditional sampling methods (CitationChen and Quan, 2012). Few studies have attempted to monitor and model nutrient data, since these models do not yield results as statistically strong or consistent as constituents that have optical properties (CitationChen and Quan, 2012; CitationDewidar and Khedr, 2001; CitationWu et al., 2010). CitationDewidar and Khedr (2001) studied phosphorus and nitrogen levels in Egypt's waters using Landsat TM imagery with statistically significant results for these parameters. CitationChen and Quan (2012) used Landsat TM imagery to attempt to predict nitrogen and phosphorus concentrations in Tiahu Lake, China with some successful results for phosphorus (R2 = 0.63), and less successful results for nitrogen (R2 = 0.24).
In Egypt, most of the earlier researches on water quality monitoring using remote sensing technology were focusing on the wide water bodies as lakes. However, this research was focusing on different characteristics, relatively narrow water body (i.e., Rosetta branch).
In using regression models for prediction, too many regressors cause a higher prediction variance whereas too few regressor variables give a biased prediction. This requires a compromise and is the reason for subset selection. The problem of determining the best subset of variables has long been of interest to applied statisticians and, primarily because of the current availability of high-speed computation, this problem has received considerable attention in the statistical feature. Methods and criterion functions for subset selection are reviewed by CitationHocking (1976).
This work aimed at assessing the use of MS-RS data for estimating of Rosetta branch water quality using statistical techniques. The work was based on developing an algorithm for estimation of water quality using the Worldview-2 bands reflectance. This research expanded to select non-optical parameters such as pH and biological oxygen demand (BOD) that is less likely affecting the radiation reflectance nevertheless still correlated to water quality parameters.
2 Methodology
Most previous studies focused on the discovery of the relationship between remote sensing data and in situ measurements. However, this research was expanded to select laboratory parameters such as FC and ortho-phosphate that is less likely affecting the radiation reflectance nevertheless still correlated to water quality. Remote sensing was further confirmed to be very useful on establishing a time cost effective method for the routine monitoring of different water body. In the future the solution to water quality issues can be solved rapidly using these technologies for sustainable water resources management.
2.1 Study area
This study focused on the area started upstream Rahawy drain outfall into Rosetta branch toward the downstream of about 17 km where the drain water shows its influence on the branch. Rosetta River Nile branch represents the main freshwater stream that extends northwards for about 225 km on the western boundary of the Nile Delta from Egypt's Delta barrage. shows the area under study of Rosetta branch with adjacent suburban.
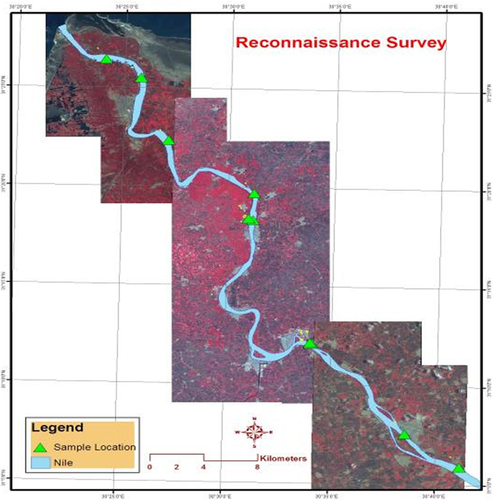
The selected sampling sites were lay at the southern part of the Rosetta branch where Rahawy drain outfall is located. For the purpose of identifying the sampling locations and its correspondence with the remote sensing data, a ground control points were established. The ground control points were collected using global positioning system (GPS), to rectify the satellite image.
GPS is also used to determine the ground control points in the reconnaissance survey. Therefore, the necessity of these water samples for the classification process highly depends on the accuracy of the fieldwork and laboratory analysis.
The objective of water sampling should be the collection of a “representative” sample of water conditions over specified water body. Therefore sampling equipment, sampling method, monitoring locations, and sample handling procedures should not alter the chemistry of the sample. Because there is a significant difference between water qualities near eastern bank of the branch compared to near western bank, the field and satellite data are analyzed considering two different cases as follows:
| • | Case 1: the assessment and estimation of the regression model between the water quality data collected near eastern bank of Rosetta branch and the corresponding satellite data. | ||||
| • | Case 2: the assessment and estimation of the regression model between the water quality data collected near western bank of Rosetta branch, where Rahawy drain is discharging, and the corresponding satellite data. | ||||
2.2 Imagery data
WorldView-2 is the first commercial high-resolution satellite to provide eight spectral sensors in the visible to near-infrared range. Each sensor is narrowly focused on a particular range of the electromagnetic spectrum that is sensitive to a particular feature on the ground, or a property of the atmosphere. Worldview-2 is the first high-resolution satellite with 0.5 m panchromatic and 2 m multispectral resolutions. It was launched in 2009 and includes 8 spectral bands. In this Research, the 8 spectral bands were identified with B1, B2, etc. The inclusion of Yellow, Red-Edge, NIR1 and NIR2 bands are very sensitive to vegetation pigments and therefore this data is expected to be very useful for vegetation analysis such as precision agriculture (e.g. discriminate vegetation species), environmental mapping (e.g. identify regions of plant stress), etc. Four WorldView-2 images acquired on 2010 and 2011 were used in this study. These images were used due to its relatively less cloud cover (10%) in the study area compared to other dates in the archive.
2.3 Water sampling procedures
Water was sampled from pre-defined cross sections over the branch. Two water samples were collected, over each cross section, 20 m away from west and east banks of the branch. In total, 38 water samples were collected during different agriculture seasons from the study area downstream Rahawy drain. The water sampling was carried out during four field trips in November 2010, April, July and, December 2011. A number of water quality variables were measured at field during sampling; however, the rest of water quality variables were analyzed at the Central Laboratory for Environmental Quality Monitoring (CLEQM) of the National Water Research Center. All physicochemical and biological variables were analyzed according to the standard methods for lab examination of water and wastewater suggested by American Public Health Association (CitationAPHA, 2005).
Nineteen sampling locations on each bank side (i.e., east and west) were sampled four times with more water samples in-between the sampling groups and upstream Rahawy drain outfall. The calculations carried out on 74 records for east side and 72 for west side. Some sampling locations were eliminated in one or more field trips due to quality insurance of WQ sampling. The data size is 146 records in total presenting, for each sample, different water quality parameters and the corresponding spectral imagery data.
This study focused on the Rosetta branch which considered the main source of fresh water for the western side of the Nile Delta. The established and analyzed the combined remote sensing and statistical methods was to retrieve water quality focusing on several and diverted variables namely pH, dissolved oxygen (DO), total dissolved solids (TDS), total suspended solids (TSS), total alkalinity (TA), ortho-phosphate (OP), biological oxygen demand (BOD), chemical oxygen demand COD, chlorophyll-a (Chl-a), fecal coliform (FC) and total coliform (TC).
2.4 Statistical model development
The final step consists of the development of the algorithm which is able to predict clarity values from spectral features of the satellite imageries. When a continuous dependent variable from a number of independent variables is required, a regression analysis recommended to be carried out, in this case a multiple linear regression. Standard multiple regression allows us to discover how well each independent variables (i.e., spectral values) predicts the dependent variable (i.e., water quality parameters). Multiple regression models with spectral ratio have found to be more robust and more reliable than the regression model with single band (CitationVincent et al., 2004). For this reason, stepwise selection method was used to determine the best fitting model.
The statistical analysis had been carried out using the SPSS Statistics software package (by SPSS Inc.). It was acquired by IBM in 2009. The software name stands for Statistical Package for the Social Sciences (SPSS).
The Stepwise Regression Analysis basically selects a sub-set from a list of explanatory variables (i.e., independent variables). Most statistical software has a facility for carrying out stepwise regression, forward selection and backward elimination of variables based on their overall contribution to the F statistic. Significance of F can be set by the individual or left to the default value.
Stepwise regression removes and adds variables to the regression model for the purpose of identifying a useful subset of the predictors. Stepwise first finds the explanatory variable with the highest correlation, represented in the coefficient of determination (R2), to start over. It then tries each of the remaining explanatory variables until it finds the two with the highest R2. Then it tries all of them again until it finds the three variables with the highest R2, and so on. The overall R2 gets larger as more variables are added.
The change in the R2 statistic is produced by adding or deleting an independent variable. If the R2 change associated with a variable is large, that means that the variable is a good predictor of the dependent variable.
Only variables significantly and linearly related to the dependent variable (i.e., the WQ parameter) are included in the model. The analyst may select minimum significance levels for inclusion or removal. The precession of WQ parameter accounts on whole model of adding new independent variable's rather than effect on WQ parameter in isolation. This makes the stepwise regression computationally efficient. All the standard assumptions for regression analysis were fulfilled, including:
| • | The sample is representative of the population for the inference prediction. | ||||
| • | The error is a random variable with a mean of zero conditional on the explanatory variables. | ||||
| • | The independent variables are measured with no error. | ||||
| • | The predictors are linearly independent. | ||||
| • | The variance of the error is constant across observations (homoscedasticity). | ||||
3 Results and discussion
The descriptive statistics shown in were measured for the data collected from the measuring sites near to west, where Rahawy drain discharging, and east banks of the branch, respectively. Comparing the mean value of each variable with the standard limits recommended by Law 48/year 1982, it was found that TA, COD, BOD and DO variables have mean values exceeding the permissible limits recommended by the most recent executive arts (i.e., issue of 2013) of law 48/1982 (i.e., 6 mg/l for BOD, 10 mg/l for COD and greater than 5 mg/l for DO). The high values of COD, BOD and consequently low values of DO along Rosetta branch indicate that the Branch receives non-biodegradable and biodegradable organic matter. shows the paired-samples t test of water quality variables between east and west sampling sets. The paired-samples t test procedure is used to test the hypothesis of no difference between two variables. The results show a significant difference between the east and west samples for all the water quality parameters except for TSS and Chl-a.
Table 1 Descriptive statistics of water quality variables along Rosetta branch.
Table 2 Paired-samples t test of water quality variables between both sampling sets.
Case 1: as listed in , the regression models between the water quality data collected near to the eastern bank of Rosetta branch and the corresponding satellite data were formulated using stepwise multiple linear regression technique. All formulated models were representing acceptable regressive correlations (i.e., greater than 0.4) especially for pH, TDS, TA, BOD, COD, Chl-a. The higher R2 means that the variables (i.e., spectral bands) are good predictors of the dependent variable (i.e., WQ parameter).
Table 3 The regression equations of water quality parameters over Rosetta branch (east side).
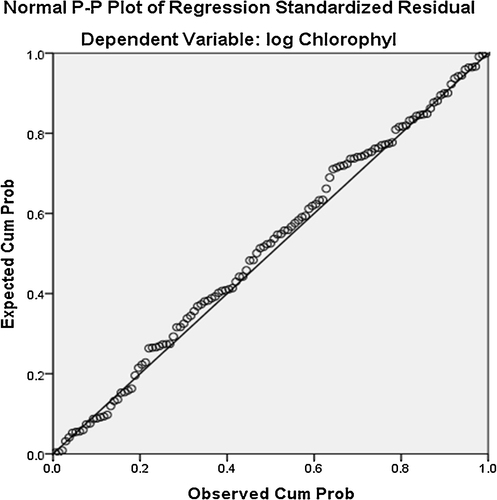
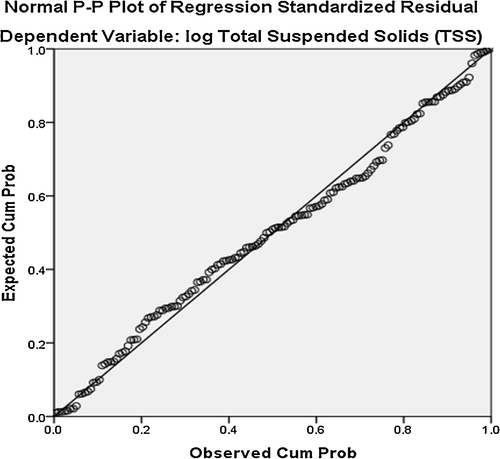
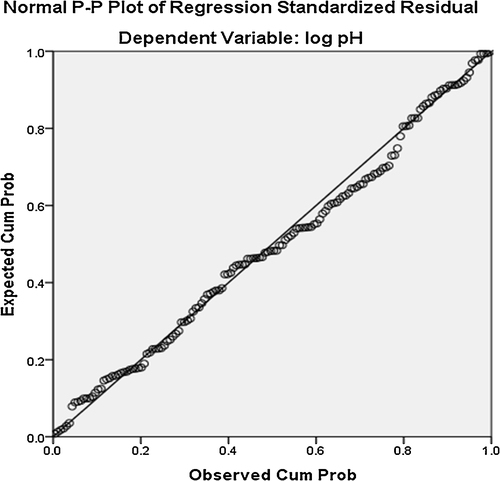
The normality of residuals is used for indicating goodness of fit of the regression model. The normality plots of the residuals of the generated models follow the normal distribution. The normality plots of Chl-a, TSS, and pH is illustrated in – respectively as representatives of the generated models. The residuals of the regression models compared to field observations follow normal distribution.
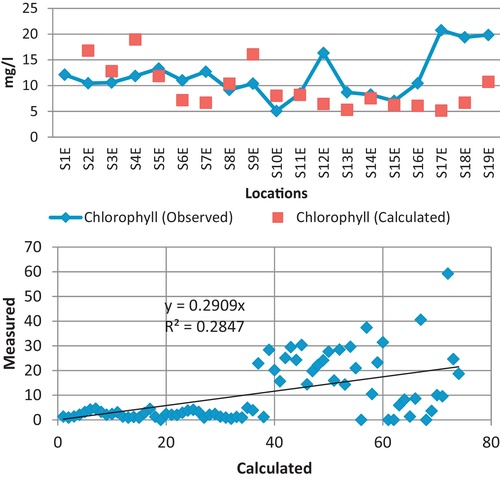
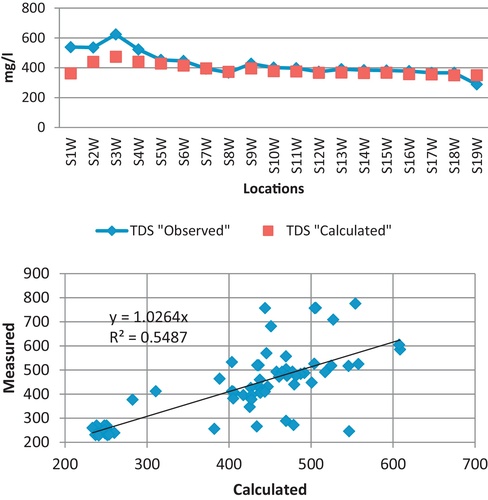
– show the modeled water variables against the observed value. The modeled results show a smoother variation than the observed data. There was a significant variance between calculated and field observed data of the Chl-a; however, both data sets show the same spatial trend as shown in . However the coefficient of determination, showed at the lower part of , which computed for the regression between the measured and calculated Chl-a show a relatively slight value.
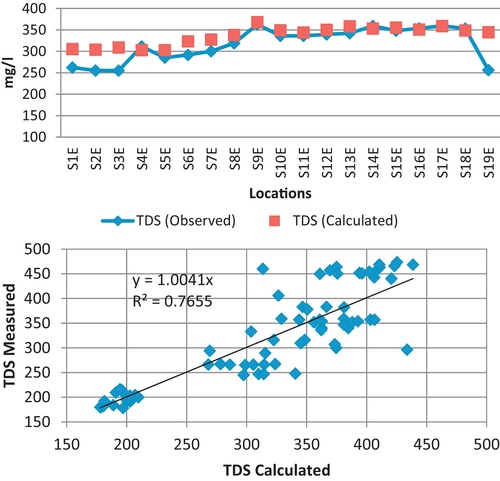
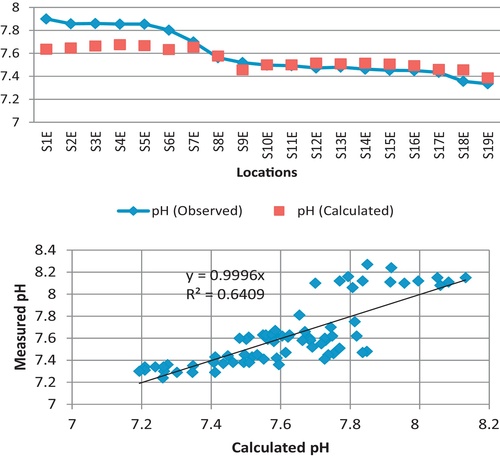
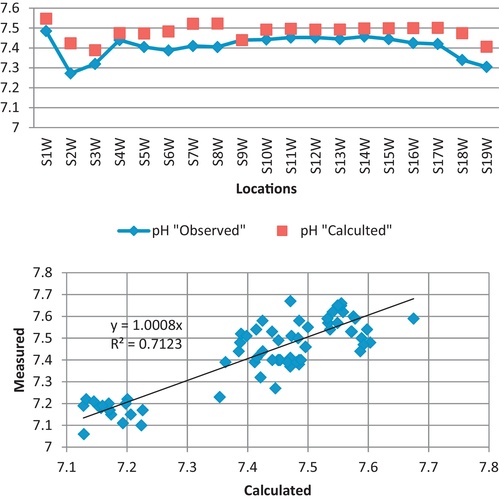
The calculated TDS values show the best visual matching with its observed data among all the analyzed water quality variables as seen in . Despite that pH is classified as non-optical water quality parameter, both field and calculated data sets show a good agreement as seen in . The coefficient of determination for the regression between the measured and calculated TDS and pH values were about 0.8 and 0.6 respectively as seen in and indicating a good fitting.
Case 2: in the regression equations to estimate the water quality variables from the satellite data applied on the field data collected near to the western bank of the sampling area on the Rosetta branch are given. This data is representing the effect of Rahway drain on the branch. However, the regression models estimated for water quality near western bank show a different trend than these estimated for water quality near eastern bank. These differences in regression equations were due to the variance in pollution level that is significantly affecting the reflected radiation to the satellite. The higher R2 presented in means that the spectral bands are good predictors of the WQ parameter.
Table 4 The regression equations of water quality parameters over Rosetta branch (west side).
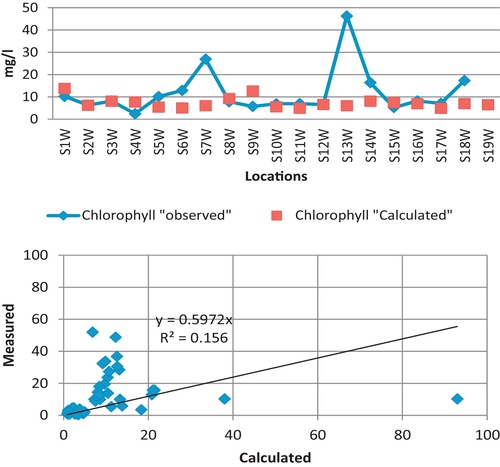
The concentrations of chlorophyll-a near west bank show much different behavior than near east bank as shown in and . The variation in Chl-a concentration from cross section to another is moderately less in the water samples near west bank where Rahawy drain is discharging than those near east bank; however, the concentrations near west are higher.
The TDS concentrations, in general, show higher values near west bank (see ) where Rahawy drain is discharging than those near east bank (see ). The high TDS concentration illustrates that the high pollution levels come from the drain. After the outfall of Rahawy drain the pH level of RB decreased by 0.2 as illustrated in .
It is worth to mention that, the higher pollution level along the western side of the branch affect the satellite image in a matter that decrease the correlation between satellite data and field observations of water quality variables.
4 Conclusions
This study showed significant correlations between the non-optical water quality variables and remote sensing data in Rosetta branch water. The use of satellite image data in water quality monitoring is a promising process. Not all the water quality parameters respond similarly to the statistical analysis for the estimation of the relationship between satellite data and earth observations. The water quality parameters that affect the water color (i.e., chlorophyll-a and TSS) furnished good correlation with satellite data than the non-optical WQ parameters that slightly affect water color (i.e., oxygen related), nevertheless, those parameters are still very satisfactory.
Due to the significant difference between the WQ of the east and west data sets, the regression models estimated for water quality near western bank show a different formulation than these estimated for water quality near eastern bank. These differences in regression formation were obviously due to the variance in pollution level that is significantly affecting the reflected radiation to the satellite.
Acknowledgements
This research was partially part of the Using Remote Sensing to Improve Water Quality Monitoring and Modeling in the Nile Delta of Egypt Project. The project was funded from the Italian Development Cooperation (Grant Number “DS_03_NWRC”) and progressed for three years started in April 2009. Here, the authors thank all the project team provided collaborated work utilized in this research.
Notes
Peer review under the responsibility of National Water Research Center.
References
- APHA (American Public Health Association)Standards Methods for the Examination of Water and Wastewater21th ed.2005American Public Health AssociationWashington DC, USA
- J.ChenW.T.QuanUsing Landsat/TM imagery to estimate nitrogen and phosphorus concentration in Taihu Lake, ChinaIEEE J-STARS512012273280 10.1109/JSTARS. 2011.2174339
- H.G.CoskunA.TanikU.AlganciH.K.CigizogluDetermination of environmental quality of a drinking water reservoir by remote sensing, GIS and regression analysisWater Air Soil Pollut.1941–42008275285 10.1007/s11270-008-9716-x
- A.G.DekkerOperational Tools for Remote Sensing of Water Quality: A Prototype Tool Kit1997Vrije Universiteit Amsterdam, Institute for Environmental Studies BCRS Report 96-18
- A.G.DekkerR.J.VosS.W.M.PetersAnalytical algorithms for lake water TSM estimation for retrospective analysis of TM and SPOT sensor dataInt. J. Remote Sens.23120021535
- A.G.DekkerZ.Zamurovic-NenadH.J.HoogenboonS.W.M.PetersRemote sensing, ecological water quality modelling and in situ measurements: a case study in shallow lakesHydrol. Sci. J.4141996531547
- K.DewidarA.KhedrWater quality assessment with simultaneous Landsat-5 TM at Manzala Lagoon, EgyptHydrobiologia4571–320014958
- H.A.El GammalH.S.El ShazelyWater quality management scenarios in Rosetta River Nile Branch, EgyptTwelfth International Water Technology Conference, IWTC12 2008Alexandria, Egypt2008
- A.GitelsonG.GarbuzovF.SzilagyiK.H.MittenzweyK.KarnieliA.KaiserQuantitative remote sensing methods for real-time monitoring of inland waters qualityInt. J. Remote Sens.14199312691295
- R.R.HockingThe Analysis and Selection of Variables in Linear Regression. A Biometrics Invited Papervol. 32(1)1976International Biometric Society149
- H.S.JahinB.N.BarsoumT.A.TawficJ.V.HeadleyOccurrence and distribution of polycyclic aromatic hydrocarbons in the Egyptian aquatic environmentJ. Environ. Sci. HealthA44122009
- A.W.RifaatI.B.MohamedWater quality assessment of the River Nile system: an overviewBiomed. Environ. Sci. (BES)17200487100
- G.B.SenayN.A.ShafiqueB.C.AutreyF.FulkS.M.CormierThe selection of narrow wavebands for optimizing water quality monitoring on the Great Miami River, Ohio using hyperspectral remote sensor dataJ. Spat. Hydrol.12001122
- N.A.ShafiqueF.FulkB.C.AutreyJ.FlotemerschHyperspectral remote sensing of water quality parameters for large rivers in the Ohio River basinProc. First Interagency Conf. on Research in the Watersheds2003216221
- N.A.ShafiqueB.C.AutreyF.FulkS.M.CormierHyperspectral narrow wavebands selection for optimizing water quality monitoring on the Great Miami River, OhioJ. Spat. Hydrol.112001122
- R.K.VincentX.QinR.MichaelL.McKayJ.MinerK.CzajkowskiJ.SavinoT.BridgemanPhycocyanin detection form LANDSAT TM data for mapping cyanobacterial blooms in Lake ErieRemote Sens. Environ. J.892004381392
- C.F.WuJ.P.WuJ.G.QiL.S.ZhangH.Q.HuangL.P.LouEmpirical estimation of total phosphorus concentration in the mainstream of the Qiantang River in China using Landsat TM dataInt. J. Remote Sens.319201023092324