
 ?Mathematical formulae have been encoded as MathML and are displayed in this HTML version using MathJax in order to improve their display. Uncheck the box to turn MathJax off. This feature requires Javascript. Click on a formula to zoom.
Abstract
To assess 12 years of pollution abatement efforts in all drain estuaries in Northern Egypt, which discharge to Northern Lakes and the Mediterranean Sea, this paper provides temporal trends in water quality indices from 2002 to 2013. For the estuary of 20 drains: one drain had insufficient data to analyze for trends (Burullus Drain), four drains had significant increase in water quality index (WQI) score (Bahr ElBaqar Drain, Drain No. 1, Tabia Drain and No. 11 Drain), one drain had significant declination in water quality score over the tested time period (Ramsis Drain). While the rest (14 drains) showed insignificant trend in either direction (improving or declining). Water quality fluctuated over that time period. On average, temporal changes in excursions of coliform count from their threshold can explain 83.3% of the temporal variability observed in water quality indicators monitored in all drain estuaries (38.9%% < R2 < 89.2%). Therefore, the most effective water quality variables among a set of variables affecting the WQI score was total coliform.
1 Introduction
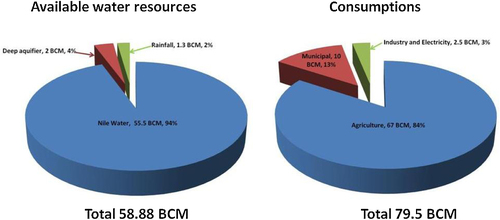
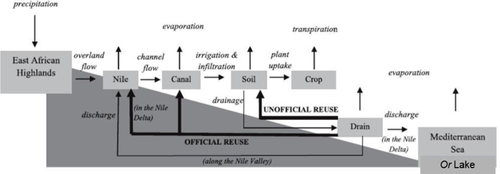
Egypt, an arid country has a negative water balance. The supply of Nile River water is limited, which provides Egypt with 55.5 BCM/yr of water each year from Lake Nasser (CitationPaisley and Henshaw, 2013). Economic development and population growth in Egypt continue to increase the demands for water. Meeting these demands, places increasing stress on Egypt's water institutions to support the country's need for food, urban, industrial and environmental water uses (CitationGohar and Ward, 2010). In summary, the actual water resources currently available for use in Egypt are 55.5 BCM/yr Nile River, 1.3 BCM/yr effective rainfall on the northern strip of the Delta and 2 BCM/yr non-renewable groundwater for western desert and Sinai, while water requirements for different sectors are in the order of 79.5 BCM/yr. The gap between the needs and availability of water is about 20 BCM/yr. Shallow Groundwater in the Nile aquifer cannot be considered a separate source of water. The aquifer is recharged only by seepage losses from the Nile, the irrigation canals and drains and percolation losses from irrigated lands. Hence, its yield must not be added to Egypt's total water resources. Therefore, it is considered as a reservoir in the Nile river system with a huge capacity but with only 7.5 BCM/yr rechargeable live storage. The current abstraction from this aquifer is estimated at 6.5 BCM in 2013 (). This gap is overcome by recycling (CitationMWRI, Egypt, 2014). The agricultural drainage water provides an integral supplement to Egypt's water supply. Much of Egypt's water is used multiple times on its journey through the country (). On the last, drain estuaries discharge to coastal marine bodies; Lakes or Mediterranean Sea directly (CitationBarnes, 2012).
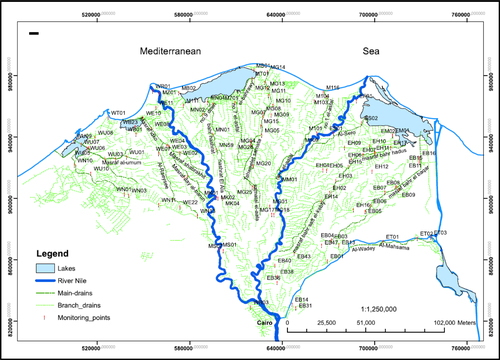
Drainage systems receive large quantities of nutrients; in addition to human settlements intensifying pollution problems, such as waste disposal from their urban and industrial centers (CitationElsokkary and AbuKila, 2011, Citation2012; CitationShaban et al., 2010). Some pollutants may lead to organic over-enrichment, eutrophication and health-related problems, which adversely affect biological communities and resources through different mechanisms (CitationChang et al., 2012; CitationGarcía-Barcina et al., 2006; CitationCloern, 2001). One of these is the depletion of dissolved oxygen caused by the aerobic decomposition of organic and inorganic compounds, thus being an environmental concern in many coastal marine bodies throughout the world (CitationChang et al., 2012; CitationAlexander et al., 2008; CitationGarcía-Barcina et al., 2006; CitationDiaz and Rosenberg, 1995). In addition, pathogenic microbes in sewage-born polluted waters pose a serious public health hazard, preventing their recreational use (CitationBartram and Rees, 2000). Fortunately, some adverse effects of pollution can be reversed by means of abatement actions (CitationChang et al., 2012; CitationGarcía-Barcina et al., 2006; CitationCloern, 2001). However, evaluation of progress in achieving goals in pollution reduction can be a challenge due to factors such as the high variability in environmental conditions and the existence of time lags in recovery responses (CitationChang et al., 2012; CitationGarcía-Barcina et al., 2006; CitationBoesch, 2002). Appropriate monitoring is crucial to identify the effectiveness of abatement strategies and their usefulness in achieving the established goals (CitationWu and Chen, 2013; CitationChang et al., 2012; CitationGarcía-Barcina et al., 2006; CitationBoesch, 2002). Therefore, the routine work of the National Water Quality Monitoring Network (NWQMN) in Egypt covers these drains to detect their short/long term water quality changes. The monitoring program started in 1977 to monitor a few quantitative and qualitative water parameters, predominantly concerning salinity in some of the main drains in the Nile Delta (CitationShaban and Abukila, 2012). After that, the monitoring program measures a large number of parameters (quality and quantity) from more than 138 locations in the Nile Delta and Fayoum region () (CitationNAWQAM, 2001a). The quality parameters comprise organic contamination, chemical composition, salinity and other physical properties (CitationNAWQAM, 2001a, Citationb; CitationDRI, 2007).
The particular situation in Egypt has prompted the Government to focus for decades on water resources and its protection. A proactive policy to supply the population with drinking water has been almost successful, including in rural areas. Protection of water resources has resulted in a policy of development of sanitation in urban areas and most cities are equipped. However, the deficit remains very important in rural areas for the sector (CitationSWIM, 2013).
Coastal lagoons of the Nile River are the largest lagoons in the north of Africa, representing approximately 25% of the total lagoons of the Mediterranean Sea (CitationSaad, 2003). Fish production in Egypt at 2009 was 78.8 × 10³ tons in the Mediterranean Sea, 49.0 in the Red Sea, 5.5 in Lake Mariut, 6.2 in Lake Edko, 53.4 in Lake Burullus, 48.0 in Lake Manzala, 0.2 in Lake Port Fouad, 5.4 in Lake Bardawil, 47.2 in inland lakes, 87.3 in River Nile and canals and 705 in Fish farming (CitationAbdel Rahman, 2011). In recent decades, as a result of rapid economic development, increasing population in the delta region and associated industrialization exert high environmental pressures. Industrial wastes and municipal effluents have been largely pumped into the delta coast lagoonal wetlands (Manzala, Borollus, Edku and Mariut), causing eco-environmental degradation with significant public health concerns (CitationNassar and Gharib, 2014; CitationGu et al., 2013; CitationShaban et al., 2010; CitationRasmussen et al., 2009; CitationSoliman et al., 2006).
Traditional approaches to assess water quality are based on a comparison of experimentally determined parameter values with existing guidelines. However, it does not readily give an overall view of the spatial and temporal trends in the water quality in watersheds (CitationDebels et al., 2005). The classification, modeling and interpretation of monitoring data are the most important steps in the water quality assessment; the quality is difficult to evaluate from a large number of samples each containing concentrations of many parameters (CitationAlmeida et al., 2007). Therefore, in December 2007 a beta version of the Egyptian Water Quality Index (EWQI), based on the Canadian Council of Ministers of the Environment (CitationCCME, 2001) was developed (CitationKhan et al., 2008).
The water quality index method was initially proposed by Horton in 1965 (CitationKani and Murugesan, 2011). Since then, the formulation and use of indices have been strongly advocated by agencies responsible for water supply and control of water pollution. WQI concept is based on the comparison of the water quality parameters with respective to regulatory standards and gives a single value to the water quality of a source, which translates the list of constituents and their concentrations present in a sample (CitationKhan et al., 2003). It is a mechanism for presenting a cumulatively derived numerical expression defining a certain level of water quality (CitationBordalo et al., 2006). WQI is a numeric expression used to transform large quantities of water characterization data into a single number (CitationSanchez et al., 2007) and it is a measure of how the water quality variables compare to the water quality guidelines or objectives for a specific site. The WQI has been considered as one criterion for surface water classifications, based on the use of standard parameters for water characterization. The index result represents the level of water quality in a given water basin. WQI assess the appropriateness of the quality of the water for a variety of uses (CitationKhan et al., 2003,Citation2008; CitationCude, 2001) such as habitat for aquatic life, irrigation, recreation, drinking water, etc. It is considered more appropriate for disseminating information to general audiences.
Water quality index is not part of the Egyptian law and decrees related to water quality, but it is a critical tool for water resources management. It was developed to evaluate and communicate the suitability of water bodies in Egypt for various uses such as drinking, irrigation, livestock, aquatic life and recreation.
The main objective is to develop a National Water Resources Plan that describe how Egypt will safeguard its water resources, up to the year 2017, both with respect to quantity and quality, and how it will use these resources in the best way from a socio-economic and environmental point of view. The new policy is based on a strategy that has been called “Facing the Challenge” (FTC). FTC includes measures to develop additional resources, making better use of existing resources, and measures in the field of water quality and environmental protection. Implementing the strategy FTC will improve the performance of the water resources system. More water will be available for the various uses and the water quality will improve significantly. The agricultural area will increase by 35% as a result of horizontal expansion and the two mega projects in Toshka and Sinai. Living space in the desert will be created for more than 20% of the population as a result of these projects attention (CitationEuro-Mediterranean Information System on know-how in the Water sector, 2008).
In this paper, the spatial and temporal responses of the drains, which discharge to Northern Delta Lakes of Egypt and Mediterranean Sea, are explored to test the pollution abatement measures taken over the last 12 years. Therefore, temporal trends were analyzed by means of ordinary least squares, simple linear regression of annual values of these parameters (Y: WQI or excursions of coliform count from their threshold) on year of measurement (X: from 2002 to 2013).
2 Materials and methods
2.1 Study area
The Drainage Research Institute (DRI), of the National Water Research Center, monitors the quantity and quality of the agricultural drainage water in the Nile Delta and Fayoum region. DRI measures a large number of parameters from more than 138 locations () (CitationNAWQAM, 2001a). The quality parameters comprise organic contamination, chemical composition, salinity and other physical properties. lists drains which discharge to Northern Delta Lakes of Egypt and Mediterranean Sea (CitationNAWQAM, 2001a, Citationb; CitationDRI, 2007). Most of small drains in the Nile Delta discharge in these main drains. Sampling sites located at the end of these drains before discharging to Lake or Mediterranean Sea (drain estuary).
Table 1 Drains discharged to coast Delta lagoons and Mediterranean Sea.
2.2 Sample collection and analysis
For the purpose of this study, 20 sampling sites () monitored monthly from 2002 to 2013 were selected. After collection; salinity, temperature, dissolved oxygen and turbidity were measured promptly with portable sensors (WTW Multi 350i multimeter). The remaining variables were analyzed later at the Central Laboratory for Environmental Quality Monitoring (CLEQM) of the National Water Research Center.
2.3 Water quality index (WQI)
According to the Canadian Council of Ministers of the Environment (CitationCCME, 2001), Water Quality Index (CCME WQI) provides a measure of the deviation of water quality from water quality guidelines. The CCME WQI model consists of three measures of variance from selected water quality objectives (scope; frequency; and amplitude). These three measures of variance are combined to produce a value between 0 and 100 that represents the overall water quality (CitationCCME, 2001).
The detailed formulation of the WQI Canadian Water Quality Index consists of three measures which are described as follows:
Scope, F1: it represents the extent of water quality guideline non-compliance over the time period of interest which was calculated as Eq. (Equation1(1)
(1) ).
(1)
(1)
Frequency, F2: it represents the percentage of individual tests that do not meet objectives (“failed tests”) was calculated as Eq. (Equation2(2)
(2) ).
(2)
(2)
Amplitude, F3: it represents the amount by which failed tests do not meet their objectives. This is calculated in three steps:
Step 1 – Calculation of Excursion: Excursion is the number of times by which an individual concentration is greater than (or less than, when the objective is a minimum) the objective. When the test value did not exceed the objective was calculated as Eq. (Equation3(3)
(3) ).
(3)
(3)
When the test value must not fall below the objective, it was calculated as Eq. (Equation4(4)
(4) ).
(4)
(4)
Step 2 – Calculation of Normalized Sum of Excursions: The normalized sum of excursions, nse, is the collective amounts by which individual tests are out of compliance. This is calculated by summing the excursions of individual tests from their objectives and dividing by the total number of tests (both those meeting objectives and those not meeting objectives) was calculated as Eq. (Equation5(5)
(5) ).
(5)
(5)
Step 3 – Calculation of F3: F3 is calculated by an asymptotic function that scales the normalized sum of the excursions from objectives to yield a range from 0 to 100 was calculated as Eq. (Equation6(6)
(6) ).
(6)
(6)
The WQI is then calculated as Eq. (Equation7(7)
(7) ):
(7)
(7)
The factor of 1.732 arises because each of the three individual index factors can range as high as 100. This means that the vector length can reach as a maximum. Division by 1.732 brings the vector length down to 100.
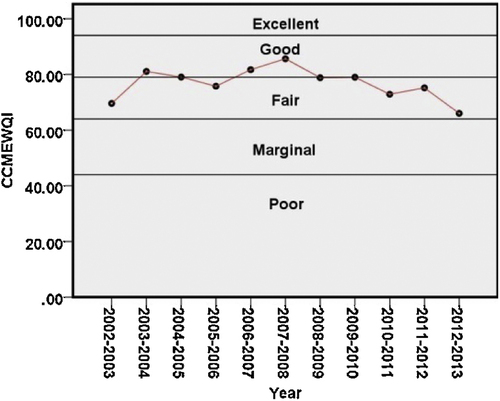
The index produces a number between 0 (worst water quality) and 100 (best water quality). These numbers are divided into 5 descriptive categories to simplify presentation.
Excellent: (CCME WQI Value 95–100): water quality is protected with a virtual absence of threat or impairment; conditions very close to natural or pristine levels.
Good: (CCME WQI Value 80–94): water quality is protected with only a minor degree of threat or impairment; conditions rarely depart from natural or desirable levels.
Fair: (CCME WQI Value 65–79): water quality is usually protected but occasionally threatened or impaired; conditions sometimes depart from natural or desirable levels.
Marginal: (CCME WQI Value 45–64): water quality is frequently threatened or impaired; conditions often depart from natural or desirable levels.
Poor: (CCME WQI Value 0–44): water quality is almost always threatened or impaired; conditions usually depart from natural or desirable levels.
The specific variables, objectives, and period used in the index are not specified and indeed could vary from a region to another depending on local conditions and issues. It is recommended that at a minimum of four variables and sampled at least four times would be used in the calculation of index values. It is also expected that the variables and objectives chosen will provide relevant information about a particular site (CitationKhan et al., 2005).
At the present study, the water quality scores were computed by CCME WQI based on law No. 4 of the year 1994, the water quality guidelines for discharging into the marine environment (CitationEEAA, 1994). To evaluate the WQI of the drains estuaries, 11 water quality variables are used, including pH, temperature, total suspended solid (TSS, mg/l), total dissolved solid (TDS, mg/l), biochemical oxygen demand (BOD5, mg/l), dissolved oxygen (DO, mg/l), ammonium-nitrogen (NH4-N mg/l), total coliform (CFU/100 ml), cadmium (Cd, mg/l), lead (Pb, mg/l) and nickel (Ni, mg/l). (Example of the water quality index using the data set is available at CitationAbukila et al., 2012.)
2.4 Data analysis
The existence and magnitude of temporal trends in WQI of the drain estuaries were investigated. Temporal trends were analyzed by ordinary least squares, simple linear regression of annual values of these parameters (Y, WQI) on year of measurements (X: from 2002 to 2013). Before introducing to trend analysis, the existence of linear relationship was inspected and normality of the dependent variable (WQI) was statistically tested using the Shapiro–Wilks test or Kolmogorov–Smirnov test (CitationZar, 1996). If the P-value is more than 0.05, we can reject the alternative hypothesis and conclude that the data comes from a normal distribution. According to WQI data was normally distributed.
Table 2 Test of normality.
In order to estimate the extent of the change in WQI which could be explained by temporal change in excursions of total coliform from their objective, regressions of WQI on excursions of total coliform from their objective were also computed.
All statistical analyses were performed using SPSS version 16.0 (CitationSPSS, 2007).
3 Results and discussion
3.1 Temporal trends in water quality index (Y) and year of (X)
For each dependent variable (Y, WQI), the coefficient-of-determination of the corresponding linear regression model on year of measurement (X) (R2%), the unstandardized (B) regression coefficient and the statistical significance (P) are shown.
3.1.1 Drains discharging to Lake Manzala
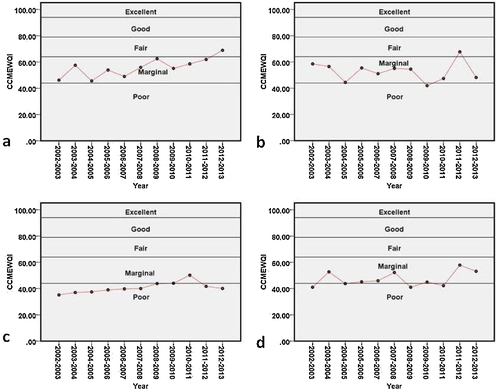
CCME WQI values of Bahr ElBaqar Drain indicated that water quality for aquatic uses could be related as poor to marginal (). The temporal trend significance increases (P < 0.05; ). Unstandardized (B) regression coefficient indicates how much the dependent variable goes up, on average, given that the independent variable goes up one unit. Therefore, for independent variable (year of measurement), the coefficient 0.928 () means that an increase of one year (independent variable) corresponds to an increase of 0.928 (less than 1) points of WQI (dependent variable). Hence, the rate of improvement in water quality is very slow. Consequently, WQI score is 37–48 over tested period.
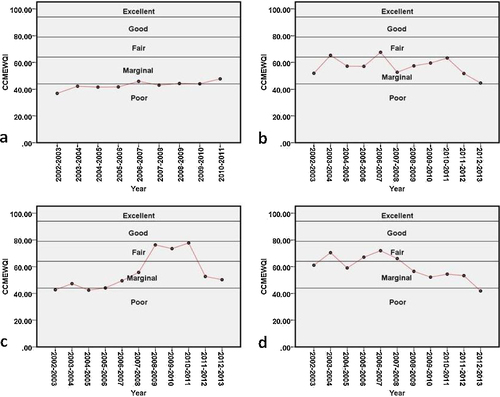
Table 3 Temporal trends of WQI (Y) over time period from 2002 to 2013 (X) of drains discharged to coast Delta lagoons and Mediterranean Sea.
Bahr Hadus Drain did not show significant trend in WQI over the period from 2002 to 2013 (P > 0.05; ). R2 tells whether the fit is good at predicting or explaining the values of dependent variable (Y, WQI) in the samples. The greater the value of R2, the better the fit is. The Sig (P) values give a rough indication of the impact of predictor variable (X, years). A small P value suggests that a predictor variable (X, years) is having a large impact on the criterion variable (Y, WQI). Therefore, temporal changes in year of measurement (X) can explain only 12.1% of the temporal variability observed in the WQI (). During the study periods, WQI fluctuated between 45 and 68 indicating that WQI for aquatic uses can be rated as marginal to fair ().
Results of Matareya Drain analysis demonstrated that water quality has been improved until 2011, but declined at the last 2 years. However, WQI do not demonstrate any significant temporal trends (Y: WQI, X: year of measurement from 2002 to 2013). Therefore, P value suggests that the independent value (X) is having a small impact on the dependent value (Y) (P > 0.05, ). Also the insignificance of the relation is also highly supported by R2 (R2 = 30.8%, ). During the study periods, WQI fluctuated between marginal to fair for aquatic uses ().
CCME WQI values of Ramsis Drain indicated that the water quality for aquatic uses can be fluctuated between marginal, fair and poor (). It had the high variation in WQI score (42–72) according to year. The temporal trend analysis demonstrated that the water quality is declining significantly (P < 0.05; ) and the temporal changes in the year of measurement can explain 55.9% of the temporal variability observed in the WQI. Slope of the regression line = −2.038 WQI/year (), the coefficient is negative which would indicate more years is related to lower WQI, on average water quality dropped to 2.038 point/year on WQI scale.
3.1.2 Drains discharging to Lake Timsah
The water quality of Mahsama Drain is mostly related as fair for aquatic uses (). Results of the temporal trends do not demonstrate any statistically significant trends (P = 0.371, R2 = 9.0%; ). Therefore, temporal trends confirmed that the year of measurement from 2002 to 2013 has a small impact on WQI.
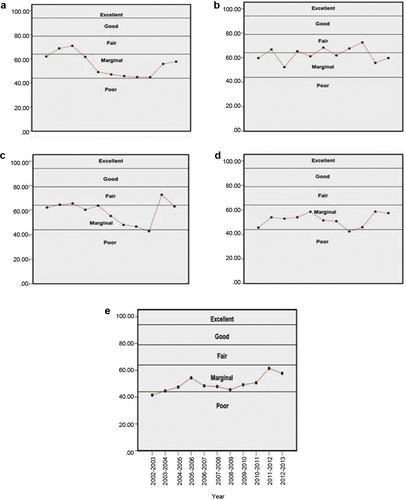
3.1.3 Drains discharging to Lake Burullus
There are six drains discharging to Lake Burullus. One of them had insufficient data to analyze for temporal trend (Burullus Drain). While, one of them had significant improving water quality trend (No. 11 Drain, P < 0.05, R2 = 55.2%, rate of improvement water quality = 1.315 point/year on WQI scale; ). Whereas, four drains had no significant temporal trends (Nashart Drain, Tira Drain, No. 7 Drain and Lower No. 8 Drain P > 0.05; ). Therefore, this procedure ensures that increasing or decreasing WQI of those four drains is fluctuated through most of the year and not due to year variation. In general, the water quality of those five drains is mostly rated as marginal to fair for aquatic uses ().
3.1.4 Drains discharging to Lake Edko
CCME WQI values of Edko Drain indicated that the water quality for aquatic uses can be mostly rated as marginal. It had the variation in WQI score (50–73) according to the year (). A high P value (P = 0.346) suggests that an independent variable (X, years) is having a small impact on the dependent variable (Y, WQI). In addition, temporal changes in year of measurement (X) can explain only 9.9% of the temporal variability observed in the WQI ().
Temporal trends of Barsiq Drain indicate insignificant trends in water quality over time (P = 0.137; ). The insignificance of the relationship is also highly supported by R2 = 22.9%. WQI values of Barsiq Drain indicated the water quality for aquatic uses can be mostly rated as marginal to fair. It had the variation in WQI score (43–73) according to year ().
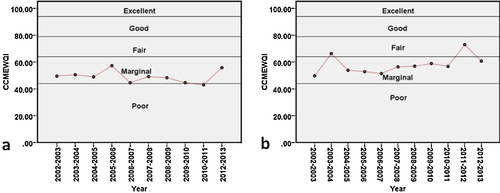
3.1.5 Drains discharging to Lake Mariut
All drains discharging to Lake Mariut showed no significant trends in water quality over time. A high P value (P = 0.267, 0.137 and 0.474 for El Umum Drain, EL Qalaa Drain and West Nubaria Drain, respectively; ) suggests that year of measurement is having a small impact on water quality of those drains. In addition, temporal changes in year of measurement can explain only 13.40, 22.80 and 6.60% of the temporal variability observed in the WQI respectively ().
WQI of EL Qalaa Drain is rated as poor; this has been reported in by CitationShreadah et al., 2014. On the other hand, WQI of El Umum Drain fluctuated from marginal to fair in. The best drain that has high score of water quality is West Nubaria Drain which, WQI can be mostly rated as fair ().
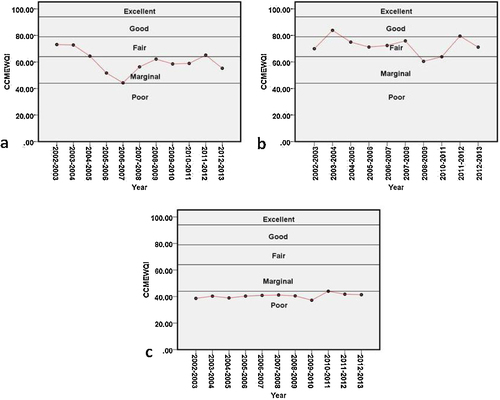
3.1.6 Drains discharging to Mediterranean Sea
The objective of the statistical analysis was to evaluate temporal trends in water quality over time. In Mediterranean Sea, there are four drains discharging directly to it. Drain No. 1 and Tabia Drain show significant improving water quality trend (P < 0.05 on both; ). In addition, temporal changes in the year of measurement can explain 61.7% and 48.7%, respectively of the temporal variability observed in the WQI (). While, water quality of Gharbia Drain and Max pump station fluctuated during the study period (2002–2013) temporal trends ensure that increasing or decreasing water quality of those drains had no significance trends. Therefore, a high P value (P = 0.791 and 0.255 for Gharbia Drain and Max pump station, respectively; ) suggests that the year of measurement has a small impact on water quality of those two drains. In addition, temporal changes in year of measurement can explain only 0.8% and 14.1% of the temporal variability observed in the WQI ().
Although Tabia Drain shows significant improvement in water quality trend over time but it has the worst water quality of the four drains discharging directly to the Mediterranean Sea. WQI Tabia Drain is mostly rated as poor over year period (2002–2013). While, fluctuated mostly from marginal to fair in other drains (). On the other hand, the rate of improvement in water quality is very slow, on average water quality rose to 0.866 point/year on WQI scale (). Consequently, WQI score is 35–50 over tested period.
3.1.7 Concentration median based on constructed dataset
For the 20 drains discharging to Northern Lakes and Mediterranean Sea, one drain has insufficient data to be analyzed for trends (Burullus Drain), four drains had significant increases in water quality (Bahr ElBaqar Drain, Drain No. 1, Tabia Drain and No. 11 Drain), one drain (Ramsis Drain) had significant declination in water quality over the time period (2002–2013). While the rest (14 drains) showed no significant trend in either direction (improving or declining) Therefore, water quality fluctuated over the time period (2002–2013).
illustrates the water quality evaluated by CCME, WQI values based on median values of 19 drains discharging to Northern Lakes and Mediterranean Sea. The figure showed that water quality value is rated as marginal. According to categorization schema of CCME WQI; water quality (in general) of drains discharging to Northern Lakes and Mediterranean Sea is frequently threatened or impaired, conditions often depart from natural or desirable levels.
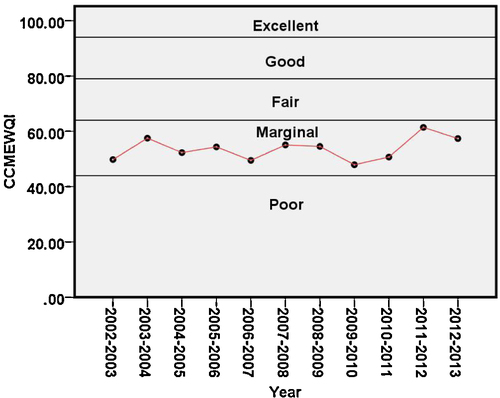
In general, a high P value as median of all tested drains (P = 0.369; ) suggests that the year of measurement has a small impact on the water quality of those drains. In addition, temporal changes in year of measurement can explain only 9.0% of the temporal variability observed in the WQI ().
3.2 Temporal trends in water quality index (Y) and normalized sum of total coliform excursions (X)
The temporal changes in water quality can be directly related to the trends in excursions of coliform from their objective (the objective = ≤4000 CFU/100 ml according to Egyptian law 4/1994). The regression analysis of WQI on excursions of coliform was statistically significant in each case except El Qalaa Drain ().
Table 4 Temporal trends of WQI (Y) over normalized sum of total coliform excursionsTable Footnotea (X) from 2002 to 2013 of drains discharged to coast Delta lagoons and Mediterranean Sea.
In general, a small P value as median of all tested drains (P = 0.000; ) suggests that excursions of total coliform on the objective is having a high impact on water quality of those all drains. In addition, temporal changes in excursions of total coliform on the objective can explain only 83.3% of the temporal variability observed in the WQI monitored in all drains discharging to north Lakes and Mediterranean Sea. Therefore, high level of coliform had the most affected WQI score ().
Coliform concentrations in the drains are closely related to domestic and industrial wastewater discharges, particularly in heavily populated catchments. Thus, the significance increases in bacteriological pollution registered in the drains can be attributed to the increase of the pollutant load to the Lakes.
3.3 The relation between government's efforts to protect the waterways from pollution and temporal trends in WQI
According to data issued from the Ministry of Housing, investment in sanitation field during 2010–2011 can be summarized as follows:
| (i) | Investment in the field of sewage during facial year 2010–2011 increased to 4.1 billion LE, which lead to remarkable increase in the capacity and power also in average per capita share of the sanitation design. | ||||
| (ii) | The percentage of sewage coverage increased in towns and cities, where in cities it reaches 75% in 2008 and village 8%, and in 2010/2011 the percentage of sewage coverage reached 90% in cities and 12% in villages. | ||||
| (iii) | The Ministry of Housing has set an executive and integrated plan to increase percentage of sanitation coverage in villages to 40%, and this percentage will increase to 100% during the coming 15 years. | ||||
The total number of sewage water treatment plants amounted 333 plants at the level of the republic in fiscal year 2010/2011 in comparison to 301 treatment plants in fiscal year 2008/2009 with increase of 32 plants by ratio 11% as clarified in (CitationMinistry of State for Environmental Affairs, 2012).
Table 5 Number of sewage water treatment plants in fiscal year 2010/2011.
The analysis in the current data set in most of the tested sites (14 drains) showed no significant trend in either direction (improving or declining). Therefore, water quality fluctuating over the period (2002–2013) does not demonstrate any statistically significant trends, even though pollution abatement efforts developed by Egyptian government. This may be due to bad practice in monitoring process, operation and maintenance of wastewater treatment plants. Which have a negative significant impact on sustainability.
4 Recommendation
According to strategy Facing the Challenge, the municipal and industrial water use efficiency can be improved by a mix of infrastructural and financial incentives or measures. Various research topics are formulated to identify further options to increase the efficiency of the system. This includes reduction of pollution by stimulating clean products and reallocation of certain industries. Agriculture will be encouraged to use more environmental friendly methods and products. If pollution cannot be prevented, treatment is the next option. This includes treatment of municipal sewage and wastewater. Cost recovery is needed to maintain the services. The last resort will be to control the pollution by diverting the pollution away from urban or important ecological areas. Additional attention is required to protect sensitive areas, e.g. around groundwater wells and intakes of public water supply. The strategy also includes a number of general institutional measures. The initiated process of decentralization (to Water Boards and Water User Associations) and privatization should be strengthened, including a restructuring of the role of MWRI, e.g. by establishing integrated inspectorates in the Ministry. Cost-sharing and pricing mechanisms have to be implemented to make the changes sustainable, in particular with respect to operation and maintenance. The planning process at national level should be continued as a rolling exercise, including the improvement of data and information exchange among different authorities and the co-ordination of investments. Finally, the role of the real stakeholders in water resources management, i.e. farmers and citizens should be enhanced, to involve them better in the various water management tasks but also to strengthen their “ownership” feelings toward public property (CitationEuro-Mediterranean Information System on know-how in the Water sector, 2008). It is commonly agreed that water infrastructure needs to be more flexible, adaptable and sustainable (e.g. CitationSitzenfrei et al., 2013; CitationSWIM, 2013; CitationWorld Bank and Leeds University, 2012; CitationDomènech and Saurí, 2010; CitationBrown et al., 2009).
5 Conclusions
Twelve consecutive years of water quality data were analyzed at drain estuaries discharging to Northern Egypt Lakes and the Mediterranean Sea. In an effort to better understand the trends in these data, a simple linear regression was conducted on the 12-year dataset from 2002 to 2013, using CCME WQI involving 11 water quality variables. Results of the site-specific analysis demonstrate that water quality is improving at 4 sites (Bahr ElBaqar Drain, Drain No. 1, Tabia Drain and No. 11 Drain), but declining at 1 site (Ramsis Drain). Although the total number of sewage water treatment plants amounted 333 plants in year 2010/2011 in comparison to 301 treatment plants in year 2008/2009 with increase of 32 plants by ratio 11%. However, most of the sites do not demonstrate any statistically significant trends. This may be due to bad practice in monitoring process, operation and maintenance of wastewater treatment plants.
In general, results of the statistical methods as regression demonstrate that temporal changes in excursions of coliform count from their threshold can explain only 83.3% (in general) of the temporal variability observed in the WQI monitored in all drains discharging to north Lakes and Mediterranean Sea. Therefore, high level of coliform had the most effect on WQI score. However, temporal changes in water quality parameters can be used as a ‘barometer’ by which the success of pollution controls can be evaluated; this agree with the results found by CitationVezzaro et al. (2014), CitationChang et al. (2012), CitationGarcía-Barcina et al. (2006) and CitationDoering (1996).
Conflict of interest
None declared.
Notes
Peer review under responsibility of National Water Research Center.

References
- S.H.Abdel RahmanEgypt country reportMeeting on Mediterranean Coastal Lagoons Management: Interactions Between Aquaculture and Capture Fisheries28–30 June, Cagliari, Italy2011
- A.F.AbukilaR.M.S.El-KholyM.I.KandilAssessment of water resources management and quality of El Salam Canal, EgyptInt. J. Environ. Eng.420123453
- R.B.AlexanderR.A.SmithG.E.SchwarzE.W.BoyerJ.V.NolanJ.W.BrakebillDifferences in phosphorus and nitrogen delivery to the Gulf of Mexico from the Mississippi River BasinEnviron. Sci. Technol.422008822830
- C.A.AlmeidaS.QuintarP.GonzalezM.A.MalleaInfluence of urbanization and tourist activities on the water quality of the Potrero de los Funes River (San Luis – Argentina)Environ. Monit. Assess.1332007459465
- J.BarnesMixing waters: the reuse of agricultural drainage water in EgyptGeoforum201210.1016/j.geoforum.2012.11.019
- F.BartramG.ReesMonitoring Bathing Waters: A Practical Guide to the Design and Implementation of Assessments and Monitoring Programmes2000E&FN SponLondon/New York
- D.F.BoeschChallenges and opportunities for science in reducing nutrient over-enrichment of coastal ecosystemsEstuaries252002886900
- A.A.BordaloR.TeixeiraW.J.WiebeA water quality index applied to an international shared river basin: the case of the Douro RiverEnviron. Manag.382006910920
- R.R.BrownN.KeathT.H.F.WongUrban water management in cities: historical, current and future regimesWater Sci. Technol.5952009847855
- CCME (Canadian Council of Ministers of the Environment)Canadian water quality guidelines for the protection of aquatic life: CCME water quality index 1.0, technical reportCanadian Environmental Quality Guidelines, 19992001Canadian Council of Ministers of the EnvironmentWinnipeg
- W.K.ChangJ.RyuY.YiW.-C.LeeC.-W.LeeD.KangC.-H.LeeS.HongJ.NamJ.S.KhimImproved water quality in response to pollution control measures at Masan Bay, KoreaMar. Pollut. Bull.642012427435
- J.E.CloernOur evolving conceptual model of the coastal eutrophication problemMar. Ecol. Prog. Ser.102001223253
- C.CudeOregon Water Quality Index: a tool for evaluating water quality management effectivenessJ. Am. Water Resour. Assoc.372001125137
- P.DebelsR.FigueroaR.UrrutiaR.BarraX.NiellEvaluation of water quality in the Chilla’n River (Central Chile) using physicochemical parameters and a modified water quality indexEnviron. Monit. Assess.1102005301322
- R.J.DiazR.RosenbergMarine benthic hypoxia: a review of its ecological effects and the behavioural responses of benthic macrofaunaOceanogr. Mar. Biol. Annu. Rev.231995245303
- P.H.DoeringTemporal variability of water quality in the St. Lucie estuary, South FloridaWater Resour. Bull.36199612931306
- L.DomènechD.SauríSocio-technical transitions in water scarcity contexts: public acceptance of greywater reuse technologies in the Metropolitan Area of BarcelonaResour. Conserv. Recyl.55120105362
- DRI (Drainage Research Institute)Drainage Water Status in the Nile Delta, Year Book 2005/2006. Technical Report No. 762007DRI, NWRCEgypt
- EEAA (Arab Republic of Egypt, Egyptian Environmental Affairs Agency)Law 4/1994 for the protection of the environment1994
- I.H.ElsokkaryA.F.AbuKilaWater quality evaluation of El-Umoum Drain, west Nile Delta of Egypt during the period 1989–2010Alex. Sci. Exch. J.322011453466
- I.H.ElsokkaryA.F.AbuKilaProspective speculation for safe reuse of agricultural drainage water in irrigationAlex. Sci. Exch. J.342012134152
- Euro-Mediterranean Information System on know-how in the Water sectorNational Water Resources Policy 20172008http://emwis.mwri.gov.eg/institutions%20-%20planing%20sector%20-text.htm
- J.M.García-BarcinaJ.A.Gonzalez-OrejaA.De la SotaAssessing the improvement of the Bilbao estuary water quality in response to pollution abatement measuresWater Res.402006951960
- A.A.GoharF.A.WardGains from expanded irrigation water trading in Egypt: an integrated basin approachEcol. Econ.69201025352548
- J.GuA.SalemZ.ChenLagoons of the Nile delta, Egypt, heavy metal sink: with a special reference to the Yangtze estuary of ChinaEstuar. Coast. Shelf Sci.1172013282292
- K.M.KaniA.G.MurugesanEvaluation and classification of water quality of Perennial River Tamirabarani through aggregation of water quality indexInt. J. Environ. Prot.120112433
- F.KhanT.HusainA.LumbWater quality evaluation and trend analysis in selected watersheds of the Atlantic region of CanadaEnviron. Monit. Assess.882003221242
- A.A.KhanA.TobinR.PatersonH.KhanR.WarrenApplication of CCME procedures for deriving site specific water quality guidelines for the CCME water quality indexWater Qual. Res. J. Can.402005448456
- A.KhanS.Abdel-GawadH.KhanA real time water quality monitoring network and water quality indices for River Nile13th IWRA World Water CongressMontpellier, France2008
- MWRI (Ministry of Water Resources and Irrigation, Egypt)Water Scarcity in Egypt: The Urgent Need for Regional Cooperation Among the Nile Basin Countries2014
- Ministry of State for Environmental AffairsEgypt State of the Environment Report, 20112012
- M.Z.A.NassarS.M.GharibSpatial and temporal patterns of phytoplankton composition in Burullus Lagoon, Southern Mediterranean Coast, EgyptEgypt. J. Aquat. Res.402014133142
- NAWQAM (The National Water Quality and Availability Management Project)Evaluation and Design of Egypt National Water Quality Monitoring Network2001
- NAWQAMNAWQAM Project Information Bulletin2001National Water Research Center
- R.K.PaisleyT.W.HenshawTransboundary governance of the Nile River Basin: past, present and futureEnviron. Dev.720135971
- E.K.RasmussenO.S.PetersenJ.R.ThompsonR.J.FlowerM.H.AhmedHydrodynamic-ecological model analyses of the water quality of Lake Manzala (Nile Delta, Northern Egypt)Hydrobiology6222009195220
- A.M.SaadImpact of diffuse pollution on the socio-economic development opportunities in the coastal Nile Delta lakesDiffuse Pollution ConferenceDublin2003
- E.SanchezM.F.ColmenarejoJ.VicenteA.RubioM.G.GarciaL.TraviesoR.BorjaUse of the water quality index and dissolved oxygen deficit as simple indicators of watershed pollutionEcol. Indic.72007315328
- M.ShabanB.UrbanA.El SaadiM.FaisalDetection and mapping of water pollution variation in the Nile Delta using multivariate clustering and GIS techniquesJ. Environ. Manag.91201017851793
- M.ShabanA.F.AbukilaMultivariate statistics and numerical modeling for optimizing water quality monitoring networks10th Gulf Water Conference22–24 April, Doha2012
- M.A.ShreadahM.S.MasoudA.R.M.KhattabG.M.ElzokmImpacts of different drains on the sea water quality of El-Max bay (Alexandria, Egypt)J. Ecol. Nat. Environ.82014287303
- R.SitzenfreiM.MöderlW.RauchAssessing the impact of transitions from centralised to decentralised water solutions on existing infrastructures – integrated city-scale analysis with VIBeWater Res.47201372517263
- A.S.SolimanX.WangJ.D.StanleyN.El-GhawalbyM.L.BondyF.EzzatA.SoultanM.Abdel-WahabO.FathyG.EbidiN.Abdel-KarimK.A.DoB.LevinS.R.HamiltonJ.L.AbbruzzeseGeographical clustering of pancreatic cancers in the northeast Nile delta, region of EgyptArch. Environ. Contam. Toxicol.512006142148
- SPSSSPSS Graduate Pack 16.0 for Windows2007SPSSChicago
- SWIM (Sustainable Water Integrated Management (SWIM)) – Support Mechanism Project funded by the European UnionReview and analysis of status of implementation of wastewater strategies and/or action plans national report Egypt2013http://www.swim-sm.eu/files/National_Report_WW_strategies-EG_Final.pdf
- L.VezzaroM.L.ChristensenC.ThirsingM.GrumP.S.MikkelsenWater quality-based real time control of integrated urban drainage systems: a preliminary study from Copenhagen, DenmarkProcedia Eng.70201417071716
- World Bank Leeds UniversityEstimating relative benefits of differing strategies for management of wastewater in Lower Egypt using quantitative microbial risk Analysis (QMRA)2012http://water.worldbank.org/sites/water.worldbank.org/files/publication/MENA-WPP-Final-Report-Feb-19-2012-FINAL.pdf
- Y.WuJi.ChenInvestigating the effects of point source and nonpoint source pollution on the water quality of the East River (Dongjiang) in South ChinaEcol. Indic.322013294304
- J.H.ZarBiostatistical Analysis3rd ed.1996Prentice HallLondon