
Abstract
The objective of this study is to choose suitable approach for generating quantitative water quality products from Medium-Spectral Resolution Imaging Spectrometer (MERIS) imagery in near real-time. Four MERIS Case-II water processors included in the BEAM software package were studied for estimating the lake water quality. Chlorophyll-a (CHL), Turbidity (TUR) products of the BEAM processors were compared to in situ data. No statistically significant correlations were observed between in situ data and individual top-of-atmosphere (TOA) reflectances. By contrast, significant correlations were observed for the Band9/Band 7 ratio. Using uncorrected band ratios of TOA reflectances as input, coefficients of determination of 0.83 and 0.76 were obtained for TUR and CHL, respectively. The regression models for TUR and CHL were subsequently validated. The formulating regression models based on TOA reflectances is a valid approach to generate Earth Observation (EO) based water quality information in an operational setting. The results revealed that the empirical models estimated for TUR and CHL are more appropriate to generate water quality products from MERIS imagery.
1 Introduction
Egypt's large water bodies are the cornerstone of the country's water resources management strategy. In addition to the Nile River, Egypt's northern lakes are major sources of water for fisheries and aquaculture activities. Water quality concerns arise from the inflow of agricultural drainage water as well as the direct discharge of industrial and domestic wastewaters into the lakes system. Key to the design of adequate water management scenarios is the access to accurate and reliable information on the occurrence and distribution of water quality parameters.
The lake water quality monitoring procedures currently in place rely on the monthly of in situ measurements of drainage channels leading to the lake. These traditional monitoring programs provide essential and accurate results on water monitoring however, they are expensive and insufficient. Furthermore, it does not adequately capture the spatial and temporal variability of water quality parameters in the highly dynamic lake ecosystems.
Remote sensing techniques have been used to assess several water quality parameters such as TUR and CHL. The strength of remote sensing techniques lies in their ability to capture the spatial and temporal variability of water quality parameters in the highly dynamic lake ecosystem that is typically not possible from in situ measurements. The extraction of water constituents from EO data is frequently based on empirical algorithms where water quality variables are estimated from the reflectance at one wavelength or from ratios between reflectance measured at two wavelengths. The empirical approach is simple to apply and has been shown to produce accurate results even in cases of lakes with more than one dominant optically active ingredient (CitationKallio et al., 2005). However, extracting quantitative TUR and CHL information relies on the availability of in situ measurements collected concurrently with the acquisition of satellite imagery.
Several algorithms that use reflectance in the red and near infrared (NIR) regions have been developed and shown to yield accurate estimates of Chlorophyll-a concentration in turbid productive estuarine and coastal waters (CitationLe et al., 2009; CitationYang et al., 2010; CitationGitelson et al., 2011; CitationGurlin et al., 2011). It has also been estimated with the blue/green reflectance ratio in the case of oceans (CitationO’Reilly et al., 1998) and with NIR/red ratio (CitationGitelson et al., 2000) in lakes. CitationBostater et al. (2009) found low relative errors in turbidity retrieval at 681 nm (less than 35%) provided no significant fluorescence affects this range. CitationRim et al. (2013) mapped total suspended matter (TSM) data from the Moderate Resolution Imaging Spectroradiometer (MODIS) images using a semi-empirical algorithm at band 667 nm and obtained a correlation coefficient of 68.9%. MERIS is an instrument aboard the Environmental Satellite (Envisat), its objective is, among others, remote sensing of water quality. CitationMoses et al. (2009, Citation2012) demonstrated that MERIS band 2 and 3 algorithms can yield accurate estimates of Chl-a concentration in the Azov Sea. CitationHärmä et al. (2001) revealed that MERIS band 9 centered at 705 nm is proven to be of vital importance for the detection of chlorophyll a in the surface waters of Finland. The objective of this study is to choose the most suitable approach to generate quantitative water quality products from MERIS imagery in near real-time.
2 Materials and methods
2.1 Description of Lake Manzalah
Lake Manzalah is located in the northeastern edge of the Nile Delta, separated from the Mediterranean Sea by a sandy beach ridge. It is bordered by the Mediterranean Sea in the north, the Suez Canal in the east and Damietta Branch in the West. It extends between Latitude 31.03°N and 31.53°N, Longitude 31.84°E and 32.31°E ().
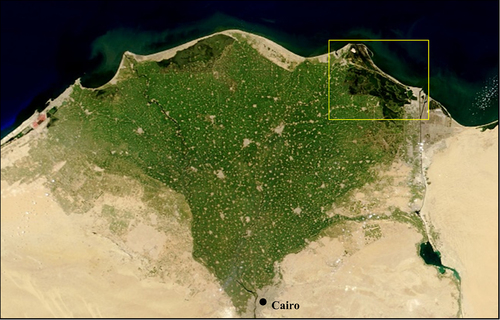
The lake is rectangular in shape, about 60 km in length and 40 km in width with an average depth of 1.3 m. At the beginning of the 20th century the lake covered an area of 1698 km2 and contained approximately 1000 islands of varying sizes. Recently, the lake has experienced a sharp decline in water quality due to the inflow of contaminated runoff from agricultural areas, pollutants from domestic and industrial sources, overgrowth of water hyacinths and loss of area due to land reclamation. In 1970 the area of the lake was cited by CitationEl-Wakeel and Wahby (1970) to be 1275 km2 by 1988 the area was reduced to 770 km2 due to land reclamation projects (CitationUNDP, 1997). Lake Manzalah is linked to the sea by El Gamil channel in the north-east. In the southern section several channels contribute to pollution by feeding the lake with drainage water. The Port Said/Damietta road is associated with ongoing land reclamation activity. Most of the north-western section of the lake has either been reclaimed or converted to fish ponds. The least disturbed area of the lake is to the southwest, this area do not show signs of water pollution or large areas of aquatic plants (CitationRamdani et al., 2008).
2.2 In situ data
The in situ data was collected via a network of real-time water quality (RTWQ) stations. In the RTWQ monitoring process the water quality data in real-time is collected using an automated water quality probe and the data stored in a data logger and transferred using a cellular GSM modem. This allows the user to use a laptop to make direct phone calls to retrieve the water quality data stored in it on demand. This method works where ever there is a cellular GSM network coverage. This communication scheme is called near real-time rather than real-time as the data is not communicated instantly but rather collected and communicated at frequent intervals.
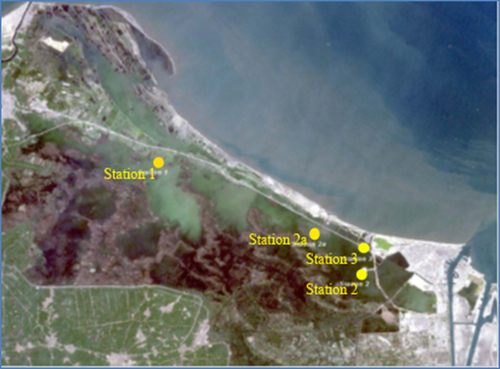
Initially, the locations for Station 1, 2 and 3 were chosen as shown in . However, Station 2 malfunctions continuously due to domestic problems, so the station was moved to a new location (Station 2a). Each station represents its surrounding area. The selection of the station location was validated via site measurements using a portable Hydrolab. These measurements were undertaken in transects around the stations.
The combined data set of in situ and satellite observations consists of 75 data points acquired between July 29 and October 25, 2009. RTWQ stations require regular calibration because some sensors are more susceptible to environmental variation than others, especially turbidity. Since regular calibration information was not available for all stations, there was a risk that data from some sensors was affected by lack of calibration. A data screening process was performed based on the data series collected from each RTWQ station.
2.3 Satellite data and software
MERIS is a programmable, medium-spectral resolution, imaging spectrometer operating in the solar reflective spectral range. MERIS include fifteen spectral bands from 412.5 nm to 900 nm spectral range at 300 m resolution. MERIS imagery analysis and results presented in this paper are based on data collected through the period July to October 2009.
MERIS images were visualized and analyzed using Basic ENVISAT Toolbox for (A)ATSR and MERIS (BEAM) software version 4.2 and processed complementary using plug-in processors. BEAM is an open-source toolbox and development platform for viewing, analyzing and processing of remote sensing raster data. It was originally developed to facilitate the utilization of image data from Envisat's optical instruments but now supports a growing number of other raster data formats such as GeoTIFF as well as data formats of other EO sensors such as MODIS, AVHRR and AVNIR.
Within the BEAM software algorithms developed for processing MERIS images included for waters far from land and for open oceans (Case 1 Waters) and for coastal and lake waters (Case 2 Waters). In (Case 1 Waters) the only variation of water quality is caused by the phytoplankton, thus resulting in relatively simple algorithms for EO data processing. In the optically complex (Case 2 Waters) there are suspended solids, dissolved matters, and other factors complicating the detection.
The Case 2 processors included Regional (C2R), Boreal Lakes Eutrophic Lakes (CitationDoerffer and Schiller, 2006, Citation2008), and WeW/FUB (CitationSchroeder, 2005). These neural network based processors use the best available water bio-optical and atmospheric radiative transfer models for simulation, and they are validated against their respective sets of validation data. The “Boreal” processor has been trained with IOP data collected from lakes in Finland. The training ranges have been set up the lakes in the boreal region in mind (e.g. the absorption by CDOM can be high). The “Eutrophic” processor has been trained with data collected from Spanish lakes which are typically optically dominated by Chlorophyll-a where the concentration can be high. Consequently, the Chlorophyll-a range is large in this processor. The “C2R” processor has been trained with coastal data collected from cruises in the North Sea, Baltic Sea, Mediterranean Sea and North Atlantic.
2.4 Data pre-processing
Images quality was visually screened for atmospheric effects (i.e. clouds, dust) and downloaded if found suitable. Subsets of the downloaded images were generated using BEAM. The subsets included the area of interest as well as a buffer of about 30 km around the area of interest.
These subsets were corrected for the adjacency effect. This effect occurs when photons are reflected and scattered toward the field of view of the sensor and where substantial contrast exists between the water surface and its surrounding. It happens because land areas have a higher reflectance than inland waters, especially in the NIR region of the spectrum. Even the darker land areas are usually much brighter than water. This effect causes an increase of the radiances measure over water and in the vicinity of vegetated coasts, especially in the near infrared (NIR) bands (CitationPedrero, 2009).
The Improved Contrast between Land and Ocean (ICOL) processor was used to correct this effect. This processor is developed in BEAM and use MERIS L1b product as input and the output file with corrected radiances. ICOL processing is available in all BEAM versions of 4.6.1 onward.
2.5 Data processing
The ICOL processed subsets were then subjected to the following water quality processors available in BEAM: MERIS Case-2 Regional Processor (version 1.3.2), MERIS Boreal Lakes Processor (version 1.0.2), and MERIS Eutrophic Lakes Processor (version 1.0.2).
The output products from BEAM water processors were projected to the Egyptian national grid (red zone) using BEAM. The accuracy and quality of the projection were verified via orthorectified LANDSAT image. Precision geocoding was carried out using ERDAS software. For each geocorrected water processor product, the image values of each channel were extracted for each in situ station.
All processors also produce what is called flags whose value shows information obtained during the processing. A non-zero value for a pixel indicates that something was wrong during processing that particular pixel. They were used to exclude poor quality pixels from comparison and analyses. In the processors studied, there exist two versions of flag products: l1 flags and l2 flags. While the Level 1 flags come with MERIS data, the Level 2 flags are made by the processors.
Correlation analysis was used to investigate the relationship between primary water quality parameters (TUR and CHL) and MERIS image variables. The analysis was carried out on original and log-transformed variables. The coincident dataset of in situ and satellite measurements was divided at randomly into a training sample (approx. 70% of cases) and a test sample (approx. 30% of cases).
Regression analysis was used to formulate relationships between image variables and water quality parameters, whereby only the training sample was used in defining the model. The test sample was used to estimate the error of the model.
For each model, the goodness of fit was evaluated by calculating the coefficient of determination and estimates the proportion of variance. In addition, root mean-square error (RMSE) values were calculated using the test sample. The RMSE can be interpreted as the standard deviation of residuals and used to designate quantitative error bounds around estimated values (i.e. estimated value ± RMSE).
3 Results
3.1 In situ water quality parameters
The variability of TUR and CHL values across the different in situ stations are presented in . The distribution of water quality parameters suggests the presence of different water quality regimes across the lake. Station 2 shows higher TUR values than the other locations, although even higher extreme values are observed at Station 2a. The distribution of CHL is relatively similar across Stations 2, 2a and 3, while the lowest median and smallest ranges occur at Station 1. A summary of descriptive statistics of TUR and CHL across all stations is presented in .
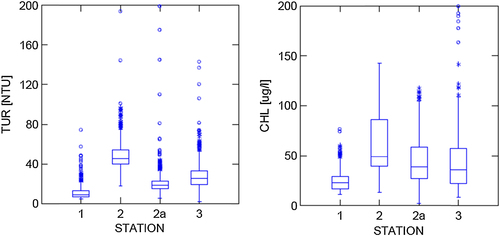
Table 1 Descriptive statistics of in situ water quality parameters.
3.2 Performance of the lake water quality processors
When considering all valid pixels regardless of quality flags, the investigation of output from MERIS Lake water quality processors (i.e. Boreal, Eutrophic and Case 2 Regional processors) yielded no significant correlation between any image variable (incl. single bands, band ratios and output products) and in situ measurements of water quality. Of all processors examined, only the WeW/FUB water-leaving reflectances showed statistically significant relationships with RTWQ measurements. However, in many cases the water-leaving reflectances were negative, and in some cases the correlation was dominated by single extreme values. Correlation coefficients (α = 0.05) for FUB output is presented in .
Table 2 Correlation between water quality parameters and WeW/FUB output.
By investigating at the quality flags generated by Boreal, Eutrophic and Case 2 Regional (C2R) and WeW/FEB processors, it was revealed that all valid pixels of Lake Manzalah are labeled as suspect (i.e. Level 1 flag of at least 7) by all three processors, indicating in the majority of cases the possibility of mixed pixels. In a small number of cases, the Boreal and C2R processors show a Level 2 quality flag of zero (i.e. no quality restrictions). The Eutrophic processor generates a Level 2 quality flag of at least 1024 (i.e. the concentration of a water quality parameter is out of training range) for all pixels The WeW/FUB processor generates Level 2 quality flags for all pixels indicating the failure of chlorophyll and yellow substance retrieval. shows the correlation between in situ water quality parameters and processor output obtained for Level 2 flags of zero (i.e. for the Boreal and C2R processors) and 1024 (i.e. for the Eutrophic processor), respectively. Correlation coefficients statistically significant at α = 0.05 are highlighted.
Table 3 Correlation between water quality parameters and processor output.
All correlations between in situ TUR and TSM were negative, indicating the processors were not able to reproduce physically meaningful suspended matter concentration for Lake Manzalah. These results indicate that the water quality regime at Lake Manzalah is very different from the ones the processors had been developed for. Therefore, the existing processors cannot be used to generate water quality products within an operational context.
By contrast, the correlation between in situ and processor-derived chlorophyll concentration were high with correlation coefficients ranging from 0.88 to 0.94. In case of the Boreal, C2R and Eutrophic processors, the observed correlations were statistically significant. Therefore, the extraction of chlorophyll concentrations from the processors at Lake Manzalah appears viable. While the application of these models at Lake Manzalah currently reaches its limitations with MERIS imagery, it is likely that the impact of mixed pixels will be minimized with imagery collected at a higher spatial resolution.
3.3 Empirical modeling
No statistically significant correlations were observed between in situ data and individual top-of-atmosphere (TOA) reflectances. By contrast, significant correlations were observed for the Band9/Band 7 ratio. The resulting correlation coefficients are presented in . Linear regression models for TUR and CHL are presented in .
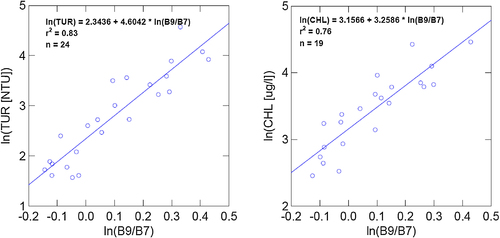
Table 4 Correlation between water quality parameters and TOA band ratios.
Using uncorrected band ratios of TOA reflectances as input, coefficients of determination of 0.83 and 0.76 were obtained for TUR and CHL respectively. The regression models for TUR and CHL were subsequently applied to the training dataset for validation. Although the validation sample was limited in size, the observed errors for TUR (10.75 NTU) and CHL (9.50 μg/l) were of similar order, and in fact slightly smaller than the natural variability observed in the sample of the entire series of observations in . This suggests that formulating regression models based on TOA reflectances is a valid approach to generate EO-based water quality information in an operational setting.
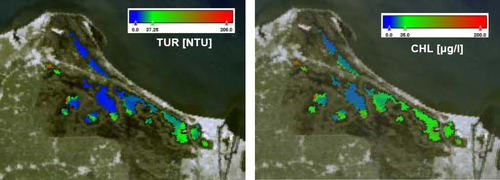
shows an example of final products generated using the regression models. It is important to note that the performance of regression models depends on the degree to which the natural variability in water quality parameters were captured in the samples used for training and testing. Moreover, regression-based models are inherently interpolation techniques that are not suitable for extrapolation beyond the value range captured in the training data. Therefore, the empirical models for TUR and CHL can be used to generate water quality products only from imagery collected between July 29 and October 25, 2009. It is expected that empirical models will become better by increasing the volume of coincident in situ and satellite measurements. Similarly, larger data volumes will allow the formulation of specific models for areas within the same lake system that are characterized by different water quality regimes.
4 Conclusion
The results of this investigation suggests that formulating regression models based on TOA reflectances is a valid approach to generate EO-based water quality information in an operational setting. It also revealed that the empirical models estimated for TUR and CHL are more appropriate to generate water quality products from MERIS imagery. It confirms the viability of linking RTWQ, EO and communications technologies to generate value-added information for operational water quality monitoring and integrated water resources management. The empirical modeling approach, in particular, is promising due to the relative ease of algorithm development and adaptation. Significant improvements are expected when using larger data volumes of in-situ and corresponding EO data to develop individual models for different areas of a lake system that are characterized by different water quality regimes.
Conflict of interest
None declared.
Notes
Peer review under responsibility of National Water Research Center.

References
- C.R.BostaterS.P.MertikasX.NeytSPIE Proceedings, Remote Sensing of the Ocean, Sea Ice, and Large Water Regions 2009, vol. 74732009
- R.DoerfferH.SchillerMERIS Advanced Water Algorithm Version 1.12006GKSS
- R.DoerfferH.SchillerAlgorithm Theoretical Basis Document (ATBD): MERIS Regional Coastal and LakeCase 2 Water Project Atmospheric Correction ATBD2008GKSSGeesthacht, Germany
- S.K.El-WakeelS.D.WahbyHydrography and chemistry of Lake Manzalah, EgyptArch. Hydrobiol.6721970173200
- A.GitelsonD.GurlinW.MosesY.YacobiRemote estimation of chlorophyll a concentration in inland, estuarine, and coastal waters, Chapter 18Q.WengAdvances in Environmental Remote Sensing: Sensors, Algorithms, and Applications (pp. 449–478)2011CRC Press, Taylor and Francis Group610 ISBN: 9781420091755
- A.A.GitelsonY.Z.YacobiJ.F.SchallesD.C.RunquistL.HanR.StarkD.EtzionRemote estimation of phytoplankton density in productive watersArch. Hydrobiol. — Adv. Limnol.552000121136
- D.GurlinA.A.GitelsonW.J.MosesRemote estimation of chl-a concentration in turbid productive waters — return to a simple two-band NIR-red model?Remote Sens. Environ.11512201134793490
- P.HärmäJ.VepsäläinenT.HannonenT.PyhälahtiJ.KämäriK.KallioK.EloheimoS.KoponenDetection of water quality using simulated satellite data and semi-empirical algorithms in FinlandSci. Total Environ.2681–32001107121
- K.KallioJ.PulliainenP.YlostaloMERIS, MODIS and ETM+ channel configurations in the estimation of lake water quality from subsurface reflectance using semi-analytical and empirical algorithmsGeophysica411–220053155
- C.LeY.LiY.ZhaD.SunC.HuangH.LuA four-band semi-analytical model for estimating chlorophyll a in highly turbid lakes: the case of Taihu Lake, ChinaRemote Sens. Environ.1136200911751182
- W.J.MosesJ.H.BowlesR.L.LuckeM.R.CorsonImpact of signal-to-noise ratio in a hyperspectral sensor on the accuracy of biophysical parameter estimation in case II watersOptics Expr.204201243094330
- W.MosesA.GitelsonS.BerdnikovV.PovazhnyySatellite estimation of chlorophyll-a concentration using the red and NIR bands of MERIS — the Azov Sea case studyIEEE Geosci. Remote Sens. Lett.462009845849
- J.E.O’ReillyS.MaritorenaG.MitchellD.SiegelK.CarderS.GarverM.KahruC.McclainOcean color chlorophyll algorithm for SeaWiFSJ. Geophys. Res.10319982493724953
- J.A.PedreroEvaluation of MERIS Case-II Water Processors in the Baltic Sea, Final Project2009Department of Radio Science and Engineering, Communications and Automation, Faculty of Electronics, Helsinki University of Technology
- M.RamdaniR.J.FlowerN.ElkhiatiM.M.KraïemA.A.FathiH.H.BirksA.ElmetwalliRemote Sensing as a Precision Farming Tool in the Nile Valley, Egypt2008University of StirlingUnited Kingdom PhD Dissertation
- K.RimB.NechadK.RuddickF.ZargouniOptical remote sensing of turbidity and total suspended matter in the Gulf of GabesArab. J. Geosci.65201315271535
- T.SchroederFernerkundung von Wasserinhaltsstoffen in kuestengeweassern Meris unter Anwendung expliziter und impliziter Atmosphaerenkorrekturverfahren2005Freie universitatetBerlin (Germany)2005 Ph.D. Dissertation
- UNDP, 1997. Project Document – Lake Manzala Engineered Wetland, United Nations Development Program, Project Number: EGY/93/G31, March 1997.
- W.YangB.MatsushitaJ.ChenT.FukushimaR.MaAn enhanced three band index for estimating chlorophyll-a in turbid case-II waters: case studies of Lake Kasumigaura, Japan, and Lake Dianchi, ChinaIEEE Geosci. Remote Sens. Lett.742010655659