
 ?Mathematical formulae have been encoded as MathML and are displayed in this HTML version using MathJax in order to improve their display. Uncheck the box to turn MathJax off. This feature requires Javascript. Click on a formula to zoom.
Abstract
Coastal zone of Egypt Nile Delta is exposed to an extensive changes due to natural and artificial influences. These changes have induced erosion problems along coastlines of Nile Delta. Near or foreshore replenishment is an alternative approach in many areas instead of hard structures to avoid negative impact of coastal structures. The frequent maintenance dredging works of ports approach channels could be considered as possible sources of sand, which may be used to address sediment budget and to help overcome coastal erosion at key strategic locations. Two-dimension morphological numerical model (2DH) was developed using Delft3D to study and predict the effect of using dredged sediment from the approach channel on minimizing the retreat of shoreline at the area subjected to erosion. The morphological simulation runs included 8 model scenarios to test the effect of dumping the dredged materials at various locations with different quantities. Analysis of model results were carried out to assess the optimum location and quantities of the nourishment using the dredged materials. The results showed that, the directly placement of dredged materials at shoreline was found to be the most effective choice enhancing the stability of the shoreline. The applications through the current case study could help and guide for integrated management processes and practice.
1 Introduction
The coastal erosion causes extensive flooding of sea with negative impact on the local economies of the region represented by the loss of land, coastal tourism, industrial development and fishing practices. In addition to ecological impact which threatens marine animals. Coastal management dealing with erosion problems and long term coastline stability basically relies on the balance between rate of sediment supply and transport. Along the coastline of Nile Delta, sediment transport by waves have significant effects on the morphological changes of the Mediterranean coast of Egypt. Rosetta and Damietta branches are the two main branches connecting main River Nile stream to the Mediterranean Sea, these two branches are the conveyors not only with the fresh water to Nile Delta but also sediment loads to nourish the coastline. After completion of Aswan high dam (AHD) in 1968, amounts of sediment had been settled upstream AHD and there is no longer sufficient sediment supply to nourish the Nile Delta coastline and prevent coastal erosion (CitationLotfy and Frihy, 1993; CitationStanley, 1996). Shortage in sediment supply resulting loss of several beaches and blockage navigation channels by sediment, as well as flooding of coastal villages (CitationHerbich et al., 1998). Many researchers at different times studied coastal processes and erosion occurs along the Nile Delta coastlines (CitationFanos, 1995; CitationFrihy et al., 1991; CitationFrihy and Komar, 1993; CitationSogreah, 1982; CitationEldeberky, 2011). The sea level rise is one of the factors that threaten the retreat of the Egyptian Mediterranean coast. CitationHereher (2015) classified the Nile Delta coast as a highly vulnerable area under the threat of sea-level rise.
Protection and development measurements including construction of coastal protection structures like detached breakwaters and seawalls had been attained (CitationDewidar and Frihy, 2007). These coastal hard structures projects have managed to adjust erosion fronting them, but on the other hand they caused lack of sediment supply in areas further away, causing retreating of coastline. Beach nourishment is considered the only soft shore protection methods that is widely applied for coastal safety, beach widening and provide the benefits claimed by the coastal engineering community (CitationCastelle et al., 2009; CitationLuo et al., 2015; CitationRoberts and Wang, 2012). The nourishment projects started in the US (Coney Island) in 1923 then expanding eventually to Europe until the early 80s (CitationHansona et al., 2002). The early of 90s beach nourishment project started to be applied for practice in china (CitationCai et al., 2010). CitationKarambas and Samaras (2014) evaluated the beach nourishment by comparing the results of an advanced wave and sediment transport numerical model with experimental data of cross-shore profiles and morphology evolution. A shoreface nourishment (underwater nourishment) acts as a submerged structure such as soft reef berm or submerged, hard-rock breakwater which have an effect to reduce wave height in the nearshore zone at the lee side (Citationvan Duin et al., 2004). The performance of beach nourishment needs more understanding through predictive models of beach behavior in response to varying hydrodynamic forces and adequate pre- and post-emplacement monitoring to allow for objective project assessment and necessary adjustment of designs (CitationDavison et al., 1992).
The approach channels of ports suffer from continuous sedimentation problems which makes a frequently maintenance dredging program is necessary to overcome such problem. Most of dredged spoil materials is dumping in the offshore direction far from the site of source to ensure that sediment will not return to the approach channel. Moreover this method is costly, a monitoring program and management process of dredged material disposal sites should be design by the decision-making authorities (CitationOSPAR, 2009).
Since the disposal sediments from maintenance dredge works are similar to the natural sediments, approach channels of ports are seen as possible sources that may be used to address sediment budget and help combat coastal erosion problems at key strategic locations.
In Egypt, Damietta port navigation channel could be used as a source of sediment budget where, the amount of siltation in Damietta port navigation channel is about 1 million cubic meter annually. The current research is part of the project of adaptation to climate change in the Nile Delta through Integrated Coastal Zone Management, (Ivica Trumbić, Consultant-June 2013).
2 Study area
Coastal strip from the mouth of the River Nile of Damietta branch and Port-Said is suffering from erosion with different rates. Most erosion is encountered close to the River Nile mouth and decrease eastward (CitationEl-Asmar and Hereher, 2011). The maximum erosion rate with landward shoreline displacement occurred at 7.8 km east of Damietta promontory mouth. Izbat-Alburj city is located at the end of the Nile River, north of Damietta city, about 15 km on the eastern bank of Damietta branch of the Nile River at its mouth to the Mediterranean Sea. Recently, the Shore Protection Authority (SPA) had built a new seawall revetment with length about 7 km from the river mouth to the eastern direction. At the end of seawall revetment in the eastern side of Izbat-Alburj, the erosion rate had rapidly increased during the period 2003–2012 as shown in the satellite images in a and b where, old coastal highway connecting Damietta and Port-Said cities affected by erosion.

3 Objectives
The main objective of the present research is to demonstrate the feasibility of using dredged sediment from the approach channel of Damietta Port to the retreated shoreline as a friendly and sustainable nourishment method to overcome erosion problem, which threats the shoreline stability along the Nile Delta coast.
4 Materials and methods
Data collection and analysis was carried out to develop and calibrate the morphological model. Data includes the measurements received from the Coastal Research Institute (CoRI) and Shore Protection Authority (SPA), which includes:
| - | Bed level measurement and cross-shore profiles at years 2010, 2011, and 2012. | ||||
| - | Water level variation recorded from Jun 2012 to Jan 2013. | ||||
| - | Ten years wave data records (from 1996 to 2005) and one-year wave records at 2010. | ||||
| - | Wind data recorded in tabulated form for 5 years (from 2008 to 2012). | ||||
| - | Sediment samples at both onshore and offshore direction. | ||||
Wave climate along the Mediterranean coast of Egypt is seasonal in intensity and direction. The prevailing wave are propagating from the WNW and NW directions, while a small amount of waves are propagating from the NNE and NE directions. The average significant wave height is 0.50–1.00 m, and the average wave period is 7-8 sec (CitationNafaa et al., 1991). Predominant wind direction as measured at Damietta Meteorological station is the “NW” most of the year, as a results the prevailing wave direction incident from north west direction, which creates the long-shore currents eastward-flowing of Damietta promontory (CitationFrihy et al., 2003; CitationFrihy and Dewidar, 2003). Analysis of wave data was carried out based on the long-term wave data (10 years). Wave Rose shows dominant north and northwest directions shown in . shows waves cases used to represent the annual morphological wave climate.
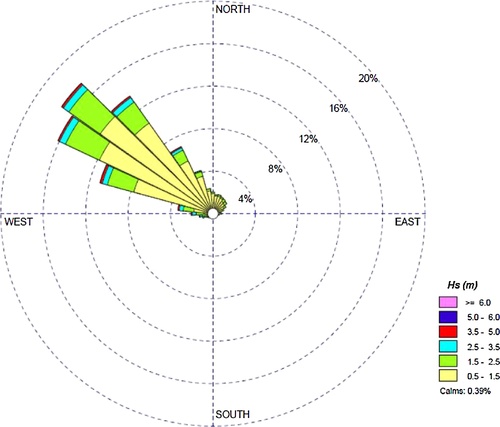
Table 1 Wave climate for morphological simulations.
The induced eastward current represents 89% of the year with 0.41 m/s–0.47 m/s average velocity, however the average velocity of the westward current is varying between 0.33 m/s to 0.36 m/s and represent 11% of the year (CitationEl-Asmar and White, 2002).
The coastline of the Nile delta is typical of micro tidal semidiurnal nature. Recorded daily water level variations were measured from the mean sea level in the study area, the analysis of water level variation revealed about 0.37 m rise in water level in high–high tide and 0.38 drop in water level in low–low tide, with a tidal range of 0.75 m, (CitationFrihy et al., 2002). The beaches of Nile Delta coast consist of loose quartz sand mixed with small amounts of heavy minerals and shell fragments (CitationEl-Asmar and Hereher, 2011). The beach at the Nile Delta coast varies between fine and medium sand (CitationFrihy and Dewidar, 2003). At Izbat-Alburj vicinity, the analysis of bed material samples showed that, the average mean diameter of the bed material at the beach was varying between 0.2 mm to 0.25 mm and between 0.3 mm to 0.35 mm at the offshore direction (Coastal Research Institute, 2013).
In addition, the data related to the quantity of dredged sediment was obtained based on annual maintenance dredging works reported by Damietta Port Authority and the feasibility study that was carried out through (CitationCairo University Report, 2003) for the approach channel of Damietta Port.
To track and predict the changes at sea bed and coastline at area of interest after using the dredged material as a sand nourishment to maintain and eliminate the erosion, the Delft3D numerical model (Deltares) was used as a key tool. A two dimensional hydrodynamic and morphological numerical model (2DH) was developed using Delft3D to simulate and predict the morphological changes in the study area after the placement of dredged material in different locations and different quantities.
5 Numerical model
Delft3D is an integrated, powerful and flexible software, which has been developed by Deltares, The Netherlands. It is mostly used for the modeling of coastal, river and estuarine areas. It is a coupled model which encompasses a number of well-tested and validated modules, which are linked to and integrated with one-another. The model was used to calculate changes due to coastal processes induced by waves, water levels, winds, and currents in a topographic and bathymetric surface. Wave propagation and transformation from deep water in the offshore to the shallow water at nearshore area was simulated using the SWAN wave transformation model (CitationBooij et al., 2004). The wave current interactions were simulated through the coupling process between SWAN and the Delft3D-Flow model, which simulate currents, water levels, and sediment transport.
Sediment transport and morphological updating formulations are added directly into an existing hydrodynamic solver, thereby closely coupling the hydrodynamic, sediment transport, and morphodynamic computations. Sediment transport algorithms, predominantly based on the formulations of CitationVan Rijn (2004), are added to the Delft3DFLOW hydrodynamic solver which is widely used, well tested, and well suited to modelling the three-dimensional hydrodynamics of coastal regions.
5.1 Governing equations
The Delft3D-FLOW module solves the unsteady shallow-water equations in two (depth-averaged) or three dimensions. The system of equations consists of the horizontal momentum equations, the continuity equation, the transport equation, and a turbulence closure model.
In simulations including waves the hydrodynamic equations are written and solved in a GLM (Generalised Lagrangian Mean). In GLM formulation the 2DH and 3D flow equations are very similar to the standard Eulerian equations, however, the wave-induced driving forces averaged over the wave period are more accurately expressed. The relationship between the GLM velocity and the Eulerian velocity is given by:
Where U and V are GLM velocity components, u and v are Eulerian velocity components, and us and vs are the Stokes’ drift components.
Under the so-called ‘shallow water assumption’ the vertical momentum equation reduces to the hydrostatic pressure equation. Under this assumption vertical accelerations due to buoyancy effects or sudden variations in the bottom topography are assumed negligible compared to gravitational acceleration and are not taken into account. The resulting expression is:
The horizontal momentum equations are:
In which the horizontal pressure terms, Px and Py, are given by (Boussinesq approximations)
5.1.1 Continuity equation
The depth-averaged continuity equation is given by
in which S represents the contributions per unit area due to the discharge or withdrawal of water, evaporation, and precipitation.
5.1.2 Transport equation
The advection-diffusion equation reads
5.1.3 Bed-load sediment transport
A sediment transport formulation, developed by CitationVan Rijn (2004), was used to calculate sediment transport patterns and magnitudes. Bed load and suspended load transport were separately computed and bottom changes due to the combined effects of sediment entrainment, deposition and bed load transport gradients were computed every flow time step. The estimated sediment transport from Deft3D-Flow was used to calculate new elevations on the topographic and bathymetric surface. For simulations including waves, the magnitude and direction of the bed-load transport on a horizontal bed are calculated using an approximation method developed by CitationVan Rijn (2004). This method includes an estimate of the effects of wave orbital velocity asymmetry on bed-load sediment transport. The method computes the magnitude of the bed-load transport as
where:
Sb bed load transport [kg/m/s]
M sediment mobility number due to waves and currents [–]
Me excess sediment mobility number [–]
5.2 Model setup and calibration
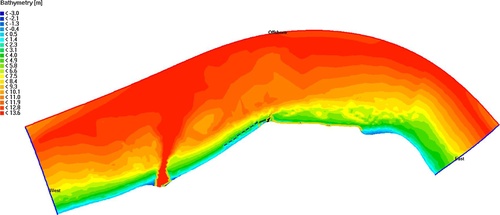
The model was developed to simulate about 35 km long alongshore direction and 5.5 km wide in offshore direction. The topography and bathymetry data used in model setup and model calibration was in years 2010 and 2012 respectively. The bathymetric data was incorporated in the model covering the vicinity of Damietta harbor, the protective detached breakwaters, Dameitta estuary, and reaching 4 km east the seawall revetment at Izbat-Alburj. Coastal structures like breakwaters and other configuration of other structures were schematized based on the land boundary data as shown in . Measurements of water levels were converted to harmonic constituents (tidal amplitudes and phases) by means of tidal analysis. The tidal dynamics in the model subsequently driven by the prescription of tidal water level variations along the model boundaries through these harmonic constituents in the flow module. The Delft-Wave module was setup and online coupling with Delft-Flow module was used to apply the wave current interaction technique in the model.
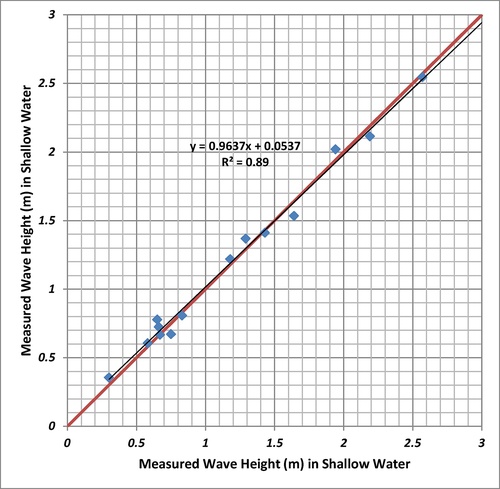
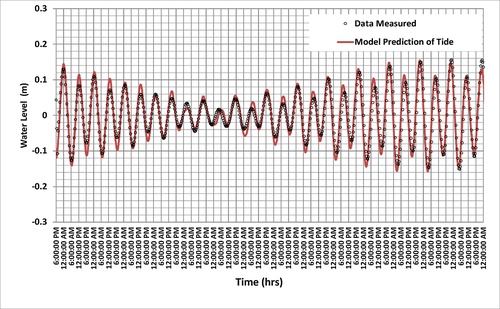
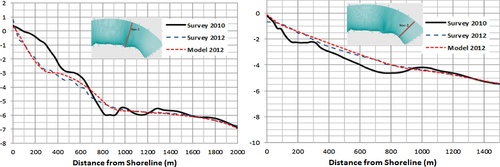
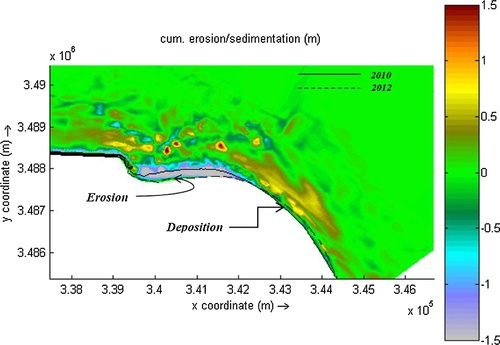
Comparison of model results with (pre-processed) measurement data was carried out through the model calibration to verify that the model adequately represents the water system. Three modules had been calibrated (Wave-module, Flow-module and Morphological-module). Calibration of the wave module means the calibration of the SWAN model, which was carried out through running the model and comparing between nearshore wave measurements and the simulated nearshore waves as shown in . Regression analysis was applied to assess and understand the variation between predicted and observed values. The results of regression analysis showed that R Square is 0.89. This reflect a good agreement between nearshore wave measurements and the simulated nearshore waves with SWAN. The tidal components have been used for water level calibration in Flow-module. In the predicted and observed water levels in tidal cycles are compared. The figure showed that the modelled and observed water levels matches well. Bathymetric survey of year-2010 was used to build the model (initial model bed level) and the year-2012 for the morphological calibration of the model. The Transport formulation for non-cohesive sediment using CitationVan Rijn (2004) was selected for sediment transport calculations. To fulfill a qualitative and quantitative agreement between the predicted and observed bed level changes, tuning of some model parameters was done, which called calibration parameters. Comparison between the observed and predicted see bed level in 2012 at two cross profiles were shown in , this also includes the observed see bed level of year 2010 as a reference for erosion/deposition process. Configuration of the predicted sedimentation and erosion at the area of interest is shown in . The calibration results imply that the model is well-suited to resolve the coastal processes in the study area and can be efficiently used to study the proposed alternatives solution.
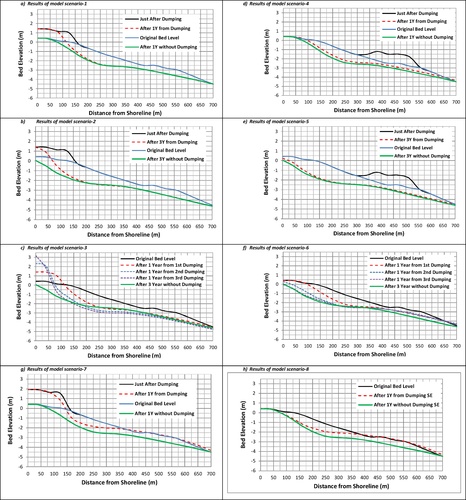
5.3 Model scenarios
The placement location of dredged materials studied to fulfill both technical and economic issues in order to reach the optimum nourishment process for erosion problem. With this regards, eight model scenarios were proposed to assess the effect of dredged material placement with different locations and quantities on erosion process at Izbat-Alburj vicinity. Scenarios 1, 2 and 3 simulate the case of dumping the dredged materials directly on the eroded shoreline of Izbat-Alburj vicinity. Dimensions of the dumped area was 3000 m length parallel to the shoreline, 167 m width perpendicular to the shoreline, and 1 m depth above the original bed level. Where, Scenario-1 study the effect of dumping 500,000 m3 after one year simulation, Scenario-2 study the effect of dumping 500,000 m3 after three years simulation and Scenario-3 study the effect of continuous dumping of 500,000 m3/year after three years simulation. Scenarios 4–6 are the same as the previous scenarios, except that the location of dumping the dredged material was shifted toward the sea at contour (−3.00) m offshore.
Scenario-7 simulates the bed changes after one year of dumping 750,000 m3 of the dredged materials directly on the shoreline at eroded area of Izbat-Alburj vicinity. Scenario-8 was proposed to act as a sand engine technique that could be used to feed the eroded area with sand where, 800,000 m3 of dredged materials dumped to the shoreline closed to the end of seawall (updraft the eroded area of Izbat-Alburj) and the total simulation time was one year. shows summary of model scenarios. The locations of dumping area of dredged material are schematized as shown in .
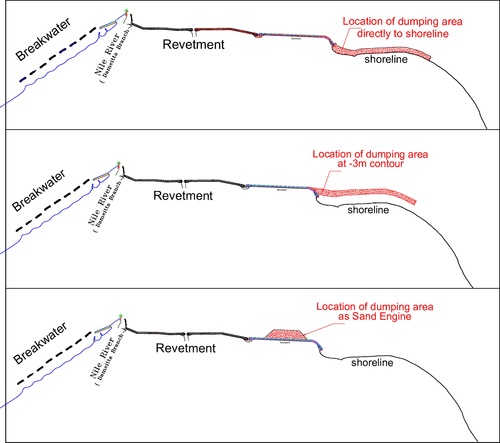
Table 2 Summary of model scenarios.
6 Results and discussion
The analysis of the model results was carried out for each model scenario in which, cross shore profile was selected to show the changes in the sea bed level at the vicinity of the placement of dredged materials and its surrounding area with different model scenarios.
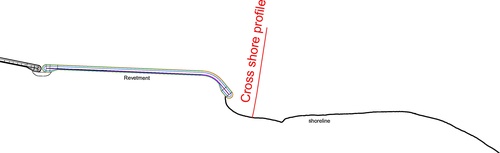
To evaluate the efficiency of each model scenario, comparisons between the model results with and without the placement of dredged materials were carried out along the selected cross shore profile as shown in . The location of the cross shore profile was selected in the area which has an extensive and continuous erosion to examine the impact of different scenario.
The results of all model scenarios (from 1 to 8) are shown in which revealed that, the effect dumping the dredged material directly at the shoreline after one year (scenario 1) increased the width of the beach on front of the study area with about 75 m as shown in (a). This acquired width of beach will be decreased after 3 years (scenario 2) to be 50 as shown in (b). By continuously dumping processes each one year (scenario 3) the final acquired width of beach will be 75 m after 3 years but the elevation of beach land will be increased and the beach slope as well as shown in (c). Simulations of model scenarios 4, 5 showed insignificant effect of dumping the dredged material at contour depth −3 m on the shoreline stability as presented in (d) and (e). However, in scenario 6 the effect of continuously dumping each one year will keep the shoreline stable but without any acquired lands to the beach, (f). Increasing the quantities of the dumped material at the shoreline as in scenario 7 will increase the stability of the shoreline at the vicinity of the dumping area. (g). The technique of sand engine that was simulated in model scenario 8 showed insignificant impact on stopping erosion at the vicinity of Izbat-Alburj (downdraft of seawall) which is considered the highly eroded area, (h).
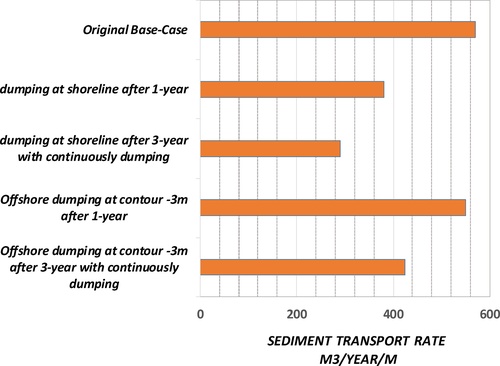
The transport rate of sediment was calculated with a comparative analysis between different model scenarios and the original situation to be used as base case for comparison. The aim of this comparative analysis is to assess the effect of proposed alternatives of dredged material placement on the quantity movement of sediment at the study area, and used as an indicator to decision makers. From the analysis of model results, the sediment transport rate was about 570 m3/year/m in the original case. This transport rate was decreased to 380 m3/year/m in case of placement of sediment directly on the shoreline after the first year of simulation as in scenario-1, by increasing the dumping rate of sediment to be yearly as in scenario-3 the rate of sediment transport was decreased to 290 m3/year/m after three years model simulation.
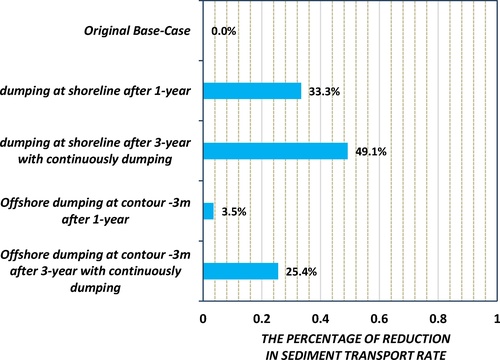
While, the model results for the scenarios of placement dredged material toward the sea at contour (−3.00) m offshore as in scenarios 4–6 showed less effect on reducing the transported rate of sediment in the highly eroded area of Izbat-Alburj. Since, the sediment transport rate was about 550 m3/year/m after the first year of simulation and 425 m3/year/m after three years model simulation with continuously yearly dumping rate of sediment. shows an overview of sediment transport rates after dumping dredged materials directly onshore and after dumping dredged materials toward the sea at contour (−3.00) m offshore compared with the original base case. The percentages of reduction to the transport rate of sediment were calculated and illustrated in for all model scenarios. From the figure it was clear that, the placement of sediment directly on the shoreline reduce the sediment transport rate by 25% after the first year, and this percentage of reduction will be increased to about 49% after three years of continuous placement of dredged material. On the other hand, the placement of dredged material toward the sea at contour (−3.00) m offshore direction will not achieve significant reduction to the transported rate of sediment.
7 Conclusions
The placement of dredged materials directly at shoreline gives better results than dumping at contour depth of (−3.00 m). Moreover, increasing dumping rate or increasing the quantity of dredged materials placed at shoreline will reduce the sediment transport rate, which means increase the time needed for bed material movements, and as a results achieve more shoreline stability. The results of dumping almost the quantities of dredged materials updraft the eroded area of Izbat-Alburj (scenario of sand-engine) has a small effect in reducing the erosion problem or rehabilitating shoreline at the vicinity of Izbat-Alburj comparing with the directly placement of dredged materials at the shoreline facing Izbat-Alburj vicinity. While, improving the results of using sand-engine method need more investigation.
Notes
Peer review under responsibility of National Water Research Center.
References
- N.BooijI.J.G.HaagsmaL.H.HolthuijsenA.T.M.M.KieftenburgR.C.RisA.J.van der WesthuysenM.ZijlemaSWAN, User Manual, SWAN Cycle III Version 40.412004Delft University of TechnologyDelft, The Netherlands
- F.CaiR.G.DeanJ.H.LiuBeach nourishment in China: status and prospectsProceeding of the International Conference on Coastal EngineeringNorth America2010
- Cairo University ReportSedimentation problem of Damietta navigation channelFeasibility Study2003Damietta Port Authority
- B.CastelleI.L.TurnerX.BertinR.TomlinsonBeach nourishments at Coolangatta Bay over the period 1987–2005: impacts and lessonsCoast. Eng.5692009940995
- ToddDavisonRobert A.J.NichollsStephen P.LeathermanBeach nourishment as a coastal management tool: an annotated bibliography on developments associated with the artificial nourishment of beachesJ. Coast. Res.8Autumn (4)1992129136
- K.DewidarO.E.FrihyPre- and post-beach response to engineering hard structures using Landsat time-series at the northwestern part of the Nile Delta, EgyptJ. Coast. Conserv.1122007133142
- H.M.El-AsmarM.E.HereherChange detection of the coastal zone east of the Nile Delta using remote sensingEnviron. Earth Sci. J.6242011769777
- H.M.El-AsmarW.WhiteChanges in coastal sediment transport processes due to construction of New Damietta Harbour, Nile Delta, EgyptCoast. Eng.462002127138
- Y.EldeberkyCoastal adaptation to sea level rise along the Nile Delta, EgyptWIT Trans. Ecol. Environ.1492011 ISSN 1743-3541 (on-line)http://arxiv:/www.witpress.com
- A.M.FanosThe impact of human activities on the erosion and accretion of the Nile Delta coastJ. Coast. Res.111995821833
- O.E.FrihyK.M.DewidarPatterns of erosion/sedimentation, heavy mineral concentration and grain size to interpret boundaries of littoral sub-cells of the Nile DeltaMar. Geol.19920032743
- O.E.FrihyP.D.KomarLong-term shoreline changes and concentration of heavy minerals in beach sands of the Nile Delta, EgyptMar. Geol.1151993253261
- O.E.FrihyA.M.FanosA.KhafagyP.D.KomarPatterns of nearshore sediment transport along the Nile Delta, EgyptCoast. Eng.151991409429
- O.E.FrihyA.A.HadrM.S.HassanSedimentation processes at the navigation channel of the Damietta Harbour on the northeastern Nile Delta coast of EgyptJ. Coast. Res.2002459469
- O.FrihyA.E.DebesW.R.El SayedProcesses reshaping the Nile Delta promontories of Egypt: pre- and post-protectionGeomorphology532003263279
- H.HansonaA.BramptonM.CapobiancoH.H.DetteL.HammC.LaustrupA.LechugaR.SpanhoffBeach nourishment projects, practices, and objectives—a European overviewCoast. Eng.472002200281111
- J.HerbichA.ElfikyG.ElsaeedThe morphological changes along the northern coast of the Nile DeltaCopenhagen, Denmark, June, 1998The Twenty-Six International Conference on Coastal Engineering ICCE 98Vol. 2199822642268
- M.E.HereherCoastal vulnerability assessment for Egypt’s Mediterranean coastGeomat. Nat. Hazards Risk642015342355 ISSN: 1947-5705
- Theofanis V.KarambasAchilleas G.SamarasSoft shore protection methods: the use of advanced numerical models in the evaluation of beach nourishmentOcean Eng.9220142014129136
- M.LotfyO.E.FrihySediment balance in the nearshore zone of the Nile Delta coast, EgyptJ. Coast. Res.91993654662
- S.LuoF.CaiH.LiuG.LeiH.QiX.SuAdaptive measures adopted for risk reduction of coastal erosion in the People’s Republic of ChinaOcean Coast. Manag.1032015134145
- M.G.NafaaA.M.FanosM.A.ElganainyCharacteristics of waves off the Mediterranean coast of EgyptJ. Coast. Res.71991665676
- OSPAR Commission, Ref.-No. 2009–4. Revised OSPAR Guidelines 2004–8 for the Management of Dredged Material.
- T.M.RobertsP.WangFour-year performance and associated controlling factors of several beach nourishment projects along three adjacent barrier islands, West-Central Florida, USACoast. Eng.7020122139
- Sogreah, M., 1982. Effects on the construction of the Port of Damietta on the evolution of the littoral drift. Consultancy Report, number 35/1202/R9, 35 pp.
- D.J.StanleyNile Delta: extreme case of sediment entrapment on a delta plain and consequent local land lossMar. Geol.1291996189195
- L.C.Van RijnPrinciples of Sedimentation and Erosion Engineering in Rivers, Estuaries and Coastal Seas2004Aqua PublicationsAmsterdam, The Netherlands
- M.J.P.van DuinN.R.WiersmaD.J.R.WalstraL.C.van RijnM.J.F.StiveNourishing the shoreface: observations and hindcasting of the Egmond case, The NetherlandsCoast. Eng.50August (3)2004813837
Further reading
- Hesham M. El-Asmar, Short term coastal changes along Damietta-Port Said coast northeast of the Nile Delta, Egypt J. Coast. Res. 18 Summer (3) 2002; 433-441 2002