
Abstract
Storm water detention ponds are usually designed to store-and-release the runoff of extreme rainfall events based on a selected return period, e.g., 100 years. The design storm is typically a recorded historical event or one that is extracted from historical intensity–duration–frequency (IDF) curves. In essence, the selected storm and the resulting design are deterministic. In this research, the inevitable natural weather variability and its impact on the uncertainty of extreme events are simulated and quantified. This study builds on the results of a previous study where a stochastic weather generator, LARS-WG, was used to generate an ensemble of series with a 30-year length of hourly rainfall in the city of Saskatoon, Canada, based on the statistical properties of historical rainfall. Here, the most critical day (24-h rainfall) of each of the series is identified as a possible realization of the design storm. The runoff of each realization of the storm events is routed to a storm water pond in Saskatoon using the XPSWMM model. The critical runoff volume collected in the pond throughout the 24-h duration is also identified. Empirical probability distributions are fitted to the critical values of runoff volumes collected in the pond and compared with the current design storage. Exceedance probabilities and expected flood risk are estimated from the probability distributions for the baseline period (1960–1990), as well as under three projected future (2014–2100) scenarios of climate change (RCP 2.6, 4.5, and 8.5). Along with the magnitude of expected risk, this method provides the probability of the infrastructure’s failure due to uncertainty. The proposed risk-based approach presented in this study provides a way for municipalities to quantify the risk associated with their selected design values and for tangible and meaningful interpretation of the risks that projected climate change might pose on storm water infrastructure. The main finding of this study is that the distribution of rain throughout the storm event may play a more important role than the total rainfall depth when water ponding/flooding is the major concern. It is further concluded that risk analysis must be tailored to the type of infrastructure under consideration.
1 Introduction
The topic of climate change and its potential impacts on our physical environment has been the center of attention for over a decade in water resources literature. The overwhelming attention given to this topic is valid as projected changes in hydrometeorological variables, such as temperature and precipitation, can significantly affect the hydrological cycle and available water resources (CitationPiao et al., 2010; CitationArnell, 1999), water demand (CitationDoll, 2002; CitationGrouillet et al., 2015), landuse (CitationWheeler and Braun, 2013; CitationHanewinkel et al., 2013), risk of extreme events (CitationCoumou and Rahmstorf, 2012; CitationShahabul Alam and Elshorbagy, 2015; CitationCai et al., 2014; CitationMonier and Gao, 2015), food security (CitationGregory et al., 2005; CitationSchmidhuber and Tubiello, 2007), and the viability of water infrastructure. The hydrometeorological research community has made significant strides in the direction of quantifying possible climate change impacts on precipitation (CitationRudolph et al., 2012; CitationRana et al., 2014), streamflow (CitationYang et al., 2014), temperature (CitationLauri et al., 2012), reservoir operation (CitationRaje and Mujumdar, 2010), flood risks (CitationVeijalainen et al., 2010), and droughts (CitationJenkins and Warren, 2015).
In many studies, as is often the case in hydrology, surrogates are used to quantify and assess the impacts of climate change. For example, changes in the amount of streamflow is considered to represent water availability (CitationHassanzadeh et al., 2015). However, the complexity of water resource systems and the interactions among water supply, demand, and policy make the mere changes in streamflow too simplistic as a representation of water shortage. Similarly, progress has been made to estimate the impacts of climate change on the intensity–duration–frequency (IDF) curves and design storms in various regions (CitationOlsson et al., 2012; CitationRodríguez et al., 2014; CitationShahabul Alam and Elshorbagy, 2015; CitationKuo et al., 2014; CitationSrivastav et al., 2014; CitationHassanzadeh et al., 2014a). However, this alone leaves municipalities with unanswered questions regarding the translation of the estimated change (e.g., 15% increase in extreme rainfall) to the urban storm water management infrastructure and its temporal storage capacity. The manner in which the storm is distributed over time, the runoff routing to detention or retention ponds, and the store-and-release mechanism of the storage facility can absorb or amplify the projected change in the rainfall amount. Until such issues are addressed, it is difficult to convince decision makers of the “real” impacts of climate change on water resource systems and infrastructure.
An example of progress in the direction of quantifying the real impacts of climate change on stakeholders is the use of hydro-economic models to assess the economic impacts of climate change and water shortage on society (CitationHarou et al., 2009; CitationHassanzadeh et al., 2014b; George et al., 2011; CitationVarela-Ortega et al., 2011). This is achieved through propagating the change of climate on hydrology using a series of models to downscale the climate change effect, predict the effects on streamflow, and use the predicted flows as boundary conditions in hydro-economic water allocation models to estimate the economic effects of shortage on various water users. The outputs of such models are useful for both policy and decision makers, who rely on socioeconomic values for their tradeoff analysis and high level decision making, and utility managers who can assess risks and manage infrastructure assets.
This paper focuses on the effect of storms on small urban watersheds and one of its major storm water infrastructure — detention ponds. The objectives of this paper are to (i) quantify extreme runoff as the variable of interest for storm water ponds, rather than rainfall, along with its uncertainty that stems from natural weather variability; and to (ii) quantify the magnitude of flood risk due to insufficiency of storage capacity, along with the probability of the pond’s failure in meeting its urban flood objectives. The analysis is performed under historical and projected climate change scenarios. The proposed work aims at producing a risk-based framework for evaluating urban water infrastructure and the associated risk of failure.
2 Analysis of the major system of storm water infrastructure
Storm water detention ponds are a popular storm water management practice in many communities (CitationGoff and Gentry, 2006). Their main function is to make the slopes of the outflow hydrographs in the rising and recession segments smoother than those without detention ponds (CitationChen et al., 2007). Meanwhile, the shape of the peak becomes flatter if a detention pond is installed. Such a function modifies the runoff flowing further downstream through the storm sewer network and receiving rivers. Decades ago, engineers realized that detention ponds designed for a particular return period, e.g., 100-year storm, may have very little effect on the peak flow reduction of even smaller return periods; e.g., 10-year storms (CitationWhippel and Randall, 1983). This was later addressed by considering multiple return periods for the design and analysis of ponds (CitationAkan, 1989). Earlier research placed emphasis on the routing process and the pond’s ability to reduce the outflow peak. The role of storm water ponds in controlling pollution was also considered in optimization frameworks for determining the design parameters, such as storage volume, release rate, and pond depth (CitationBehera et al., 1999).
One should not overlook an important aspect of detention ponds, which is the ability to temporally preserve the collected runoff volume within its design level to protect the surrounding community from flooding. Little attention is given to the fact that storms with the same duration and total depth; i.e., same return period, can have significantly different effects on the detention ponds as a result of different intra-storm rainfall distributions, which generate different runoff ratios. Large uncertainty is associated with the amount of possible loading (runoff) to the storm water ponds as a result of natural weather variability. Designers need to model major uncertainty drivers and investigate design alternatives under a range of possible scenarios (CitationDeng et al., 2013).
In a comprehensive presentation of the methods used for the design of detention ponds, although using a hypothetical urban catchment, CitationGuo (2001) noted that the design storm approach, continuous simulation approach, and the analytical probabilistic approach (CitationGuo and Adams, 1999) ignore the detailed distribution of rainfall intensities within each event. It has been a typical practice to also assume that the statistical characteristics of the rainfall will remain the same in the future. Recent studies on climate change indicated that the return period of an annual maximum precipitation (AMP) amount will decrease significantly by the end of the 21st century while the frequency of extreme rainfall events will increase (CitationIPCC, 2013). Consequently, climate change is projected to have significant effects on urban drainage and design considerations of storm water collection infrastructure (CitationWillems, 2013; CitationWatt and Marsalek, 2013; CitationMynett and Vojinovic, 2009). This led to investigations of changes to IDF curves, used for urban drainage designs in many places, under climate change (CitationArnbjerg-Nielsen, 2012; CitationHassanzadeh et al., 2014a; CitationLiew et al., 2014; CitationShahabul Alam and Elshorbagy 2015; CitationPeck et al., 2012; CitationWang et al., 2013). However, IDF curves overlook the actual distribution of rainfall within each storm. This study highlights the issue of intra-storm distribution of rainfall and its effect on detention ponds.
3 Case study and data
Saskatoon lies in the middle of the Canadian prairies (106.7°W, 52.2°N), which is a region of relatively wet summers and dry winters. The average annual precipitation over Saskatoon is 352 mm between 1961 and 2003 according to the daily precipitation records available through the Canadian Daily Climate Data (CDCD) portal (http://www.climate.weatheroffice.gc.ca). The region is expected to observe extreme precipitation events more frequently under climate change (CitationMartz et al., 2007; CitationShahabul Alam and Elshorbagy, 2015). In Saskatoon, data up to 1986 were included in the construction of the current IDF curves, which are used for municipal design purposes. Critical storms, from a design perspective, in Saskatoon are typically convective summer storms with less than two-hour duration. The maximum storm duration considered in Saskatoon is 24-h. The city uses the storm of June 24, 1983, which is almost a 100-year storm, for design purposes. The storm accumulated 96 mm of rain in 24 h, with 76 mm of the rain was concentrated in one hour.
This study extends and builds on the work of CitationShahabul Alam and Elshorbagy (2015) in which the weather generator, LARS-WG, was calibrated using the observed daily precipitation data at Saskatoon’s Diefenbaker Airport station, measured by Environment Canada (EC), to generate an ensemble of 30-year time series of daily rainfall values between April and September. CitationShahabul Alam and Elshorbagy (2015) developed a K-nearest neighbor (KNN) model to disaggregate the daily rainfall to hourly values. These generated rainfall time series for the baseline period (1960–1990), as well as the projected future values, based on the Canadian general circulation model (GCM) titled CanESM2 and representative concentration pathways RCP 2.6, 4.5, and 8.5, were used for this study. Details of LARS-WG, its calibration using rainfall measurements in Saskatoon, and the RCPs can be found in CitationShahabul Alam and Elshorbagy (2015).
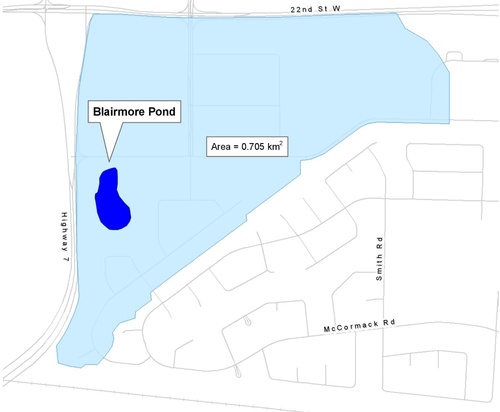
The Blairmore pond urban catchment (subdivision) was selected as a case study for this research (). It is a small catchment in southwestern Saskatoon with an area of 0.71 km2, average slope of 2%, and average imperviousness of 40%. The normal water level (permanent pool) of the pond is at an elevation of 498.69 m. The 1983 design storm, which accumulated 96 mm of rain in 24 h, increases the water elevation up to 501.50 m with a corresponding storage of 58,175 m3. The maximum possible water level in the pond, which reaches the back of the parcels (private properties), is 502.50 m with a corresponding storage volume of 88,943 m3. Any collected runoff volume exceeding 58,175 m3 is considered to exceed the safe design level as water gets into the free board. The storm water collected in the pond is gradually released through the storm water sewer system to the South Saskatchewan River. It might take close to one day to empty the pond in case of 100-year storms.
4 Methodology for analysis and design
CitationShahabul Alam and Elshorbagy (2015) constructed projected future IDF curves for Saskatoon, Canada, under climate change, assuming the RCPs of 2.6, 4.5, and 8.5. LARS-WG, a stochastic weather generator, was used to generate 1000 realizations of the daily rainfall series based on the statistical properties of the observed rainfall in Saskatoon during the baseline period (1960–1990). Consequently, the GCMs’ output of projected daily rainfall under various RCPs was spatially downscaled to the local scale of Saskatoon using LARS-WG. Furthermore, CitationShahabul Alam and Elshorbagy (2015) disaggregated the daily time series to an hourly scale using the KNN technique. The annual maximum rainfall values of various storm durations were calculated and the generalized extreme value (GEV) probability distributions were used to construct the IDF curves. Here, we do not use the IDF curves, but rather benefit from the ensemble of continuous hourly time series of rainfall generated for the baseline period, as well as the projected future series (2014–2100) based on the CanESM2 and RCPs 2.6, 4.5, and 8.5. The generated database for this study includes (i) an ensemble of 1000 stochastically generated continuous time series of hourly rainfall values (between April and September) representing the natural weather variability over the baseline period (1960–1990); and (ii) ensembles of 1000 time series, generated based on each of the three future RCPs.
A moving window of 24-h length was used to scan each hourly time series (30 years of baseline period and each of the three future RCPs between 2014–2100) and identify the most critical window, i.e., the day with the maximum depth of rainfall in the time series. The 24-h window was selected because it is the pre-set design duration in the city of Saskatoon. However, the same method can be implemented with any other selected window length. Repeating this process with each of the generated time series, 1000 critical storms with a 24-h duration were identified for the baseline period and for each of the three future RCPs. The generated 1000 storms for each climate conditions; i.e., baseline and future, allow for estimating the uncertainty stemming from the inevitable natural weather variability and for quantifying the probability of exceeding or not-exceeding a selected threshold. This approach ensures following the design methodology in Saskatoon, which relies on 24-h critical storms, with adding a stochastic dimension to it to quantify the uncertainty due to natural weather variability. An additional advantage of relying on the continuous time series simulated using weather generators is that storms of various patterns of intra-storm temporal distribution of rainfall are obtained. Ideally, each of the 1000 storms can be used as an input to a hydrologic–hydraulic model; e.g., XPSWMM (CitationXP Solutions 2014) to simulate the runoff collected in the detention pond. However, to reduce the computational burden to a practical range, Latin Hypercube sampling was used to sample a smaller number of storms (32 storms in this study) covering the entire range of the 1000 simulations.
The effect of each of the 32 storms, with a 24-h duration, on the urban catchment was simulated using a storm water management model, XPSWMM, which is typically used by the City storm water planners and designers. This model is able to simulate runoff from rainfalls through the consideration of factors such as rainfall distribution, percentage of imperviousness, soil infiltration, evaporation, soil precedent moisture, etc. The model uses dynamic equations to route the simulated runoff into storm water infrastructures such as pipes, channels, detention ponds, and other storage facilities. XPSWMM has been in use by the City of Saskatoon for several years to allow for the design and management of their storm water infrastructure. The model used for this analysis consisted of a number of neighborhoods, including the areas adjacent to the pond, all of which drain to the river by the means of the same outfall. Therefore, all storm water infrastructure, and hence their hydraulic conditions, which could affect the pond’s hydraulic grade line, were considered. Once the water level in this pond reaches an elevation of 498.62 m, water will leave the pond and flow downstream towards the river through a series of pipes. For each 24-h run (storm scenario), the maximum runoff volume (m3) accumulated in the pond was recorded as it represents the used storage. The empirical probability distribution (EPD) of the 32 used storage values was constructed to represent the uncertainty of the runoff volume that is collected and detained in the pond temporally. The actual design value of the pond was compared against the EPD as will be shown in the Results section. Any runoff volume collected in excess of the design storage creates flood risk that can be estimated using the EPD. The EPD was used with the current design value to calculate two indicators that quantify the risk of flooding: the exceedance probability (EP) and the expected risk (ER) of overfilling the detention pond.
5 Results and analysis
5.1 The performance of the pond under the baseline conditions
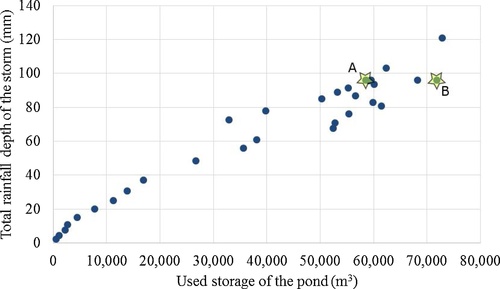
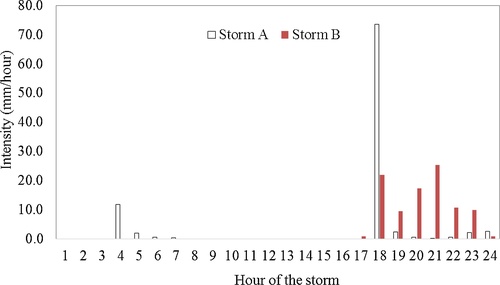
is a straightforward validation of the hypothesis on which this research is founded. The total rainfall depths of the sampled 32 storms for the baseline period are plotted against their simulated runoff volume that is accumulated in the detention pond. The volume selected for the plot is the maximum amount of water stored during the 24-h storm duration. It is obvious that storms of similar total rainfall depth can lead to different runoff volumes in the pond, and thus, assessing critical situations based only on the total rainfall depth can lead to a significantly different conclusion from that drawn based on the resulting runoff volume accumulated in the pond. For example, a storm with a rainfall depth of 76 mm in a 24-h period resulted in a maximum stored runoff volume of 55,388 m3, whereas another storm with a slightly higher depth of 78 mm resulted in a maximum stored runoff volume of only 39,800 m3. Along the same line of argument, the current design storm depth of 96 mm can indeed result in maximum stored runoff volume within the safe limits, around 58,500 m3. However, it can also lead to a significantly higher value of 71,900 m3 (). These two different storms, which are labelled in by letters A and B, are presented in . Apparently, the rainfall distribution within the storm plays a major role in its effect on the detention pond. Storm A is very similar to the storm of June 24, 1983, which is currently used as the design storm. This point is indeed very important for storm water management, especially in light of recent findings that increasing temperature, as expected in the future for the Canadian prairies, can change the rainfall dynamics and distribution within the storm significantly (CitationWasko and Sharma 2015).
Each of the hourly 32 storms generated for the baseline period was used as an input to XPSWMM. From there, the runoff accumulated in the detention pond was predicted and the maximum accumulated runoff during the 24-h duration was identified as the critical runoff volume for the storm under consideration. The EPD fitted to the 32 values is shown in (a). A few important and relevant observations can be made regarding the results shown in . The natural weather variability, quantified by the generation of an ensemble weather series and represented in the form of a probability distribution, is a major source of uncertainty around the critical (design) storm. This is evident even with regard to the total storm depth ((b)). This uncertainty leads to risk because any event that lies on the figure to the right of the design level poses a flooding risk. shows that even currently for the baseline period, the probability that the critical storm might exceed the design level is around 0.30 ((a)). Assessing and quantifying the current level of risk is important as a reference for the evaluation of the risk that might arise from any future development or climate change scenario. It is important to note that all 32 storms were extracted as critical 24-h storms from ensemble of series, which have the same length. Therefore, the uncertainty represented by the probability distribution is regarding the flooding magnitude for a given return period.
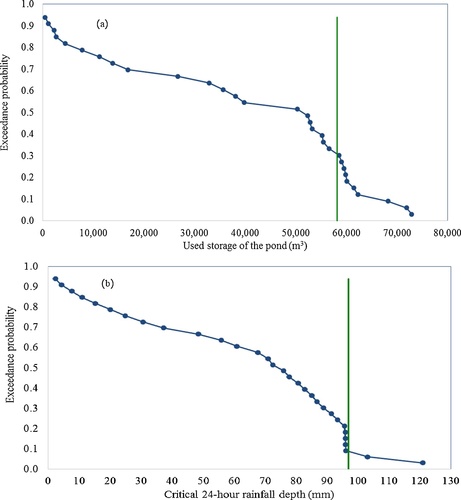
Another point of importance to consider involves the two indicators associated with uncertainty around the design capacity of the pond: (i) the exceedance probability (EP), which is 0.30 for the case study of the Blairmore pond ((a)), and (ii) the magnitude of the expected risk (ER), which can be estimated as the area under the EPD and bounded on the left side by the vertical line representing the design level (CitationHaldar and Mahadevan, 2000). For the Blairmore pond, the ER is calculated to be 2300 m3 under the baseline conditions according to the analysis presented here. We propose that the municipal regulations can use either the EP, ER, or both as design and evaluation criteria. In our assessment, and for the evaluation of existing ponds, the EP criterion seems to be sensible and easier for stakeholders to comprehend. The EP value of 0.30 can be acceptable as it is exceedance probability when the critical storm occurs. The critical storm itself typically has a small probability of occurrence — close to 0.01 in the city of Saskatoon, using the GEV distribution (CitationShahabul Alam and Elshorbagy 2015). If we want to restrict our estimation of the probability of occurrence to the empirical value based on the 30 year record, the probability of the critical storm is 0.03. The EP value proposed here represents the fact that there can be several realizations of the critical storm due to natural weather variability.
A final point of importance is the difference between inferences made and conclusions drawn based on (a) and (b). Traditionally, design storms are selected in many places using IDF curves and the total depth of rainfall. If the rainfall depth is used ((b)), the EP is much lower with a value of 0.09, which might lead to the conclusion that the pond provides a safety level with certainty higher than it actually does, as shown in (a). This important difference comes from the fact that the total rainfall depth approach ignores the effect of the intra-storm rainfall distribution and its effect on the runoff volume accumulated in the pond. The ER value, calculated based on (b) to be around 1.3 mm, reflects a different ER to that estimated based on (a). An easy way to comprehend the uncertainty numbers is through comparing them to the current design values as a reference (96 mm of rain and 58,175 m3 of runoff storage). The percentages of the ER values compared to the design value for the baseline period are 4.0% and 1.3% based on the runoff volume and the total rainfall depth, respectively. EP and ER values measure two different aspects of the problem. Even one extreme storm to the right of the EPD’s tail can increase the ER value sharply, while not affecting the EP value; it certainly depends on the shape of the EPDs.
5.2 Effects of climate change on the performance of the detention pond
The same steps of modeling and analysis conducted with the baseline rainfall data in the previous section were repeated with three future RCPs (RCP 2.6, 4.5, and 8.5) based on the CanESM2. The results are shown in . The risk profiles constructed for the three RCPs are different from each other and also different from the baseline period scenario. The exceedance probability (EP) of RCPs 2.6 and 8.5 are close with values of 0.45 and 0.48, respectively, but different from RCP 4.5 that seems to be posing an even lower EP value (0.15) than the existing baseline value of 0.30 ((a)). However, the expected risk (ER) value of RCP 4.5 is higher than the baseline value due to an extreme event that can generate 101,000 m3 of runoff with very low probability of occurrence. The ER values are 4.8% and 4.0% of the design capacity for RCP 4.5 and the baseline conditions, respectively ().
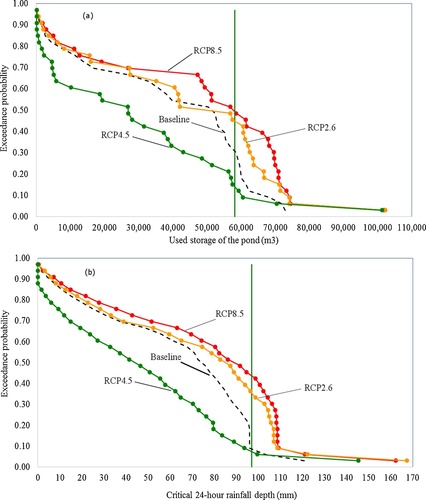
Table 1 Exceedance probability and expected risk for the Blairmore detention pond under baseline conditions and future climate scenarios.
Similar to the argument presented regarding the baseline period, the three RCPs presents lower EP and ER values when using the rainfall depth rather than the runoff volumes ((b) and ). By looking at the numbers presented in , the percentage of the ER compared to the design value for the three RCPs are different from one another and different from the baseline period in an inconsistent way if rainfall depth or runoff volume is considered. For example, RCP 8.5 generates expected risk of runoff volume that is 12.7% of the design capacity, which is three times higher than the baseline period. However, if the rainfall depth is used, the same RCP generates expected risk that is 6.5% of the design value, which is five times higher than the baseline period. This finding is another confirmation that the runoff volume should be used for assessing the flood risk in detention ponds, rather than the total rainfall depth of the storm. This is also important in light of the findings of CitationShahabul Alam and Elshorbagy (2015) that the contribution of different RCPs to the uncertainty of the IDF curves may not be that important if a particular GCM, e.g., CanESM2, is used. This current study, which investigates the effect of the rainfall distribution within the storm, provides a different insight than that obtained by CitationShahabul Alam and Elshorbagy (2015) using the IDF curves.
For further elaboration of the concepts of expected risk and exceedance probability, some numbers are extracted from to provide practical understanding and interpretation of their meaning and utility. The analysis shows that RCPs 2.6 and 8.5 introduce EP values of 0.45 and 0.48, respectively. To increase the level of safety and bring the EP values of those projected future values down to that associated with the baseline conditions (0.30), the design capacity of the pond should be increased from 58,175 m3 to 62,500 m3 and 69,600 m3, respectively. This means an upgrade of the storage capacity by 7.5% and 19.6%, respectively. For new pond construction, this analysis allows for associating the construction cost of the pond to the acceptable hydrological risk level. However, if the ER is used as a criterion instead of the EP, and the projected ER values of RCPs 2.6 and 8.5 are to be lowered to the baseline value of 2300 m3, the pond capacity should be increased to 67,000 m3 and 69,000 m3, respectively.
The shapes of the empirical probability distributions (EPDs) and the EP and ER values presented and discussed earlier are approximations and can be slightly different from those that could result from using the entire 1000 realizations generated using LARS-WG. However, these differences affect all scenarios, baseline and future RCPs, in a similar way and their effects are small with regard to the relative changes caused by future RCPs compared to the baseline conditions. Due to the time consuming task of running each generated storm through XPSWMM, it was not practical to run all 1000 storms for this study. The effect can be also brought down to a negligible amount by using the EP of each sampled storm that corresponds to its position in the whole ensemble, rather than the smaller sample. For example, when the biggest storm in the set of 1000 is sampled for the smaller set of 32, its EP can be taken as 0.001, rather than the 0.03 that represents its position in the small set. It can be also argued that theoretical distributions can be used to fit the sample and consequently used for estimating the EP and ER values. However, this method was avoided in this study because the different scenarios required different distributions and the deviations from the EPDs were noticeable. This by itself can add significant uncertainty around the estimates and make the analysis regarding the relative change of future RCPs, compared to the baseline period, more difficult.
6 Discussion
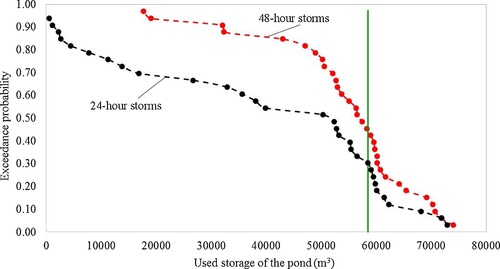
Saskatoon is located in a semi-arid region that is characterized by summer convective storms and cold, snow-dominated winters. The convective summer storms (May–September) are the generators of the critical storms used for storm sewer design and are typically of durations shorter than 24 h. However, an interesting question can be raised regarding the performance of the detention ponds under the effect of storms with longer durations, given the fact that the pond may not drain the collected runoff as quickly as anticipated. For this purpose, a similar analysis to that conducted with 24-h critical storms was performed using a window length of 48-h. A moving window of 48-h was used to scan each 30-year time series of those generated for the baseline period and identify the most critical 48-h period; i.e., the 48-h with the maximum depth of rainfall in the time series. Repeating this process with each of the generated time series, 1000 critical hourly storms with a duration of 48-h were identified for the baseline period only. Similar to the previous analysis, 32 series were sampled to cover the whole range of the 1000 series and were used as inputs to XPSWMM to calculate the runoff volume routed to the detention pond.
To understand how the 48-h storms might affect the detention pond differently from the 24-h storms, the amount of storage available in the pond at the end of day-1 of the storm was identified for each storm. The EPD of the available storage in the pond at the end of day-1 is shown in along with the runoff generated as a result of the portion of the storm that precipitated during day-2, which are plotted as dots in . All dots on the right side of the EPD represent amounts of runoff generated in day-2 of the storm in excess of the available storage in the pond. However, throughout day-2, the pond keeps releasing some of the stored runoff. Therefore, the maximum amount of runoff collected in the pond throughout the 48-h has been identified in a way similar to what was conducted with the 24-h storms.

shows that 48-h storms can pose a higher risk of flooding as well as a higher EP value. Compared to the 24-hour’s EP and ER values of 0.30 and 2300 m3, respectively (), the corresponding values based on the 48-h storms are 0.42 and 2600 m3. These differences are worth paying attention to, nonetheless, they result from a sample of 32 storms that resulted in total depth of rain ranging from 49 mm to 263 mm over 48 h, with a mean value of 134 mm. These numbers should be considered in light of the fact that storms of a duration longer than 24 h are not typical of this region as a convective storm-dominated region and are not typically considered for design purposes. The maximum depth of rainfall accumulated in 48 h in Saskatoon during the last 115 years, according to the daily record of Environment Canada, was only 103 mm. Therefore, the analysis of the 24-h storms is the focus of this study while the 48-h storms are brought up to highlight the significant increase that they can cause to the EP and ER values. Along the same approach, longer durations, or even continuous simulation of the generated 30-year hourly series, can be used, but the analysis could come at high computational costs. The analysis and the concepts of the EP and ER presented here to quantify the risk stemming from the uncertainty is the same, regardless of the storm duration. The analysis presented in this study shows that risk analysis needs to be tailored to the infrastructure component under study. For example, large surface water reservoir systems might be impacted by the total depth of rainfall and the inter-storm (event) time lapse, rather than the intra-storm rainfall distribution shown to be significant for storm water detention ponds.
The risk-based methodology developed in this paper to analyze the flooding risk related to storm water ponds has been applied using the baseline period (1960–1990) and three future RCPs using the CanESM2 only. The same analysis can be repeated with various other GCMs or Regional Climate Models (RCMs) to analyze how the uncertainty due to several GCMs or RCMs is translated into EP and ER values, and to investigate if such uncertainty is amplified or reduced when translated into actual flooding risk indicators. Another source of uncertainty could come from the rainfall disaggregation method. This was somewhat addressed in CitationShahabul Alam and Elshorbagy (2015) for the city of Saskatoon, but the disaggregation uncertainty was not considered in this study.
7 Conclusions
Natural weather variability introduces a major source of uncertainty with regard to the possible rainfall time series at any location. Consequently, critical storms of a specific duration; e.g., 24 h, which is used for storm water infrastructure design are also uncertain. It is possible to quantify such uncertainty using stochastic weather generators by generating an ensemble of long term rainfall series. This uncertainty includes the total depth of rainfall, as well as the distribution of rain within the storm. Through a case study in the city of Saskatoon, Canada, it was shown that the hourly rainfall distribution within the storm plays an important role in urban hydrology and affects the volume of runoff collected in the storm water detention ponds. Even storms that accumulate the same depth of rainfall over 24 h were shown to generate significantly different runoff volumes, and thus, pose different flooding risk values.
An ensemble of 24-h storms in Saskatoon were generated and used within XPSWMM to predict the surface runoff collected at the detention pond. Empirical probability distributions of the 24-h storm depths and the maximum runoff volume routed to the detention pond were constructed for the baseline period (1960–1990), as well as under three future climate change scenarios (RCPs 2.6, 4.5, and 8.5). The exceedance probability (EP) and the expected risk (ER) were calculated, relative to the current design values, and proposed as design parameters that represent the uncertainty stemming from natural weather variability. The EP and ER values derived from the runoff volume are more critical than those based on the total rainfall depth. This finding is attributed to the effect of the rainfall distribution within the storm. The analysis presented in this paper reveals that, even under the baseline conditions, there is an expected risk of exceeding the pond’s design capacity of 2300 m3 and the exceedance probability is 0.30. Both RCP 2.6 and RCP 8.5 introduce higher values of EP and ER compared to the baseline values.
The risk-based analysis presented in this paper highlights the importance of tailoring the risk analysis and quantification method to the type of the infrastructure component under consideration. The presented approach can be also used to analyze the effect of storms of different durations and also with the continuous simulation approach.
Acknowledgements
This work was based partly on an earlier project that was funded by the City of Saskatoon. The funds of Canada’s NSERC through its Discovery Grants Program to the first author is also acknowledged. The help with regard to some coding and analysis provided by Md. Shahabul Alam and Sander Wang is appreciated.
References
- O.AkanDetention pond sizing for multiple return periodsJ. Hydraul. Eng.11551989650664
- K.Arnbjerg-NielsenQuantification of climate change effects on extreme precipitation used for high resolution hydrologic designUrban Water J.9220125765
- N.ArnellClimate change and global water resourcesGlobal Environ. Change91999S31S49
- P.BeheraF.PapaB.AdamsOptimization of regional storm-water management systemsJ. Water Resour. Plann. Manage.12521999107114
- W.CaiIncreasing frequency of extreme El Niño events due to greenhouse warmingNature Clim. Change42014111116
- C.ChenC.-N.TsaiC.-T.TsaiReduction of discharge hydrograph and flood stage resulted from upstream detention pondsHydrol. Process.21200734923506
- D.CoumouS.RahmstorfA decade of weather extremesNature Clim. Change22012491496
- Y.DengM.-A.CardinV.BabovicD.SanthanakrishnanP.SchmitterA.MeshgiValuing flexibilities in the design of urban water management systemsWater Res.47201371627174
- P.DollImpact of climate change and variability on irrigation requirements: a global perspectiveClim. Change542002269293
- B.GeorgeH.MalanoB.DavidsonP.HellegersL.BharatiS.MassuelAn integrated hydro-economic modelling framework to evaluate water allocation strategies II: scenario assessmentAgric. Water Manage.9852011747758
- K.GoffR.GentryThe influence of watershed and development characteristics on the cumulative impacts of stormwater detention pondsWater Resour. Manage.202006829860
- P.GregoryJ.IngramM.BrklacichClimate change and food securityPhilos. Trans. R. Soc. B360200521392148
- B.GrouilletJ.FabreD.RuellandA.DezetterHistorical reconstruction and 2050 projections of water demand under anthropogenic and climate changes in two contrasted Mediterranean catchmentsJ. Hydrol.5222015684696
- Y.GuoHydrologic design of urban flood control detention pondsJ. Hydrol. Eng.662001472479
- Y.GuoB.AdamsAn analytical probabilistic approach to sizing flood control detention facilitiesWater Resour. Res.358199924572468
- A.HaldarS.MahadevanProbability, Reliability and Statistical Methods in Engineering Design2000John Wiley & Sons, Inc.New York
- M.HanewinkelD.CullmannM.-J.SchelhaasG.-J.NabuursN.ZimmermannClimate change may cause severe loss in the economic value of European forest landNat. Clim. Change32013203207
- J.J.HarouM.Pulido-VelazquezD.E.RosenbergJ.Medellín-AzuaraJ.R.LundR.E.HowittHydro-economic models: concepts, design, applications, and future prospectsJ. Hydrol.3753–42009627643
- E.HassanzadehA.ElshorbagyH.WheaterP.GoberA.NazemiIntegrating supply uncertainties from stochastic modeling into integrated water resource management: a case study of the Saskatchewan River BasinJ. Water Resour. Plann. Manage.1422201505015006
- E.HassanzadehA.NazemiA.ElshorbagyQuantile-based downscaling of rainfall using genetic programming: application to IDF curves in the City of SaskatoonJ. Hydrol. Eng.192014943955
- E.HassanzadehA.ElshorbagyH.WheaterP.GoberManaging water in complex systems: an integrated water resources model for Saskatchewan, CanadaEnviron. Mod. Software5820141226
- Intergovernmental Panel on Climate Change (IPCC)Climate change 2013: the physical science basisStockerContribution of Working Group I to the Fifth Assessment Report of the Intergovernmental Panel on Climate Change2013Cambridge University PressCambridge, United Kingdom and New York, NY, USA 1535 p.
- K.JenkinsR.WarrenQuantifying the impact of climate change on drought regimes using the Standardised Precipitation IndexTheor. Appl. Climatol.12020154154
- C.-C.KuoT.Y.GanJ.L.HanrahanPrecipitation frequency analysis based on regional climate simulations in Central AlbertaJ. Hydrol.5102014436446
- H.LauriH.MoelP.WardT.RasanenM.KeskinenM.KummuFuture changes in Mekong River hydrology: impact of climate change and reservoir operation on dischargeHydrol. Earth Syst. Sci.16201246034619
- S.C.LiewS.V.RaghavanS.-Y.LiongHow to construct future IDF curves, under changing climate, for sites with scarce rainfall records?Hydrol. Proc.288201432763287
- L.MartzJ.BruneauJ.T.RolfeClimate Change and Water: SSRB, Final Technical Report2007 http://www.parc.ca/ssrb (Last accessed 11 October 2017)
- E.MonierX.GaoClimate change impacts on extreme events in the United States: an uncertainty analysisClim. Change13120156781
- A.E.MynettZ.VojinovicHydroinformatics in multi-colours—part red: urban flood and disaster managementJ. Hydroinf.1142009166180
- J.OlssonU.WillénA.KawamuraDownscaling extreme short-term regional climate model rainfall for urban hydrological applicationsHydrol. Res.4342012341351
- A.PeckP.ProdanovicS.P.P.SimonovicRainfall intensity duration frequency curves under climate change: city of London, Ontario, CanadaCan. Water Resour. J.3732012177189
- S.PiaoThe impacts of climate change on water resources and agriculture in ChinaNature46720104351
- D.RajeP.P.MujumdarReservoir performance under uncertainty in hydrologic impacts of climate changeAdv. Water Resour.3332010312326
- A.RanaK.FosterT.BosshardJ.OlssonL.BengtssonImpact of climate change on rainfall over Mumbai using Distribution-based Scaling of Global Climate Model projectionsJ. Hydrol.: Region. Stud.12014107128
- R.RodríguezX.NavarroM.C.CasasJ.RibalayguaB.RussoL.PougetA.RedañoInfluence of climate change on IDF curves for the metropolitan area of Barcelona (Spain)Int. J. Climatol.3432014643654
- J.RudolphK.FriedrichU.GermannModel-based estimation of dynamic effect on twenty-first-century precipitation for Swiss river basinsJ. Climate25201228972913
- J.SchmidhuberF.TubielloGlobal food security under climate changePNAS1045020071970319708
- M.D.Shahabul AlamA.ElshorbagyQuantification of the climate change-induced variations in Intensity–Duration–Frequency curves in the Canadian PrairiesJ. Hydrol.52720159901005
- R.K.SrivastavA.SchardongS.P.SimonovicEquidistance quantile matching method for updating IDF curves under climate changeWater Resour. Manage.289201425392562
- C.Varela-OrtegaI.Blanco-GutiérrezC.H.SwartzT.E.DowningBalancing groundwater conservation and rural livelihoods under water and climate uncertainties: an integrated hydro-economic modeling frameworkGlobal Environ. Change2122011604619
- N.VeijalainenE.LotsariP.AlhoB.VehviläinenJ.KäyhköNational scale assessment of climate change impacts on flooding in FinlandJ. Hydrol.3912010333350
- D.WangS.C.HagenK.AlizadClimate change impact and uncertainty analysis of extreme rainfall events in the Apalachicola River basin, FloridaJ. Hydrol.4802013125135
- C.WaskoA.SharmaSteeper temporal distribution of rain intensity at higher temperatures within Australian stormsNat. Geosci.82015527529
- E.WattJ.MarsalekCritical review of the evolution of the design storm event conceptCan. J. Civil Eng.4022013105113
- T.WheelerJ.BraunClimate change impacts on global food securityScience3412013508513
- W.WhippelC.RandallDetention and Flow Retardation Devices Stormwater Management in Urbanizing Areas1983Prentice-Hall, Inc.Englewood Cliffs, N.J
- P.WillemsRevision of urban drainage design rules after assessment of climate change impacts on precipitation extremes at Uccle, BelgiumJ. Hydrol.4962013166177
- XP Solutions IncXPSWMM—Technical Description2014 http://xpsolutions.com/Software/XPSWMM/ (Last accessed 16 February 2016)
- T.YangX.WangZ.YuV.KrysanovaX.ChenF.SchwartzE.SudickyClimate change and probabilistic scenario of streamflow extremes in an alpine regionJ. Geophys. Res. Atmos.119201485358551