
 ?Mathematical formulae have been encoded as MathML and are displayed in this HTML version using MathJax in order to improve their display. Uncheck the box to turn MathJax off. This feature requires Javascript. Click on a formula to zoom.
Abstract
The objective of this study is to model discharge and solid erosion quantification through a small agricultural watershed by applying the SWAT model (Soil and Water Assessment Tools) on the Wadi Harraza’s basin of which is part of Wadi Cheliff’s basin, with an average altitude of 500 m, drains an area of 568 sq km. Soil and Water Assessment Tool (SWAT, version 2009) model integrated with Geographic Information System (ArcGIS, version 10.0) were used to simulate the discharge and sediment concentration of Wadi Harraza’s basin for the period from 2004 to 2009. Model calibration and validation were performed for monthly time periods using Sequential Uncertainty Fitting 2 (SUFI-2, version 2) within SWAT-CUP. Our calibration and validation outputs for monthly simulation showed a good model performance for discharges. Thus the evolution of the average total annual sediment in the Wadi Harraza’s basin which will be deposited in the Wadi Cheliff, is estimated at 54.24 t ha−1.
1 Introduction
Since Algeria independence on 1962, the total number of operation dams at the national level is increased from 14 on 1962 to 65 on 2014 added of 02 major transfers, this hydraulic structures mobilizes nearly seven (07) billion m3 either a fill rate of 82% of water intended for the supply of potable water, the irrigation and the industry (CitationANBT, 2014). A cumulative mud of about one (1) billion cubic meters is deposited at the bottom of these dams. This high value is only the consequence of the watersheds degradation in Northern Algeria. This high value causes the degradation of all watersheds in Northern Algeria.
Indeed, water erosion is a major problem in northern Algeria. The main cause of erosion is runoff which is controlled by those of rainfall and geological and bio-physiographic characteristics (topography, vegetation cover, pedology …). The erosion is manifested mainly on slopy soils degradation in the mountainous areas. It accelerated after the scale encroachment on forests which protected the sensitive soils. The water erosion intensity varies from one zone to another, the Western part (47% of all the land), is the most eroded region of the country, then come the regions of the center (27%) and East (26%).
As well, the watershed modeling plays a crucial role in the planning and local resources development. To predict reliable quantity and sediment transport rate from land surface into streams, rivers and water bodies, to identify erosion problem areas within a watershed and to propose the best management practices to reduce erosion impact, models are used (CitationYesuf et al., 2015). In this paper, Soil Water Assessment Tool model (SWAT) (CitationArnold et al., 1998) has been applied to simulate the performance of a small-scale in the Wadi Harraza watershed in north of Algeria.
The Soil and Water Assessment Tool (SWAT) (CitationArnold et al., 1998) was developed to predict the effects of different management practices on water quality, sediment yield and pollution loading in watersheds, it is a continuous time, daily-based and semi-distributed watershed simulation model developed to predict hydrological and water quality processes (CitationArnold et al., 1993; CitationYen et al., 2014) and to seek good planning strategies, which strongly depend on integrated basin models (CitationCollins and McGonigle, 2008; Citationde Vente et al., 2013; Rickson, 2014). The definition and the quantification of uncertainty calibration undistributed hydrological modeling have become the subject of much research in recent years (CitationAbbaspour, 2005). Several worldwide studies have been done using the SWAT model, for example in America (CitationArnold et al., 2012; CitationHavrylenko et al., 2016; CitationJha and Gassman, 2014; CitationMbonimpa et al., 2012 … etc.), CitationAbbaspour (2007) used the SWAT model to simulate all related processes affecting water quantity, sediment and nutrient loads in the Thur watershed in Switzerland. Their study indicated excellent results for flow and nitrate, and quite good results for sediment and total phosphorus.
Our objective in this research were to evaluate SWAT model and its applicability in the Harraza basin for stream flow prediction and sediment transport.
2 Study area
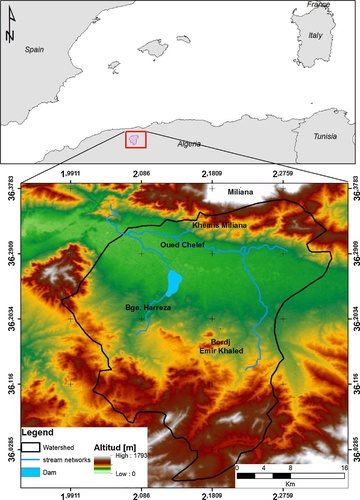
Wadi Harraza’s watershed which is part of largest Cheliff watershed covers an area of 568 square kilometers and has an average elevation of 450 m which the greater part (90%) has an elevation less than 650 m. It is located away West of Algiers by 120 kilometers, between 2° and 2°40′ east longitude and between 36° and 36°40′ North elevation (). The average annual rainfall in the basin is estimated at 500 mm where precipitation is received during the months of October to May and is insignificant in July and August, June and September are the months of transition (CitationANBT, 2014). Wadi Harraza’s watershed is located in the geological area between Boumaad Shaly Mountains and the foothills of the Ouarsenis. The reliefs of over 1500 m altitude are formed by limestone, metamorphosed shale and eruptive rocks deeply cut by steep ravines. In the valley, there are argilious silt, marl and clay (CitationMeguenni and Ramini, 2008).
3 Material and methods
3.1 Description of SWAT model
SWAT is developed by the USDA Agricultural Research Service (CitationArnold et al., 1993, Citation1998). It is designed for watersheds from a few hundred to several thousand km2. The model is semi-distributed: some parameters are spatialized while others are global; It is used to analyze the impacts of climate, soil, vegetation and agricultural activities on the flows. This is the most complete and used model (CitationArnold et al., 1998; CitationNeitsch et al., 2005). This model is physically-based and uses readily available temporal and spatial data. It simulates water flows in soil and ground water, crop growth, nutrient cycling, erosion, pesticides, bacteria, sediments, nutrients, and environmental impact of climate change (CitationArnold et al., 1998). The impact of climate change or land management practices on sediment transport and surface hydrological response over long periods of time for large complex watersheds that have differed soils, land use and management practices is anticipated by this model (CitationNeitsch et al., 2005). There are several versions of SWAT and the one used in this workpaper is 2009 version. In the SWAT model the basin is subdivided into multiple sub-basins, each sub-basin is divided into hydrological response units (HRU) that consist of unique homogenous combinations of soil and land use properties in each sub-basin (CitationArnold et al., 2012). The hydrological cycle simulated by SWAT model is based on the water balance equation (CitationNeitsch et al., 2005):
(1)
(1)
where SWt, SW0 are respectively, final and initial soil water content (mm/d); t is the time (day); Rday is the precipitation (mm/d); Qsurf is the runoff (mm/d); Ea is the evapotranspiration (mm/d); Wperc is the percolation (mm/d); Qgw is the return flow (mm/d).
Coupling with the Geographic Information System software (ArcGis 10.0) allows to manage raster, vector, and alphanumeric data. It facilitates and automates prepared input data, it makes more user-friendly the integration phase, manipulation and setting the parameters of the data related to the simulation.
SWAT operates on a daily time step and requires the use if available a daily rainfall data, maximum and minimum air temperature. If not, they are generated by the model. The precipitation simulation model developed by CitationNicks (1974) is a first order Markov chain model. Solar radiation, wind speed and relative humidity are always simulated. The SWAT model simulates surface runoff by using two alternative methods: the method of the Curve Number (CN) of the Soil Conservation Service of the USDA (Rallison, 1981; CitationUSDA, 1972) and the method of Green and Ampt (CitationGreen and Ampt, 1911). The erosion is estimated from the method Modified Universal Soil Loss Equation (MUSLE) (CitationWilliams, 1975; CitationWischmeier and Smith, 1978).
Three methods are recommended by the model for estimating potential evapotranspiration: Penman–Monteith (CitationMonteith, 1965), CitationHargreaves and Samani (1985), and CitationPriestley and Taylor (1972). The Penman–Monteith method requires as input: solar radiation, air temperature and relative humidity. The Priestley–Taylor method requires solar radiation and air temperature, while the Hargreaves method requires only the air temperature (CitationYebdri et al., 2007; CitationBriak et al., 2016).
3.2 Description of SUFI-2 model
As hydrological modeling is subject to large uncertainties, the definition and quantification of the model uncertainty became the subject of much research in recent years. To meet this demand, researchers have developed a variety of uncertainty analysis techniques for watershed models. These include Bayesian methods, such as the Mark chain Monte Carlo “MCMC” (CitationKassa and Foerch, 2007); Generalized Likelihood Uncertainty Estimation “GLUE” (CitationBeven and Binley, 1992); solution parameters (Parasol) (CitationAlamirew, 2006); Particle Swarm Optimization “PSO” (CitationEberhart and Kennedy, 1995) and Sequential Uncertainty Fitting “SUFI-2” (CitationAbbaspour, 2007; CitationAbbaspour et al., 2004).
Since no calibration program can meet the objectives of the different modeling needs, Glue, Parasol, PSO, SUFI-2, and MCMC have been interfaced with SWAT in a single package called SWAT-CUP (SWAT Calibration Uncertainty Programs) (CitationAbbaspour, 2007). In our study, we used SUFI-2 to combine the calibration and validation of our SWAT model. Three measures were used to evaluate the quality of calibration and sensitivity analysis: (a) the percentage of data excluded by the 95% prediction uncertainty (95PPU) (P-factor), (b) the ratio of the band 95PPU’s medium thickness and the standard deviation of the corresponding measured variable (D factor) and (c) the coefficient of Nash–Sutcliffe efficiency (NASH) between the observed data and the best simulation.
The formula of this coefficient is given in the following equations:
(2)
(2)
3.3 Input data
The following basic data were selected as SWAT model inputs:
| • | DEM: the DEM comes from the north of Algeria; it is extracted from the SRTM with a spatial resolution of 30 m (). | ||||
| • | Meteorology: SWAT operates at a daily time step; it requires precipitation, minimum and maximum daily temperatures, relative humidity, wind speed and solar illumination. Evapotranspiration is calculated according to the Penman–Monteith method (CitationMonteith, 1965) with SWAT, The meteorological data of the 02 stations used (Ababssa and Khemis ANRH) were derived from the files produced by the ONM, Office National de la Météorologie (National Office of Meteorology, Algiers), they cover a period of 13 years (2001–2013). | ||||
| • | Flow measurements: flow measurements: depending on the quantity and quality of the available time series, two flow stations (Arib-Cheliff and Ababssa) were selected for the model use (). These data come from the measurement networks of the ANRH Agence Nationale des Ressources Hydrauliques (National Water Resources Agency, Algiers) and they cover a six years (2004-2009) period. | ||||
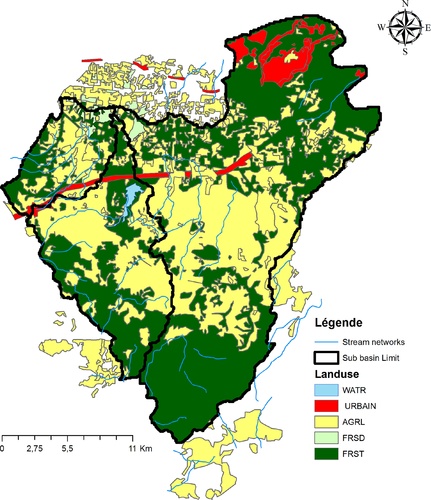
| • | Land use-plant cover: the land cover was constructed from the map of distributing land use classes of the Ain Defla wilaya provided by INSID, Institut National des Sols de l’irrigation et du Drainage (National Institute of soil of Irrigation and Drainage) and established in 2010 (). | ||||
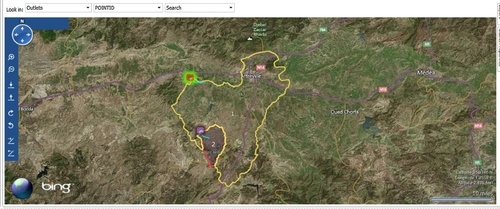
3.4 Basin delineation and HRU
2 sub-basins have been generated by the discretization of Wadi Harraza watershed (), defined mainly by reference to the confluence of the drainage system and hydrometric station. The Wadi Harraza basin results in 2 HRUs in the whole basin. This scenario results in the detailed land use, soil and slope database, containing many HRUs, which in turn represent the heterogeneity of the study area. However, the characteristics of the HRU units are the main factors influencing sediment flow and concentration (CitationBriak et al., 2016).
4 Results and discussion
4.1 Model application
In fact, model calibration and validation are indispensable for simulation process, which are used to estimate model expectation results. The model was only calibrated and validated against the monthly flow measurements to better represent the water cycle, the sediment measurements were directly simulated by the model because we do not have water quality data to make the comparison.
Flow measurements are available from 2004 to 2009. The period 2008–2009 was selected for validation because it was close to the period of the satellite images having served to spatialize the cultural evolution, while offering four years prior to the calibration is from 2004 to 2007. These years were slightly more humid with an annual average of 350 mm against 310 mm in the period 1990–2001. A simulation isconsideredadequate if NASH >0.5.
4.2 Model calibration
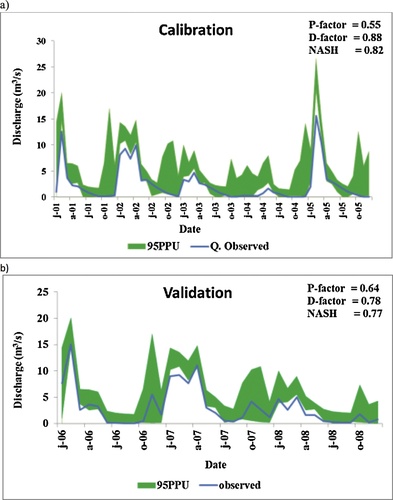
To refine the calibration, for the entire basin and its subunits, calibration of the model was done for monthly flow records. Indeed, calibration of SWAT model in the Wadi Harraza’s basin through the SUFI-2 method was performed over 4 years period by comparing the measured discharges to simulated discharges in hydrometric station considered (a). The comparative analysis reveals a fairly good adequacy. The factors P and D are respectively 0.55 and 0.88. These values show that the calibration and the taking into account of the uncertainties by the model are really corrects (). In addition, the NASH criterion (CitationNash and Sutcliffe, 1970), which also measures the link between the two statistical series, is 0.82 (82% of the simulated discharges are similar to the discharges observed).
4.3 Model validation
SWAT model validation was performed over other period of calibration (2 years) by comparing the discharges of measured flow to simulated flow in hydrometric station considered (b). According to the performance assessment criteria of the model recommended for a monthly time step (CitationMoriasi et al., 2007), the validation allowed us to obtain a good model performance for discharges with factors P and D are respectively 0.64 and 0.78. The NASH criterion which also measures the link between the two statistical series is 0.77. The difference between observed and simulated cumulating remains low (2–3% over 2 years, 2008–2009), this quality criterion of the simulations is important because the elapsed water slide strongly determines the concentration of suspended materials. The good agreement between simulations and observations through the validation phase also shows the good performance of model calibration and its ability to represent different climatic situations.
4.4 Sedimentary deposit and predictive simulations
Once the SWAT model was deemed satisfactory to represent the flows evolution,it was used for predictive purposes in order to evaluate the future flows evolution and sediment transport that will be deposited in the Cheliff wadi.
The results of the simulation for a future prediction that was carried out over the period 2004–2020, are recorded in the .
Table 1 Predictive simulations results.
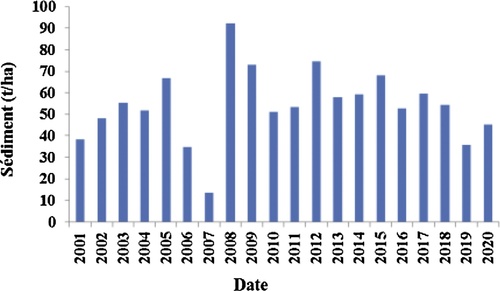
Thus the evolution of the average total annual sediment in the Harraza Wadi'sbasin and which will be deposited in the Cheliff wadi is estimated at 54.24 t ha−1 year−1 () which the year 2008 remains the year that displays an important degradationvalue which is equal to 92.21 t ha−1 this is due to the large amount of rain which has been recorded during this period and which exceeded the 544 mm, hence the highest monthly values were observed during the autumn period (September to December 15th, 2008) with a peak of 101.60 mm, which explains the high rate of soil degradation.
Indeed, for autumn, the high load is explained by the fact that rain often falls on dry soil and badly protected by vegetation.
The basin is bare in the autumn and after a long hot period, flood season systematically involve strong suspended sediment of maximum order, this phenomenon is relatively toned down for the next season it’s winter or land forming the basin are saturated and the plant cover is developed.
Torrential rains in September, October and November will pull large solid amounts, which will then be suspended by the stream. The basin response is rapidly manifested by runoff and shallow hypodermic flow.
According to CitationTixeront (1960), in an area where the annual rain is between 300 and 700 mm, the specific erosion is very active (>1200 t km−2 year−1) (Meguenni and Ramini, 2007).
These high values are only the consequence of all Northern Algeria’s watersheds degradation (Meguenni and Ramini, 2007); hence the specific erosion rate has reached the highest values. North Africa, thus exceeding 2000 t km−2 year−1 and concerns the Tellien Atlas’s catchment basins (Rhiou, Sly, Fodda …), it reached 4000 t km−2 year−1 on the Dahra coastal chain and 5000 t km−2 year−1 on the Ighil Emda basin (CitationDemmak, 1982), CitationMeguenni and Ramini (2008) also worked on the Harraza wadi basin but with an area 4 times smaller than that used in this study and they estimated the rate of specific soil degradation at 4.70 t ha−1 year−1 over a 25 years (1973–1997) period.
5 Conclusion
The first results suggest that the SWAT model is very efficient in simulating water phenomena and sediment transfer processes.
Although the integration of the data is quite long, developed interface is pretty user friendly and with a good use of the manual, the grip is quite comfortable.
The joint use of the model with the ArcGIS makes it possible to take into account the spatial variability within the modeling. This also makes it easy to enter the variables characteristics.
Soil and Water Assessment Tool (SWAT, version 2009) model integrated with Geographic Information System (ArcGIS, version 10.0) were used to simulate the stream flow and sediment concentration of Wadi Harraza basin situated in Algeria’s North West for the period from 2004 to 2009. Model calibration and validation were performed for monthly time periods using Sequential Uncertainty Fitting 2 (SUFI-2, version 2) within SWAT-CUP. Our calibration outputs for monthly simulation for the period from 2004 to 2007 showed a good model performance for discharges with P, D and NASH values of 0.55, 0.88 and 0.82 respectively. Nonetheless, during validation period (2008–2009) for monthly time step, the P, D and NASH values were 0.64, 0.78 and 0.77 for discharges. Thus the evolution of the average total annual sediment in the Wadi Harraza basin which will be deposited in the Wadi Cheliff, is estimated at 54.24 t ha−1 year−1 which the year 2008 remains the year that displays an important value of degradation and which is equal to 92.21 t ha−1 this is due to the large amount of rain which has been recorded during this period and which exceeded the 544 mm. The results obtained show that the model effectively reproduces and provides a better understanding of the behavior hydrological system to achieve optimal management of water resources and soil.
The works show the interest of the semi-distributed model SWAT to represent processes on a basin area of North Africa. CitationSchuol and Abbaspour (2006) applied the SWAT model across the basins of the Volta, Niger and Senegal with a specific timing method and got very variable but generally low results in the Nash coefficient. We show here on the Wadi Harraza basin that the SWAT model correctly reproduces and predicts the flows over a period (2004–2009). In addition, it produces elements of understanding of the processes involved. The flow varies greatly depending on rainfall but also, to a lesser extent, depending on the soil and vegetation. Depending on the model, these factors also decide the specific contribution of groundwater and runoff over time and space. Flow prediction and soil loss are important for assessing soil erosion risks, and for determining suitable land use and soil conservation measures for a watershed. In turn, this can help to maximize the benefits of land use while minimizing the negative impacts of land degradation and other environmental problems.
Conflict of interest
None.
Notes
Peer review under responsibility of National Water Research Center.
References
- ANBT, 2014. Agence Nationale des Barages et Transfert, Bilan d'actvité des barrages algériens.
- K.C.AbbaspourC.A.JohnsonM.T.Van GenuchtenEstimating uncertain flow and transport parameters using as equential uncertainty fitting procedureVadose Zone J.34200413401352
- Abbaspour, K.C., 2005. Calibration of hydrologic models: When is a model calibrated? In: Zerger, A., Argent, R.M. (Eds.), Proc. Intl. Congress on Modelling and Simulation (MODSIM’05), 2449–2455. Melbourne, Australia: Modelling and Simulation Society of Australia and New Zealand.
- K.C.AbbaspourUser Manual for SWAT-CUP, SWAT Calibration and Uncertainty Analysis Programs2007Swiss Federal Institute of Aquatic Science and TechnologyEawag, Dübendorf, Switzerland
- C.D.AlamirewModeling of Hydrology and Soil Erosion in Upper Awash River Basin2006University of Bonn, Institut für Städtebau, Bodenordnung und Kulturtechnikp.235
- J.G.ArnoldP.M.AllenG.BernhardtA comprehensive surface-ground water flow modelJ. Hydrol.14219934769
- J.G.ArnoldR.SrinivasanR.S.MuttiahJ.R.WilliamsLarge area hydrologic modelling and assessment, part 1: model developmentJAWRA34119987390
- J.G.ArnoldD.N.MoriasiP.W.GassmanK.C.AbbaspourM.J.WhiteR.SrinivasanM.K.JhaSWAT: model use calibration, and validationTrans. ASABE55201214911508
- K.BevenA.BinleyThe future of distributed models – model calibration & uncertainty predictionHydrol. Processes631992279298
- H.BriakR.MoussadekK.AboumariaR.MrabetAssessing sediment yield in Kalaya gauged watershed (Northern Morocco) using GIS and SWAT modelInt. Soil Water Conserv. Res.42016177185
- A.L.CollinsD.F.McGonigleMonitoring and modeling diffuse pollution from agriculture for policy support: UK and European experienceEnviron. Sci. Policy11200897101
- A.DemmakContribution à l’étude de l’érosion et des transports solides en Algérie septentrionaleThèse de Dr. Ing1982Université de Pierre et Marie CurieParis XI
- J.de VenteJ.PoesenG.VerstraetenG.GoversM.VanmaerckeA.VanRompaeyC.Boix-FayosPredicting soil erosion and sediment yield at regional scales: where do we stand?Earth Sci. Rev.12720131629
- R.C.EberhartJ.KennedyA new optimizer using particles warm theoryProceedings of the Sixth International Symposium on Microma Chine and Human Science, IEEE Service CenterPiscataway, NJ, Nagoya, Japan19953943
- W.H.GreenG.AmptStudies of soil physics, part I – the flow of air and water through soilsJ. Ag. Sci.41911124
- G.H.HargreavesZ.A.SamaniReference Crop Evapotranspiration from Ambient Air Temperature1985American Society of Agricultural Engineers 12 pp. Availabe at: http://libcatalog.cimmyt.org/download/reprints/97977.pdf
- S.B.HavrylenkoJ.M.BodoqueR.SrinivasanG.V.ZucarelliP.MercuriAssessment of the soil water content in the Pampas region using SWATCatena1372016298309
- M.K.JhaP.W.GassmanChanges in hydrology and stream flow as predicted by a modeling experiment forced with climate modelsHydrol. Processes285201427722781
- T.KassaG.FoerchImpacts of land use/cover dynamics on stream flow: the case of hare watershed, EthiopiaProceedings of the 4th International SWAT 2005 Conference2007
- E.G.MbonimpaY.YuanM.H.MehaffeyM.A.JacksonSWAT model application to assess the impact of intensive corn farming on runoff, sediments and phosphorous loss from an agricultural watershed in WisconsinJ. Water Resour. Prot.42012423431
- Meguenni, K., Ramini B., 2008. Evaluation du débit solide dans le bassin versant de Harraza (Algérie). Larhyss J., ISSN 1112-3680, n° 07, Juin 2008, pp. 7–19.
- J.L.MonteithEvaporation and environmentG.F.FoggThe State and Movement of Water in Living Organisms1965Cambridge University PressCambridge, UK205234
- D.N.MoriasiJ.G.ArnoldM.W.VanLiewR.L.BingnerR.D.HarmelT.L.VeithModel evaluation guidelines for systematic quantification of accuracy in watershed simulationsTrans. ASABE5032007885900
- J.E.NashJ.V.SutcliffeRiver flow forecasting through conceptual models. Part I. A discussion of principlesJ. Hydrol.1031970282290
- S.L.NeitschJ.G.ArnoldJ.R.KiniryJ.R.WilliamsK.W.KingSoil and water assessment tool theoretical documentation—version 2005Soil and Water Research Laboratory, Agricultural Research Service2005US Department of AgricultureTemple
- Nicks, A.D., 1974. Stochastic generation of the occurrence, pattern, and location of maximum amount of daily rainfall. In: Proc (1974). Symp. Statistical Hydrology, Tucson, AZ, USDA Misc. Pub. No. 1275, US Gov. Print. Office, Washington, DC, 1974, pp. 154–171.
- C.H.B.PriestleyR.J.TaylorOn the assessment of surface heat flux and evaporation using large-scale parametersMon. Weather Rev.10019728192
- J.SchuolK.C.AbbaspourCalibration and uncertainty issues of a hydrological model (SWAT) applied to West AfricaAdv. Geosci.92006137143http://arxiv:/www.adv-geosci.net/9/137/2006
- Tixeront, J., 1960. Les débits solides des cours d’eau d’Algérie et de Tunisie Etudes hydrologiques, Serie II, Secrétariat Agricole. Tunis, 31 p.
- US Department of Agriculture, 1972. Soil Conservation Service (USDA-SCS), National Engineering Handbook, Hydrology section, Chapters 4–10.
- J.R.WilliamsSediment routing for agricultural watershedsWater Resour. Bull. Am. Water Resour. Assoc.1151975965974
- Wischmeier, W.H., Smith, D.D., 1978. Predicting Rainfall Erosion Losses – A Guide for Conservation Planning. U.S. Department of Agriculture, Agriculture Handbook 537.
- D.YebdriM.ErrihA.HamletA.El-Bari TidjaniThe water resources management study of the Wadi Tafna Basin (Algeria) using the SWAT modelAfr. Water J.March2007 ISBN 92-1-125089-7
- H.YenM.AhmadiM.J.WhiteX.WangJ.G.ArnoldC-SWAT: the Soil and Water Assessment Tool with consolidated input files in alleviating computational burden of recursive simulationsComput. Geosci.722014221232
- H.M.YesufM.AssenT.AlamirewA.M.MelesseModeling of sediment yield in Maybar gauged watershed using SWAT, northeast EthiopiaCatena1272015191205