
 ?Mathematical formulae have been encoded as MathML and are displayed in this HTML version using MathJax in order to improve their display. Uncheck the box to turn MathJax off. This feature requires Javascript. Click on a formula to zoom.
Abstract
Lands in the Everglades Agricultural Area (EAA) can be used for increased water storage in order to relieve coastal estuaries of excess runoff in the rainy season. The goals of this study were: (1) to quantify the environmental and economic tradeoffs of different water storage scenarios using water tolerant sugarcane cultivars; and (2) to quantify the amount of water storage possible in the EAA under different water storage scenarios. A mathematical model was developed to calculate soil depth, soil subsidence, depth to the water table, and water storage for three different sugarcane cultivars with different water tolerances. The results showed raising water tables on farmlands did have the environmental benefits of reduced soil subsidence, extended farm life and increased years of water storage. In addition, raising water tables in the EAA to increase water storage is overall more costly, but yearly costs are very low. Therefore, water storage on farmlands is an affordable interim method of water storage.
1 Introduction
The South Florida landscape has changed dramatically over the past century. The development of cities, agricultural areas, canals, dikes, levees, roads and other infrastructure has changed historic Everglades hydrology (CitationNRC-CERGEE, 2005). Hydrological modifications for flood prevention in urban and agricultural areas have critically degraded the Everglades ecosystem, which is a unique environment of global importance (CitationHarwell, 1998; CitationMilon et al., 1999). Now, state and federal actions are being undertaken in one of the largest environmental restoration efforts in the world, the “Comprehensive Everglades Restoration Plan (CERP),” to restore the Everglades and surrounding ecosystems of South Florida (CitationComprehensive Everglades Restoration Plan, 2012; CitationMilon et al., 1999). Doing nothing to restore historic hydrologic flows would have far reaching costs that outweigh any perceived savings (CitationClark and Dalrymple, 2003; CitationHaman and Svendson, 2006; CitationNRC-CERGEE, 2005).
Moreover, water storage goals can be achieved more cost-effectively by rethinking how our farming systems operate. For instance, by incorporating the ideas of ecosystem services and multifunctional agriculture – where utilitarian and non-utilitarian values are measured to incentivize environmental conservation in public policy – a production-centered system can transform into a system that serves other functions and needs, enhancing both sustainability and profitability (Citationde Fraiture et al., 2010). Croplands in the Everglades Agricultural Area (EAA) could raise water tables during the growing season to provide the ecosystem service of increasing water storage to help meet CERP restoration goals. EEA lands are prime candidates for increased water storage due to (1) their location south of Lake Okeechobee and north of the Everglades; (2) pre-existing hydrological structures (CitationAillery et al., 2001); and (3) the fact that sugarcane, the primary crop of the EAA, requires large amounts of water (CitationGlaz et al., 2004). Raised water tables on active farmlands would also lead to a better management strategy that would reduce soil oxidation rates, thereby prolonging the economic life of soils and agriculture in the EAA (CitationAillery et al., 2001; CitationHaman and Svendson, 2006; CitationMorris et al., 2004; CitationSnyder, 2004; CitationWright and Snyder, 2009).
This research expands on previous research by CitationAillery et al. (2001) by using newly developed water tolerant sugarcane cultivars to evaluate the costs of increased water storage in the EAA by raising water tables on farmlands. The goals of this study are to quantify the economic and environmental tradeoffs of different water storage scenarios on farmlands using water tolerant sugarcane cultivars, and to quantify the amount of possible water storage in the EAA with these different water table depths. This will allow us to answer the following research questions: (1) What are the measurable environmental benefits, or ecosystem services, of raising water tables on farmlands in the EAA? (2) What are the economic values of the ecosystem services provided by raising the water tables on the farmlands in the EAA?, and (3) Is raising water tables on agricultural lands a more cost effective option than building storage reservoirs on farm lands? Importantly, this study develops an analytical framework for use in future analyses of water storage costs in the EAA.
2 Ecosystem service approaches
The ecosystem service approach aims to measure utilitarian and non-utilitarian values through economic means and thus, provide further incentive for the consideration of environmental issues in public policy (CitationMillennium Ecosystem Assessment, 2005). The underlying idea is that ecosystems function to provide services that are necessary for the well-being and survival of humans. Even though people have become increasingly separated from our natural environments with technology and culture, we are still components of our ecosystems and, consequently, we are dependent upon our environments for the provisioning of ecosystem services. Water management in agriculture provides many opportunities on this front since it is intimately integrated with multiple ecosystems and their various services. A lack of knowledge still exists concerning consequences of past efforts for agricultural water management as well as public perspectives toward water and its allocation, which can differ according to incomes, geography, and availability of water (Citationde Fraiture et al., 2010).
Ecosystem services approaches have previously been used in the Everglades. For example, the Florida Ranchlands for Environmental Services Project (FRESP), funded by the South Florida Water Management District (SFWMD), was the first major project in the region to establish a Payment for Ecosystem Services (PES) program, serving as a model for establishing future programs for crops in the region. All participating ranchers in the program have expressed strong interests in continuing with the scaled-up PES program at the end of the pilot program, which will offer ten-year contracts totaling roughly $43 million with capitol and annual payments (CitationHorne, 2011). The FRESP has shown that farming and Everglades restoration can be mutually compatible. In addition, SFWMD carried on a water storage project in 2013 to benefit the St. Lucie Estuary. This will be a three-year pilot project with Caulkins Citrus Company, who has agreed to capture an estimated 6,780 ac-ft of water annually on 450 acres of fallow citrus land. The SFWMD has agreed to invest $1.2 million for the project, amounting to $76 per ac-ft of water storage each year (CitationSFWMD, 2013). Another storage reservoir, C-43 to be located in Hendry County off of the Caloosahatchee River, will help to meet regional water storage goals in a different way. This reservoir will serve to hold excess overflows from Lake Okeechobee in the wet season, reducing discharges to the Caloosahatchee Estuary, and it will provide necessary water flows during the dry season. This will help restore the damaged ecosystem of the Caloosahatchee estuary. The improved water delivery system will stabilize salinity levels in the Caloosahatchee estuary, thereby improving oyster and fish populations (CitationSFWMD, 2012).
3 Study area
The Florida Everglades ecosystem encompasses about 28,000 km2 beginning with the Kissimmee watershed in central Florida, including Lake Okeechobee and Everglades watersheds, with water flows reaching Florida Bay and the Florida Keys. Defining features of this system are its surface and subsurface connectivity and gentle sheet flows of water across a vast, low relief spatial area. Despite the apparent monotony of the seemingly endless sawgrass plains, a diverse array of plants and animals inhabit the area, notably birds, alligators and tropical hardwood hammocks (CitationHarwell, 1998; CitationHarwell et al., 1996). Established in 1948 and finalized in 1962 (CitationHaman and Svendson, 2006; CitationStone and Legg, 1992), the EAA is the northernmost section of the Florida Everglades (), extending to Water Conservation Area-1 (WCA-1). The EAA comprises 700,000 acres set aside for exclusive agricultural use, and it remains one of the most agriculturally productive areas in the US (CitationStone and Legg, 1992).
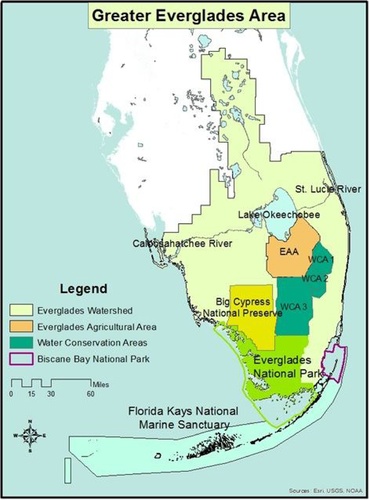
The rich soils of the Everglades made the EAA a natural choice for the agricultural industry. In contrast to the sandy and mineral-laden soils that comprise the majority of Florida, this area is dominated by rich organic soils (histosols) over limestone bedrock. These soils formed over thousands of years from decaying organic matter consisting of predominately sawgrass vegetation. The anoxic conditions of the wetlands prevented aerobic microorganisms from decomposing the organic matter of the soil, which resulted in its net accumulation. Now, due to drainage of the area and soil subsidence, the rate of soil loss exceeds the rate of soil accretion, resulting in soil subsidence (CitationMorris et al., 2004; CitationSnyder, 1994; CitationWright and Hanlon, 2009a, Citation2009b; CitationWright and Snyder, 2009).
4 Mathematical analysis
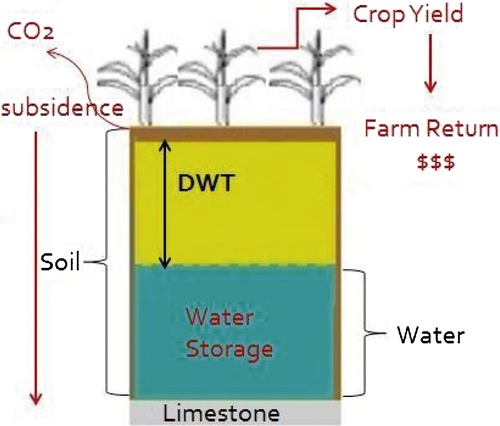
In order to evaluate the economic and environmental tradeoffs of different water table depths on three different sugarcane cultivars with different water tolerances, an integrative model was developed using Microsoft Excel for its accessibility and ease of use. The model calculates soil depth (SD), subsidence rate of soil (SR), depth to the water table (DWT), crop yield (Y), annual return per acre (AR), gross return for a 5,000-acre farm (GR), net return after production costs (NR), net return per acre (NRA), present value net return (PVNR), present value net return per acre (PVNRA), and water storage (WS) for each year of production for a 5,000-acre model farm. The equations used in this model are explained accordingly in the sub-sections below. The independent variables used in the model scenarios include four different SD, three different DWT, and three different sugarcane cultivars (denoted as CP96-1252, CP89-2376 and CP89-2143) for a total of thirty-six different scenarios. To run the model, the independent variables were entered into the spreadsheet – one SD, one DWT and one sugarcane cultivar – and then the model calculated the dependent variables for each year into the future until the soil depth of the farm reached ≤ 6 in. (15 cm), which cannot support sugarcane farming (CitationAillery et al., 2001). This mathematical model demonstrates that as soil depths decrease each year due to subsidence, the volume of water storage in the soil also decreases, eventually reaching 0 when the soil is no longer deep enough to accommodate the constant water table level of either 61 cm, 45 cm or 20 cm. The farm will continue to produce sugarcane after water table levels drop to 0, or until the soil depth reaches ≤ 6 in. (15 cm). A simplified conceptual illustration of the mathematical model is provided ().
Sugarcane production was determined by yield equations for three different sugarcane cultivars. These yield equations were created from experimental data obtained from CitationGlaz and Morris (2010). The independent variable in the equations is DWT. This makes it possible to determine the effects of different water table depths on sugarcane production. The cultivars chosen were CP96-1252, CP89-2376 and CP89-2143.
A 5,000-acre model farm, as opposed to the typical 640-acre model farm, was chosen because: (1) this facilitates mechanical harvesting; (2) it is representative of large-scale economic production; (3) it is closer to current land scenarios than 640-acre farm; and (4) it improves accuracy of cost and return estimates (CitationRoka et al., 2010). Costs and returns for sugarcane farming are assumed to be constant throughout the model and are based on the 2008–2009 production year for a 5,000-acre model farm (CitationRoka et al., 2010).
This model is different from CitationAillery et al.’s (2001) model in that it only looks at one method of water storage – water table detention – and uses three different sugarcane cultivars with different water tolerances instead of using one sugarcane cultivar that is not water tolerant. This model also employs a different method to calculate sugarcane crop yields. Instead of assuming a certain percentage decrease in crop yield due to higher water tables, it also calculates sugarcane yields by using an equation based on water table depth for each cultivar obtained from empirical yield results in CitationGlaz and Morris (2010). For production and production return calculations please see CitationOuellette (2014).
4.1 Soil and subsidence
Four different soil depths were used in the model since the soils of the EAA are not of one uniform depth. The soils tend to be deeper near Lake Okeechobee and get progressively shallower as the distance from the lake increases (CitationSnyder 2004; CitationWright and Hanlon, 2009b). Soil depths were classified into four yield belts (YB) based on the types of soil found in the EAA (CitationSnyder, 2004)- YB1: 130 cm (51 in.), YB2: 112 cm (44 in.), YB3: 71 cm (28 in.), and YB4: 38 cm (15 in.) (CitationAillery et al., 2001; CitationHazen and Sawyer, 1993). According to CitationSnyder et al. (1978) the rate of soil subsidence is directly proportional to the depth of the water table.
Three different DWTs were also chosen: 61 cm (24 in.), 45 cm (18 in.) and 20 cm (9 in.). The 61 cm DWT was used since it is the recommended best management practice (BMP) and is used as the baseline (CitationWright and Hanlon, 2009b). Water table depths of 45 cm and 20 cm were used because these depths were also used in the CitationGlaz and Morris (2010) study from which the cultivars are taken. Based on this, the subsidence rate (SR) for each year is calculated by Eq. (Equation1(1)
(1) )
(1)
(1)
where, DWT is the target DWT for the given scenario and SRi is the initial subsidence rate of 1.5 cm year−1 (0.6 in. year−1). Soil depth (SD) for a given year in each scenario is calculated by subtracting the rate of subsidence from the previous year’s soil depth as in Eq. (Equation2(2)
(2) )
(2)
(2)
where SDi is the previous year’s soil depth and SR is the subsidence rate.
4.2 Water storage
Water storage (WS) is calculated in acre-feet based on the porosity (n) of the soil and the saturated thickness (ST) of the soil, using Eq. (Equation3(3)
(3) ) from CitationFetter (2001):
(3)
(3)
where area is 5,000 acres, ST is saturated thickness of soil (ft) determined by the soil depth minus DWT, and ET is the evapotranspiration rate. A soil porosity of 14% is used based on the 1-in. of water per 7-in. of soil ratio for the EAA (CitationAillery et al., 2001). Evapotranspiration (ET) is taken from CitationOmary and Izuno (1995) at a rate of 93.2 cm year−1 (36.7 in. year−1).
4.3 Water storage costs
The results of present value (PV), net return (NR) and water storage (WS) for each scenario from the mathematical model were used to determine the water storage costs (WSC) using Eq. (Equation4(4)
(4) ). The loss in net returns due to water table increases is the WSC in $/ac-ft. WSC was calculated for each yield model by using scenarios with DWT of 61 cm (24 in.) as the baseline scenario, and dividing difference in PV, NR and WS for each year in all scenarios.
(4)
(4)
where ΔPVNR is the change in present value net return from the baseline scenario and ΔWS is the change in water storage from the baseline scenario.
5 Results and discussion
The mathematical model was run for a total of thirty-six different scenarios. The scenarios included different combinations of three sugarcane cultivars (model 1: CP 96-1252, model 2: CP 89-2376, and model 3: CP 89-2143); four different soil depths (YB1: 130 cm (51 in.), YB2: 112 cm (44 in.), YB3: 71 cm (28 in.) and YB4: 38 cm (15 in.)); and three different water table depths (61 cm (24 in.), 45 cm (18 in.) and 20 cm (9 in.)).
Overall, the model results showed that increases in the DWT extends farm life (total years of production) which subsequently increases the total amount of water storage for the life of the farm. This is because increased water storage decreases the rate of soil subsidence as previous subsidence research has shown (CitationHaman and Svendson, 2006; CitationMorris et al., 2004; CitationSnyder, 2004; CitationWright and Snyder, 2009). In this farm model, soil subsidence slowed from an initial rate of 1.5 cm year−1–0.92 cm year−1 with a DWT of 61 cm. It also slowed from the initial rate of 1.5 cm year−1–0.68 cm year−1 with a DWT of 45 cm and 0.30 cm year−1 with a DWT of 20 cm. Soil subsidence in this mathematical model is the decisive component in extending farm life, increasing total water storage, and the total net returns of the model farm scenarios. However, it is difficult to assess the accuracy of these changes in subsidence rates for each DWT as there is not much empirical research measuring decreases in subsidence rates with different DWTs. This model does support the general theory that soil subsidence across the EAA has slowed due to better water table management practices (CitationHaman and Svendson, 2006; CitationMorris et al., 2004; CitationSnyder, 2004; CitationWright and Snyder, 2009). Farm life and years of water storage for all sugarcane yield models nearly tripled with the DWT decrease from 61 cm DWT to a 20 cm DWT. In yield belt 1, farm life increased from 107 to 371 years, and years of water storage increased from 76 to 367. Consistently, farms with deeper soil depth experienced increased years of production and water storage than farms with shallower soils. In all yield models, no water storage was achieved for yield belt 4 (soil depth 38 cm) on farms with 61 cm and 45 cm DWTs.
5.1 Ecosystem services
The first research question for this study aimed to quantitatively measure the benefits of the increased water storage and soil retention for different water table levels on agricultural land in the EAA. This was done by finding the differences in soil subsidence, water storage and farm life for the various water table depths in the model farm scenarios created by the mathematical model. These results are summarized in . The type of sugarcane cultivar had no effect on these ecosystem services across the scenarios because these ecosystem services are dependent on DWT, soil depth and soil subsidence. Different yield models serve to determine the economic costs of these ecosystem services and this is analyzed and discussed in Section 5.2. Therefore, these ecosystem services were measured by finding the differences and percent changes of scenarios with DWT of 45 cm (18 in.) and 20 cm (9 in.) from the baseline DWT of 61 cm (24 in.). Farm life is used as a measure of soil retention since land is no longer farmable when soil depth reaches ≤ 6 in. (15 cm) (CitationAillery et al., 2001).
Table 1 Summary of ecosystem services for different DWTs and soil depths.
Farms with deeper soil depths experience longer farm lives and, consequently, more years of water storage. No water storage was achieved on farmlands with a soil depth of 38 cm because the target DWT exceeds the depth of the soil. The differences and percent changes from the baseline DWT of 61 cm (24 in.) are shown in and . Farm life is extended by 36–40% in scenarios with DWT of 45 cm (18 in.) and 247–306% in scenarios with DWT of 20 cm (9 in.) which aligns with previous research indicating that increased water tables will slow the rate of soil subsidence (CitationAillery et al., 2001; CitationHaman and Svendson, 2006; CitationMorris et al., 2004; CitationSnyder, 2004; CitationWright and Snyder, 2009).
Table 2 Ecosystem services differences from DWT of 61 cm.
Table 3 Ecosystem services percent increases from DWT of 61 cm.
In a previous study by CitationAillery et al. (2001) more soil retention occurred in deeper soils (soil depths 130 cm and 112 cm) due to the fact that lands with shallower soils limit water table levels. Yet according to this research, although lands with deeper soils did experience the longest farm lives and the greatest increases in farm life, the greatest percent increases in farm life from the baseline DWT of 61 cm occurred in the shallower soils. This could be due to the shallower soils that experience a greater percentage increase in farm life with no water storage on farmlands causing subsidence to occur at a faster rate. When higher water tables on these shallower soils are maintained, the years of water storage substantially increase and consequently the rate of soil subsidence substantially decreases. Water table increases had a significant effect on water storage and years of water storage, especially in scenarios with a DWT of 20 cm (8 in.).
5.2 Ecosystem service costs
The second research question this study addressed was about the economic values associated with increased water storage and reduced soil subsidence, caused by raising the water tables on farmlands in the EAA. The economic price of increased water storage for each yield model was calculated as the difference in present value net return divided by the difference in water storage for each year. Yearly water storage costs were then summed to get total water storage costs for the entire life of the farm. The cost of reduced soil subsidence was calculated for each yield model by finding the difference in total PVNR from the baseline scenario of 61 cm DWT for different water table scenarios.
Summaries of water storage cost results are shown in –. Overall, yield model 2 (CP 89-2376) has the highest water storage costs. When DWT is 20 cm and soil depth 130 cm, yield is highest at $184,874 ac-ft. While in general, yield model 3 (CP 89-2143) has the overall lowest water storage costs, the lowest water storage cost of $1,588/ac-ft is actually in yield model 1 (CP 96-1252) at DWT 20 cm and soil depth of 20 cm. This scenario also has the lowest average cost for water storage, at $26/ac-ft, and the lowest minimum cost for water storage at $-99/ac-ft. All of the yield model scenarios with soil depths of 20 cm achieved no water storage at DWT 45 cm, and at DWT 20 cm water storage was the cheapest for that particular yield model. These results also illustrate that farms with soils of 38 cm or less may not be appropriate for increased water storage on lands since those soils can only accommodate very shallow water tables.
Table 4 Summary of water storage costs for yield model 1.
Table 5 Summary of water storage costs for yield model 2.
Table 6 Summary of water storage costs for yield model 3.
It was unexpected that yield model 3, the non-water tolerant cultivar, had the lowest overall water storage costs and that yield model 2, the “middle-of-the-road performer,” had the highest water storage costs, Yield model 3 had the lowest overall present value net returns for all scenarios, but more importantly, it had the lowest difference in present value net returns between water table scenarios. On the other hand, yield model 1 had the highest present value net returns for all scenarios and the biggest difference in present value net returns between water table scenarios. Since water storage cost was determined by taking the difference of present value net returns and dividing by water storage, the yield models with the lowest difference in present value net returns had the lowest water storage costs (see CitationOuellette, 2014)
This finding has implications for the sugarcane breeding programs. If the most water tolerant sugarcane cultivars are intended to have a lower impact on farms’ net returns when raising water table levels on fields, then these results show that sugarcane cultivars with less variability in yield for different water table depths are the better choice. Using sugarcane cultivars that have higher production but a large variability in yields at different water table depths (and thus higher water storage costs) does not give farmers much incentive to raise water table levels on fields.
Water storage costs per year for a 5,000-acre farm range from a maximum of $6,291/ac-ft in yield model 2 to a minimum of $-99/ac-ft in yield model 1. Water storage costs become negative when the farm life of scenarios with DWT 45 cm and DWT 20 cm last longer than the farm life of the baseline scenarios at DWT 61 cm. Yield models 1 and 2 experienced years of negative water storage costs, but yield model 3 never had years with negative water storage costs, even though yield model 3 had the lowest overall water storage costs. The lowest water storage costs for yield model 3 were $0/ac-ft.
The economic price of reduced soil subsidence was calculated by finding the difference in PVNR from the baseline for different water table scenarios for the life of the farm. The results are shown in –. Farms ended up losing profits over the long term rather than increasing profits from extending the life of the farm by reducing soil subsidence. This is because profits in the future are discounted by the PV discount rate of 2% multiplied by each year in the future which makes profits further in the future worth less than profits nearer in the future. Therefore, even though profits are gained in the far future from extended farm life, they are not enough to make up for the lost profits in the nearer future from increased water storage.
The water storage costs over the life of the farm for each yield model and DWT are provided ( and ). Since the cost of water storage was not constant throughout the years of water storage in the farm scenarios, it is useful to visualize when the highest and lowest costs for water storage occur. If this were ever implemented on farms, farmers would need to know how these water storage costs would influence their net return over time. The trends for all of the figures showed that water storage costs were initially the highest and decreased as time progressed. Two interesting things happen in the figures. First, at some point in time, the water storage costs drop sharply. This represents the point in time where the years of water storage for that scenario outlasted the years of water storage for the baseline scenario. Mathematically when this happened, the difference in water storage per year became much higher since the water storage for the baseline scenario became 0 ac-ft. At the same time, the difference in present value net return was declining, but at the same rate as before, since both farms were still producing sugarcane. These changes to the numbers suddenly caused the cost of water storage for each year to become relatively very low, often in the hundred-dollar range. Secondly, at a later point in time, the costs became $0 or negative. This happened because the baseline farm scenario with a DWT of 61 cm (24 in.) was no longer producing sugarcane and had $0 net return. Mathematically, the difference in net return became drastically lower or negative when the farm life of the baseline scenario ended. At that point, water storage costs nothing or essentially pays out to the farmer.
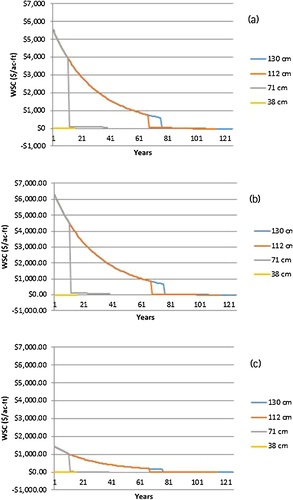
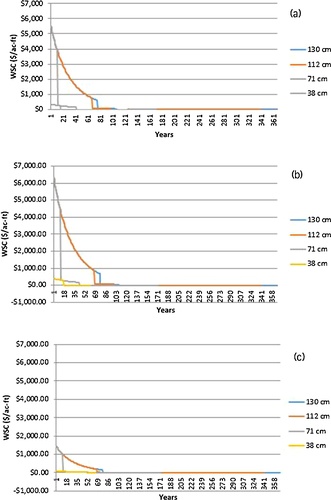
There were also two distinct trends for all models with water table depths between 45 cm and 20 cm. In scenarios with 20 cm DWTs, the farm life lasted much longer than the baseline scenario and experienced more years of very low or $0 water storage costs compared to scenarios with 45 cm DWTs. This is due to the decrease in soil subsidence as a result of raising water table levels in these scenarios.
This research showed that income losses decrease over time from increased water tables and can even realize profits. However, results in CitationAillery et al. (2001) showed that income losses increase over time as a consequence of increased water tables. Their research cites that decreases in production returns stem from reduced yields, increased water table management costs, and cropland loss from soil subsidence. A reason for the discrepancy in this study’s results and CitationAillery et al.’s (2001) may be due to the fact that their analysis is applied to the entire EAA as opposed to one 5,000-acre farm.
5.3 Water on agriculture lands versus storage reservoir
The third research question in this study addressed whether raising water tables on agricultural lands is a more cost-effective option than building storage reservoirs on farmlands. This was done by comparing the costs of water storage to the costs of the C-43 Reservoir since this reservoir water delivery system would be managed similarly to water storage on agricultural lands. In comparison to the C-43 Reservoir costs of $3,409/acre, the total costs of water storage on agricultural lands are much higher. There are only two scenarios that have lower total costs for water storage: yield model 1 (CP 96-1252), when soil depth is 38 cm and DWT is 20 cm ($1,588), and yield model 3 (CP 89-2143), when soil depth is 38 cm and DWT is 20 cm ($2,345). However, water storage prices per year are very low. According to this analysis of water storage costs for yield model 3, it would cost farmers an average of $350/acre per year to raise water tables to 45 cm. This low price shows that this is an option worth exploring, especially when funding is not available for land purchases or while waiting for the completion of storage reservoirs.
Most importantly, raising the water tables on agricultural lands for increased water storage could not be a permanent solution. Increased water tables on agricultural lands could only be maintained for about 100 years on average (minimum of 0 years to a maximum of 367 years). However, using this as an interim solution now to one hundred years into the future may lead to other future options.
There is also the possibility of additional costs for increasing water tables on agricultural lands. Farmers could face troubles when trying to maintain higher water tables in fields adjacent to farms or fields that have lower water tables. This would create a hydraulic head that would drive water to shallower water tables. It is possible that increased pumping would be necessary to maintain higher water tables, which would be an added expense to farmers and consequently slightly raise the cost of water storage in fields.
6 Conclusions
More water tolerant sugarcane cultivars are more productive and capable of much higher yields in all water table scenarios modeled in this study. However, the results also showed that although water tolerant sugarcane cultivars did have higher yields and higher net returns, the cost of raising water tables on agricultural fields with water tolerant cultivars was in fact more than water storage costs with non-water tolerant cultivars.
Results from this analysis showed that annual water storage costs on farmlands are competitive with the costs of storage reservoirs. Increased water storage on farmlands would be a relatively short-term solution compared to building water storage areas. On the other hand, water storage on farmlands could be a more favorable option if funds for storage reservoirs and land purchases are not readily available.
Finally, the study is limited by the different assumptions made. These were based on applicable studies and suggestions by the experts in the field. Manipulating different factors will yield different results, as with any other study. Future research is needed in other areas to design sustainable farming systems in South Florida capable of providing multiple ecosystem services. These future directions for research may include the effect of increased water storage on water quality and nutrient loads, the design of appropriate ecosystem valuation models, and the engineering aspects of irrigation systems.
Notes
Peer review under responsibility of National Water Research Center.
References
- M.AilleryR.ShoemakerM.CaswellAgriculture and ecosystem restoration in South Florida: assessing trade-offs from water-retention development in the Everglades agricultural areaAm. J. Agric. Econ.832001183195
- A.L.ClarkG.E.Dalrymple$7.8 billion for Everglades restoration: why do environmentalists look so worried?Popul. Environ.242003541569
- The Comprehensive Everglades Restoration Plan CERP: The Plan in Depth2012 Retrieved April 2012 http://www.Evergladesplan.org/about/rest_plan_pt_03.aspx. (Accessed 1 April 2012)
- C.de FraitureD.MoldenD.WichelnsInvesting in water for food, ecosystems, and livelihoods: an overview of the comprehensive assessment of water management in agricultureAgric. Water Manage.972010495501
- C.W.FetterApplied Hydrogeologyfourth ed.2001Prentice Hall, Inc.Upper Saddle River, New Jersey
- B.GlazD.R.MorrisS.H.DaroubPeriodic flooding and water table effects on two sugarcane genotypesAgron. J.962004832838
- B.GlazD.R.MorrisSugarcane response to water-table depth and periodic floodAgron. J.1022010372380
- D.Z.HamanM.SvendsonManaging the Florida Everglades: changing values, changing policiesIrrig. Drain. Syst.202006283302
- M.A.HarwellJ.F.LongA.M.BartuskaJ.H.GentileC.C.HarwellV.MyersJ.C.OgdenEcosystem management to achieve ecological sustainability: the case of South FloridaEnviron. Manage.201996497521
- M.A.HarwellScience and environmental decision making in South FloridaEcol. Appl.81998580590
- Hazen, Sawyer, 1993. Twenty Year Evaluation: Economic Impacts from Implementing the Marjory Stonman Douglas Everglades Restoration Act and United States verses SFWMD Settlement Agreement. Prepared for South Florida Water Management District, Contract No. C-4157.
- ChrisHorneBuck Island Ranch and the Florida Ranchlands Environmental Services Project. Series: Farm of the Future Project2011EcoAgriculture PartnersWashington, D.C
- Millennium Ecosystem AssessmentEcosystems and Human Well-being2005 http://www.maweb.org/en/Framework.aspx. (Accessed 15 April 2012)
- J.W.MilonA.W.HodgesA.RimalC.F.KikerF.CaseyPublic Preferences and Economic Values for the Restoration of the Everglades/South Florida Ecosystem. Economics Report 99-11999Food and Resource Economics Department, University of FloridaGainesville, FLp.124
- D.R.MorrisB.GlazS.H.DaroubOrganic soil oxidation potential due to periodic flood and drainage depth under sugarcaneSoil Sci.1692004600608
- NRC-CERGEE (National Research Council Committee on Restoration of the Greater Everglades Ecosystem)Re-engineering Water Storage in the Everglades: Risks and Opportunities2005The National Academies PressWashington, DC
- K.OuelletteAgriculture, Environmental Restoration and Ecosystem Services: Assessing the Costs of Water Storage on Agricultural Lands in South Florida2014University of South FloridaTampa, FLhttp://scholarcommons.usf.edu/etd/5090/
- M.OmaryF.T.IzunoEvaluation of sugarcane evapotranspiration from water table data in the Everglades agricultural areaAgric. Water Manage.271995309319
- F.M.RokaL.E.BaucumJ.AlvarezCosts and Returns for Sugarcane Production on Muck Soils in Southern Florida 2008–2009. EDIS SC0882010Institute of Food and Agricultural Sciences, University of FloridaGainesville, FL
- SFWMDCaloosahatchee River (C-43) West Basin Storage Reservoir2012 http://www.sfwmd.gov/portal/page/portal/xrepository/sfwmd_repository_pdf/spl_caloos_c43_reservoir.pdf. (Accessed 15 March 2014)
- SFWMDNews Release SFWMD Water Farming Pilot Project to Benefit St. Lucie Estuary2013 http://www.sfwmd.gov/portal/page/portal/xrepository/sfwmd_repository_pdf/nr_2013_0819_water_farming.pdf. (Accessed 20 August 2013)
- G.H.SnyderH.W.BurdineJ.R.CrockettG.J.GaschoD.S.HarrisonG.KidderJ.W.MishoeD.L.MeyerF.M.PateS.F.ShihWater Table Management for Organic Soil Conservation and Crop Production in the Florida Everglades. Bull. 8011978University of Florida/IFAS Agric. Exper. Stn.Gainesville, FL
- G.H.SnyderSoils of the EAAA.B.BottcherF.T.IzunoEverglades Agricultural Area (EAA): Water, Soil, Crop, and Environmental Management1994University Press of FloridaGainesville, FL2741
- Snyder, G.H., 2004. Everglades Agricultural Area Soil Subsidence and Land Use Projections. Prepared for the South Florida Water Manage. Dist., West Palm Beach, FL. http://www.Evergladesplan.org/pm/projects/project_docs/pdp_08_eaa_store/pdp_08_sub_land_use_report.pdf. (Accessed 10 April 2012)
- J.A.StoneD.E.LeggAgriculture and the EvergladesJ. Soil Water Conserv.471992207215
- A.L.WrightE.A.HanlonMeasuring Organic Matter in Everglades Wetlands and the Everglades Agricultural Area. EDIS SL 2852009Institute of Food and Agricultural Sciences, University of FloridaGainesville, FL
- A.L.WrightE.A.HanlonSoil Structure in the Everglades Agricultural Area Histosols: Effects on Carbon Sequestration and Subsidence. EDIS SL3012009Institute of Food and Agricultural Sciences, University of FloridaGainesville, FL
- A.L.WrightG.H.SnyderSoil Subsidence in the Everglades Agricultural Area. Vegetarian Newsletter2009Everglades Research and Education Center, Soil and Water Science Department Issue 551