
 ?Mathematical formulae have been encoded as MathML and are displayed in this HTML version using MathJax in order to improve their display. Uncheck the box to turn MathJax off. This feature requires Javascript. Click on a formula to zoom.
Abstract
Irrigation projects in Egypt have been facing tremendous challenges, mostly is the scarcity of irrigation water. The current research presents the effect of different cohesive admixture on the conductivity of siliceous sand in general and its other geotechnical properties. Two different types of conventional swelling clay from (Toshka, 6th of October) as well as bentonite were used to construct the irrigation canals and embankment. The results indicated that increase in the plasticity properties of the treated soil also decrease the permeability and infiltration. Moreover, the dry density of 2.08 t/m3 was obtained from sand and 20% 6th of October mixture, also the CBR of 31.20% were obtained from sand and 8% 6th of October mixture. Increasing the bentonite ratio increases the cohesion and decreasing the permeability. The swelling ratios of sand 6th of October Clay mixture is equal to 0.28%, and the fictitious stress at which the swelling ratio is nil, is equal to 16 kPa.
1 Introduction
Plastic mixtures used for soil improvement to increase the earth slopes stability, and decrease the permeability of the excavated water channels. Furthermore, the study focused on examining a possible treatment technique through carrying out an experimental program to improve the geotechnical performance of siliceous sands by mixing with cohesive different admixtures, namely two different types of conventional swelling clay and bentonite, and to account for the optimum mixing ratios. CitationAlbusoda and Salem (2012) used cement kiln dust (CKD) to stabilize Affek dune sand. Moreover, the effectiveness of adding different mixing ratios of (CKD) was studied. Adding of 8% CKD, for example, increased the ultimate bearing capacity of shallow foundation to 250%. The variation in shear strength parameters became almost constant after fourteen days of curing. CitationFattah et al. (2016) concluded that the treatment with Lime-Silica Fume Mix shows a general increase in the maximum dry density. CitationWayal et al. (2012) investigate the use of bentonite and lime in stabilizing dune sands for possible uses in geotechnical engineering. Wherein, the bentonite added to the mix was helping in making a cohesive bond in the mixture. Furthermore, the results showed some improvements in unconfined compression strength with addition of 15% bentonite and 3% lime. Further addition of bentonite and lime in dune sand causes difficulties in the compaction process as the mix becomes sticky. The minimum values of unconfined compressive strength were found in the mixture 5% bentonite and 1% lime. CitationAksoy and Gor (2011) studied on sand dunes properties are stabilized by using Portland cement, fly ash and silica fume. In order to find out which additive caused maximum dry density, soil samples were prepared by using four different replacement amounts of 0%, 3%, 5% and 10% by weight of soil. Maximum dry densities and optimum moisture contents were determined for all mixtures. It is concluded that dune samples have adequate density when compacted with 10%. CitationSharma and Trivedi (2016) studied the shear strength parameters of sandy silt soil by blending with fly ash in different proportion. Soil is mixed with fly ash at 5%, 10%, 15%, and 20%. It was concluded that the Optimum Water Content increases and Dry Density decreases with increases in fly ash due to progressive increasing silt particles in soil. The shear strength of the soil enhance due to presence of fly ash. So, fly ash has a potential to improve engineering characteristics of sandy silt soil. CitationElmashad and Tetsuya (2006) concluded that the bentonite is an effective material for improving the plasticity properties, where it increased the liquid limit, plastic limit and the OMC, but the maximum dry density and the CBR ratio were decreased. Bentonite should have been used in small amount to keep plasticity, CBR, and economy, and hence 5% or less was recommended through the experiments. CitationPanwar and Ameta (2013) studied the strength characteristics of dune sand of western Rajasthan stabilized with cheap and readily available material like lime and bentonite. The investigation was an attempt to stabilize this soil with the aid of lime and bentonite. Standard Proctor test, unconfined compressive strength, in addition to some preliminary tests was conducted for assessing the suitability of lime bentonite mix with dune sand. Review of the literature shows that many previous studies assessed the geotechnical behavior of dune sands stabilized using many cementitious admixtures as cement, cement kiln dust (CKD) and lime, whereas there is paucity of data regarding the geotechnical behavior of treated dune sands stabilized with swelling clay. Furthermore, this research discusses the possibility of using cohesive admixtures as a stabilizing agent to the dune sands (CitationHafez et al., 2010). Sand itself cannot be used as a base or sub-base material for road construction, for it is susceptible to move by wind and water, and its shows non-plastic activity (CitationElmashad and Hashad, 2013). Soil improvement is one of the most economic engineering solutions to overcome soil problems.
2 Materials
2.1 The sand samples
The sand samples used in this study were obtained from a natural deposit located at Abu Rawash, 28 Km Cairo-Alexandria Desert road, second industrial zone, 8 km to the North of Giza, Egypt. The area lies between Latitude 29° 40′ 15″ N and Longitude 31° 14′ 1″ E. The soil samples used for this study were collected at average depths of 0.5–1.0 m by the method of disturbed sampling.
2.2 The used admixtures characteristics
Siliceous sands stabilization using cohesive admixtures may be considered an effective and economic alternative for global stability of the mixtures, increasing the CBR value, and lowering the permeability. In this study, several clay admixtures, of different mineralogy, were used namely two different types of conventional clay and bentonite.
The first admixture used is Toshka conventional clay where obtained from a natural formations at Toshka, 256 km to the upstream of Aswan High Dam, New valley in Upper Egypt from about 1.50 m depth. The soil formation extended from the surface up to 30 m depth is clayey soil. The second admixture used is 6th of October conventional clay where was obtained from a natural deposits at 6th of October city, Giza Governorate in Egypt taken from about three meter depth. The area lies between Latitude 29° 59′ 32″ N and Longitude 30° 58′ 10″ E. Moreover, the third admixture used is bentonite, industrialized, which presents very strong colloidal characteristics and its volume increases several times when coming into contact with water, creating a gelatinous fluid. The used bentonite is delivered from Borg El Arab; Alexandria in Egypt.
For the used Toshka clay it composed from 66% Montmorillonite clay, and 30% Kaolinite clay also the physical and chemical properties are as follow, free swelling is about 100%, liquid limits (L.L) are about 84%, plasticity limit (P.L) are about 33%, and plasticity index (P.I) are about 51%, the total dissolved salts is about 2150 parts per million.
Also for the 6th of October clay it composed from 70% Montmorillonite clay, and 20% Kaolinite clay also the physical and chemical properties are as follow, free swelling is about 160%, liquid limits (L.L) are about 92%, plasticity limit (P.L) is about 40% and plasticity index (P.I) is about 52%, the total dissolved salts is about 1840 parts per million.
Finally for the bentonite it is composed from 93% Montmorillonite clay, and 1% Kaolinite clay also the physical and chemical properties are as follow, free swelling is about 270%, liquid limits (L.L) is about 365%, plasticity limit (P.L) is about 45% and plasticity index (P.I) is about 320%, the total dissolved salts is about 2374 parts per million.
Moreover, the total dissolved salts for the used Abu Rawash sand is about 150 parts per million. Physical properties and mineralogy of the used admixtures are summarized in and .
Table 1 Physical properties of the used admixtures.
Table 2 Minerals of the natural tested sand and the used admixtures.
3 Results and discussion
3.1 Geotechnical properties of the natural soils
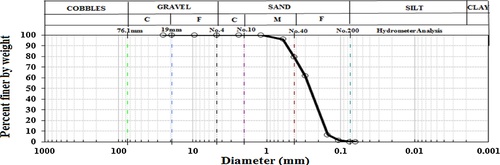
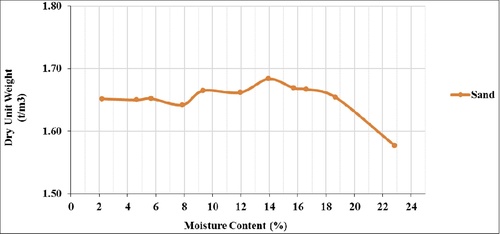
According to the USCS classification system, the natural soil used in this research was classified as poorly graded uniform sand with mean diameter D50 = 0.28 mm, effective diameter D10 = 0.16 mm uniformity coefficient Cu = 1.87 and coefficient of curvature Cc = 0.88. Mechanical properties such as CBR, maximum dry density, were identified in accordance with the approved procedure of CitationASTM (D422–63, CitationD1557, and CitationD1883), the resultant values are 5.0%, 1.68 t/m3 respectively at optimum moisture content of 14.0%. In addition, consolidated monotonic undrained triaxial test. The friction angle of the sand is 36.
However, gradation curve and the above identified properties are presented in –.
3.2 Identification of the natural soil improved with the cohesive admixtures
3.2.1 Effect of fines type and fines content on the physical properties of the mixtures
The liquid limit tests, the plastic limit tests and the free swell tests for identification the geotechnical properties of the soil improved with cohesive admixtures were carried out according to (CitationASTM D 4318, 2010), CitationASTM D 4546–14, 2014, respectively.
The index properties of the natural soil improved with the cohesive admixtures are shown in –. For the Toshka mixtures, 6th of October mixtures and bentonite mixtures “mixing ratios are 4%, 8%, 12%, 16%, and 20%” with sand, the liquid limits range of the different mixtures are between (20 to 55), (21 to 63) and (30 to 98), respectively and the plasticity Indexes of the same mixtures range between (3 to 27), (4 to 36) and (12 to 62), respectively. Moreover, for the same mixtures the free swell ranges between (10 to 40), (30 to 60) and (60 to 220), respectively.
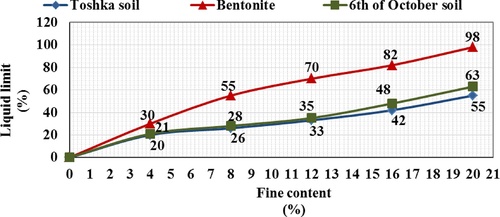
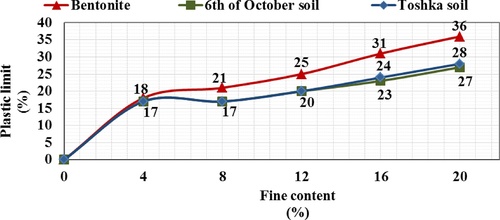
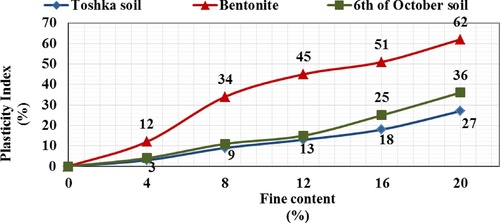
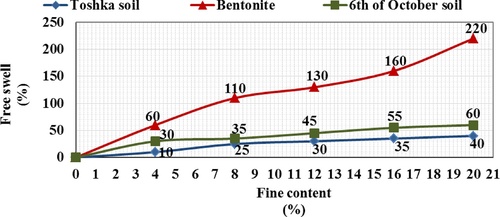
Furthermore, a gradual increase was shown in Atterberg’s limits and free swelling by increasing the mixing ratio of the cohesive admixtures. Also, the maximum Atterberg’s limits of the plastic mixtures were noticed for the bentonite mixtures. Also increasing the clay content decreases the permeability of the mixture and this leads to keep water in the canal with out loose.
3.2.2 Measured data of compaction test
The modified proctor tests were applied for the tested mixtures to investigate the geomechanical behavior of the improved soil. The results of tests are plotted in – and are summarized in . For the Toshka mixtures, 6th of October mixtures and bentonite mixtures “mixing ratios are 4%, 8%, 12%, 16%, and 20%” with sand, the maximum dry density ranges between (1.90 t/m3 to 2.03 t/m3), (1.88 t/m3 to 2.08 t/m3) and (1.96 t/m3 to 2.05t/m3), respectively, with an optimum moisture content ranges between (11.0% to 13.3%), (8.4% to 10.7%) and (6.5%to 13.65%). respectively. Increasing the dry density increases the global stability and decreasing the permeability.
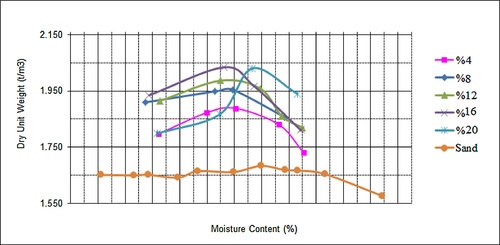
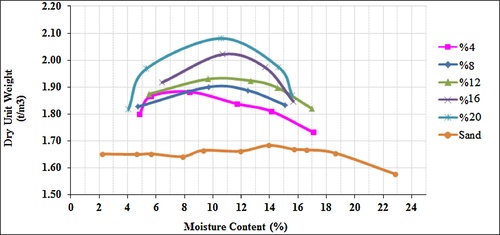
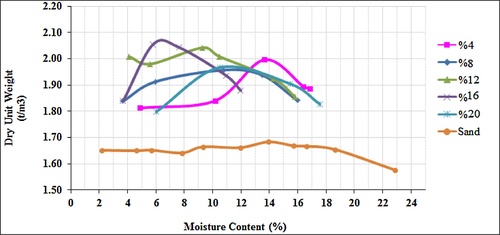
Table 3 Modified proctor compaction relationship for natural and improved soils.
It is obvious that a gradual increase was shown in maximum dry density by increasing the mixing ratio of any cohesive admixtures. This increase ratio in maximum dry density is found due to the filling of voids in the natural sand by the fine cohesive admixtures up to a certain limit (when clay content equal to the void ratio of the natural sand) and any excess of the clay content after this limit leads to a decrease in maximum dry density.
Furthermore, increasing the mixing ratio of bentonite more than 16% leads to a slightly decrease in maximum dry density. This decrease is regarding to the high activity of bentonite which enables the montmorillonite clay to be as a domain for this mixture.
3.2.3 Measured data of California bearing ratio (CBR) test
The CBR test was conducted for the tested mixtures compacted at O.M.C according to (CitationASTM D1883, 2007). For the Toshka mixtures, 6th of October mixtures and bentonite mixtures “mixing ratios are 4%, 8%, 12%, 16%, and 20%”, the CBR values range between (5.1 to 18.5), (6.8 to 31.2) and (8.3 to 30.2), respectively. The results of tests are plotted in –.
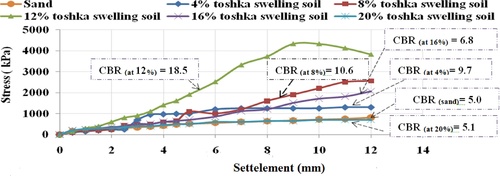
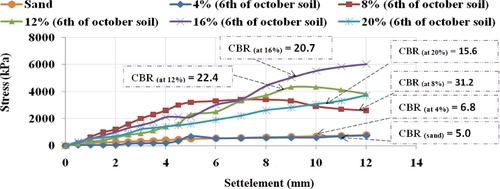
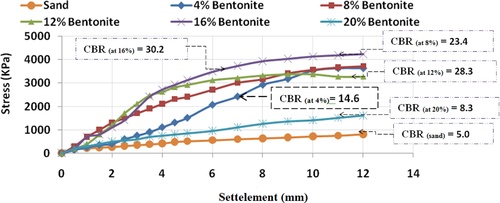
It is noticed that the CBR values of the all improved mixtures are higher than it in a pure natural soil. A gradual increase in CBR values of Toshka mixtures, 6th of October mixtures and bentonite was shown by increasing the mixing ratios of them up to 12%, 8% and 16%, respectively to the natural soil.
3.2.4 Measured data of monotonic triaxial testing
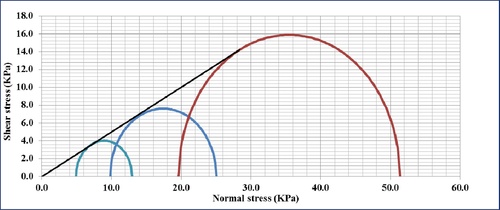
A series of isotropic consolidated monotonic Undrained triaxial tests were conducted on the mixtures compacted at O.M.C under three levels of confining pressures (50, 100 and 200 kPa) to study the shear parameters of them. The tests were carried out following (CitationASTM D4767-02, 2002).
For the Toshka mixtures, 6th of October mixtures and bentonite mixtures “mixing ratios are 4%, 8%, 12%, 16%, and 20%” with sand, the cohesion strength values range between (0.196 kPa to 2.744 kPa), (0.196 kPa to 3.724 kPa) and (0.49 kPa to 5.782 kPa), respectively. Moreover, the friction angle values range between (25° to 36°), (31° to 36°) and (18° to 29°), respectively. The results of tests are plotted in –.
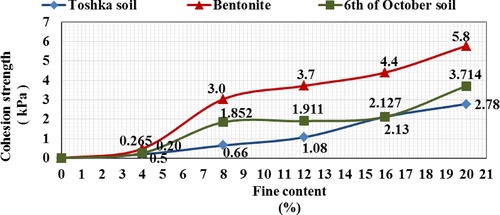
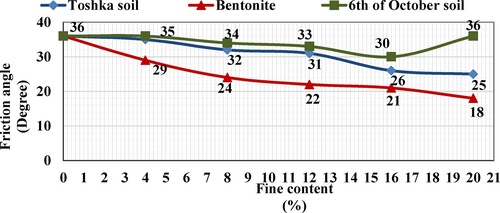
It is obvious that a gradual increase was shown in cohesion strength by increasing the mixing ratio of any cohesive admixtures especially in bentonite mixtures. On the other hand, a gradual decrease was shown in friction angle by increasing the mixing ratio of any cohesive admixtures especially also in bentonite mixtures. It was found that this increase in cohesion strength of mixtures increases by increasing the liquid limit and activity of the admixtures. Also increasing the cohesion of the mixtures leads to increase of the stability of the mixtures and to be effective mixtures to use in the canal embankments construction materials.
3.2.5 Measured data of consolidation test
Oedometer test was performed on cohesive mixtures according to (ASTM D2435-04, 2004). Consolidation curves of the tested mixtures are plotted in –. It is noticed that a gradual decrease in void ratio values of Toshka mixtures, 6th of October mixtures and bentonite was shown by increasing the mixing ratios of them to the natural sand up to 16%, 12% and 8%, respectively. On the other hand, any more of these admixtures content than these limits (16%, 12% and 8%, respectively) increased gradually the void ratio values of the treated mixtures and makes a high volume change between loading and unloading conditions. This decrease in void ratios (when mixing ratios less than the previous limits) is found regarding to increasing the clay to be equal to the void ratio of the natural sand and any excess of the clay content after these limits leaded to an increase in void ratio and high compressibility. Wherein, the clay became a domain component of these mixtures.
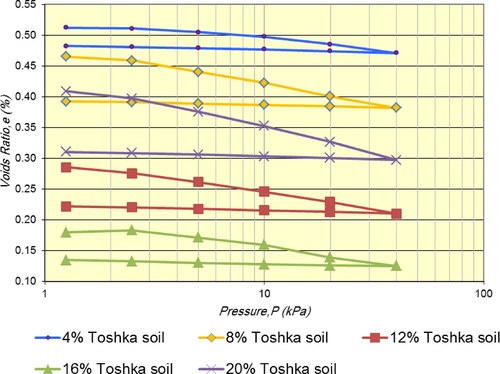
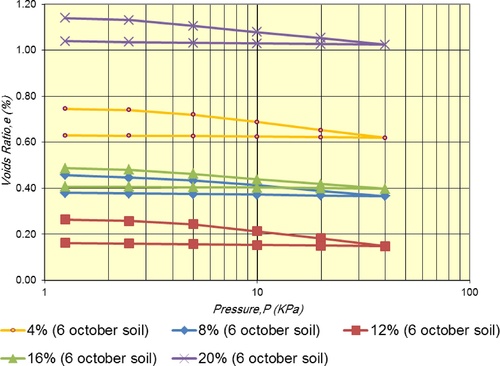
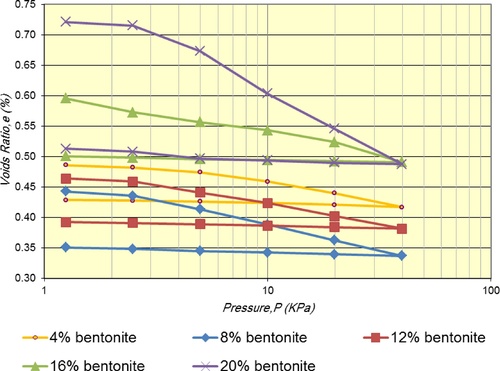
For Toshka mixtures, 6th of October mixtures and bentonite smooth curves with small changes of void ratios in loading or unloading conditions under different loads are observed for stable dense samples containing low cohesive admixtures content up to certain limits 16%, 12% and 8%, respectively. These limits are proportional inversely with the Atterberg’s limits of the used admixtures. Furthermore, minimum limit 8% is recorded for bentonite mixture which has higher Atterberg’s limits than the other two admixtures (Toshka soil, 6th of October soil).
3.2.6 Standard 1-D swelling test (Odoemeter)
Swelling in Odometer tests were performed in a standard one-dimensional odometer apparatus as per CitationASTM D 2435 (2004). The sand clay mixtures were compacted in a fixed stainless steel odometer ring with an internal diameter of 75 mm and with height equal to 20 mm. Three samples were tested for each case under stress increments of 10 kPa, 20 kPa and 30 kPa. The stress increment was applied to the mixtures and sustained until the vertical movement has stopped. Water was then added to the cell and the swelling was recorded with time. The swelling ratio is expressed by the percentage of the total heave (swell) to the initial sample's height.(1)
(1)
The results of the swelling ratio are presented in for the cases of sand bentonite mixtures of 20, 16, 12% of bentonite, also sand with 20% from Toshka Clay, and sand with 20% from 6th of October Clay. The Swelling ratio of the sand bentonite mixtures submerged with distilled water were equal to 1.75%, 1.15%, and 0.42% respectively. Also for sand Toshka Clay mixtures, sand 6th of October Clay mixture, the swelling ratios are equal to 0.35%, and 0.28% respectively. To estimate the fictitious stress at which the swelling ratio is nil, shows that the required stresses are 35 kPa, 28 kPa, 21 kPa, 16 kPa, and 16 kPa for samples sand bentonite mixture, sand Toshka Clay mixture, and sand 6th of October Clay mixture respectively.
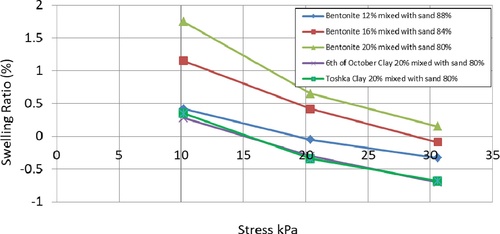
We conclude that from above that the bentonite has the highest fictitious stress, also the Toshka Clay mixtures, and sand 6th of October Clay mixture has the minimum values.
3.2.7 Measured data of permeability test
Permeability tests were performed on the mixtures according to CitationASTM D5084-16a (2016). As shown in that a gradual decrease in the permeability values of Toshka mixtures, 6th of October mixtures and bentonite by increasing the mixing ratios of them to the natural sand. Where the mixtures increases from 4, 12, and 20% the permeability values decreases from about 9.04E-06 cm/s to 2.68E-07 cm/s.
Table 4 Permeability values of the improved soils.
4 Conclusions
The present study deals with the geotechnical behavior of poorly graded siliceous sand mixed with different types of cohesive admixtures, namely two different types of conventional swelling clay (Toshka swelling soil, 6th of October swelling soil),and bentonite. Different mixing ratios, mixing ratios are 4%, 8%, 12%, 16%, and 20%, with sand are used in this study to investigate the recommended proper value of admixtures. The following conclusions can be offered based on the tests results:
| 1. | A gradual increase in Atterberg’s limits of the used plastic mixture was shown by increasing the mixing ratio of the swelling soils between 4–20% to the natural siliceous sand. | ||||
| 2. | The maximum liquid limit and plastic limit of the plastic mixtures was noticed for the bentonite mixtures. | ||||
| 3. | A gradual increase in maximum dry density ( | ||||
| 4. | For bentonite mixtures, a gradual increase in maximum dry density ( | ||||
| 5. | A gradual increase in CBR values of Toshka mixtures, 6th of October mixtures and bentonite was shown by increasing the mixing ratios of them up to 12%, 8% and 16%, respectively to the natural siliceous sand. Any more of these admixtures than these limit (12%, 8% and 16%, respectively) decreased the CBR values of the improved mixtures because they became clayey mixtures. | ||||
| 6. | Cohesion strengths of the used plastic mixture increased by increasing any cohesive admixtures content between 4–20% to the natural siliceous sand. Moreover, the maximum increase ratio in cohesion strengths was found in bentonite mixtures due to its high liquid limit and activity. | ||||
| 7. | Increasing the cohesion of the mixtures leads to increase of the stability of the mixtures and to be effective mixtures to use in the canal embankments construction materials. | ||||
| 8. | A gradual decrease in friction angle was shown by increasing the mixing ratio of any cohesive admixtures used between 4–20% to the natural siliceous sand. Moreover, the maximum decrease ratio in friction angle was found in bentonite mixtures due to its high activity. | ||||
| 9. | A gradual decrease in void ratio values of Toshka mixtures, 6th of October mixtures and bentonite was shown by increasing the mixing ratios of them to the natural sand up to 16%, 12% and 8%, respectively. | ||||
| 10. | A gradual decrease in the permeability values of Toshka mixtures, 6th of October mixtures and bentonite by increasing the mixing ratios of them to the natural sand. | ||||
| 11. | The Swelling ratio of the sand with 20%, 16%, 12% with bentonite submerged with distilled water were equal to 1.75%, 1.15%, and 0.42% respectively. | ||||
| 12. | The fictitious stress at which the swelling ratio is nil are 35 kPa, 28 kPa, 21 kPa, 16 kPa, and 16 kPa for samples sand bentonite mixture, sand Toshka Clay mixture, and sand 6th of October Clay mixture respectively. | ||||
| 13. | For water channels construction, the recommended proper values are 16%, 12% and 8%, respectively to be used as a lining from Toshka mixtures, 6th of October mixtures and bentonite, respectively. Wherein, the main target in such kind of earthworks applications is lowering the permeability. | ||||
| 14. | For roads embankment construction, the recommended proper value of Toshka mixtures, 6th of October mixtures and bentonite is (12%, 8% and 16%, respectively) to be used as a base and sub base. Wherein, the main objective in such kind of earthworks applications is increasing the stability of the embankment. | ||||
Notes
Peer review under responsibility of National Water Research Center.
References
- H.S.AksoyM.GorStabilization of dune sand by using various materials4th Geotechnical SymposiumCukurova University, Adana, Turkey2011622628
- B.S.AlbusodaL.A.SalemStabilization of dune sand by using cement kiln dust (CKD)J. Earth Sci. Geotech. Eng.212012131143
- ASTM D 422-63Standard Test Method for Particle-size Analysis of Soils2002ASTM International
- ASTM D 4767Standard Test Method for Consolidated Undrained Triaxial Compression Test for Cohesive Soils2002ASTM International
- ASTM D 2435Standard Test Method for One Dimensional Consolidation Properties of Soils Using Incremental Loading2004ASTM International
- ASTM D1883Standard Test Method for CBR (California Bearing Ratio) of Laboratory-Compacted Soils2007ASTM International
- ASTM D1557Standard Test Methods for Laboratory Compaction Characteristics of Soil Using Modified Effort2009ASTM International
- ASTM D 4318Standard Test Methods for Liquid Limit, Plastic Limit, and Plasticity Index of Soils2010ASTM International
- ASTM D 4546Standard Test Method for One Dimensional Swell or Collapse of Soils2014ASTM International
- ASTM D5084-16aStandard Test Method for Permeability of Soils2016ASTM International
- M.ElmashadH.TetsuyaUse of dune sand with fly ash, bentonite, and slag powder for road constructionInternational Conference on Solid Waste Management in Developing CountriesKathmandu, Nepal2006
- M.ElmashadA.HashadImproving the strength of sandy silt soils by mixing with cement kiln dustInt. J. Sci. Eng. Res.41220137885
- M.Y.FattahH.H.JoniA.S.A.Al-DulaimyCompaction and collapse characteristics of dune sand stabilized with lime-silica fume mixEarth Sci. Res. J.20220161118
- H.HafezM.ElmashadN.RadwanUse of sand with fatty acid distillation residuals for embankments construction6th International Engineering and Construction Conference (IECC’6)Cairo, Egypt2010130142
- P.PanwarN.K.AmetaStabilization of dune sand with bentonite and limeElectron. J. Geotechn. Eng.18201326672674 Bund. M
- R.SharmaM.K.TrivediImprovement of shear strength of sandy silt soil by mixing optimum percentage of fly ashInt. J. Res. Appl. Sci. Eng. Technol. (IJRASET)4VIII2016503511
- A.S.WayalN.K.AmetaD.G.PurohitDune sand stabilization using bentonite and limeJ. Eng. Res. Stud. (JERS)IIII20125860