
Abstract
Norovirus is estimated to cause 677 million annual cases of gastroenteritis worldwide, resulting in 210,000 deaths. As viral gastroenteritis is generally self-limiting, clinical samples for epidemiological studies only partially represent circulating noroviruses in the population and is biased towards severe symptomatic cases. As infected individuals from both symptomatic and asymptomatic cases shed viruses into the sewerage system at a high concentration, waste water samples are useful for the molecular epidemiological analysis of norovirus genotypes at a population level. Using Illumina MiSeq and Sanger sequencing, we surveyed circulating norovirus within Australia and New Zealand, from July 2014 to December 2016. Importantly, norovirus genomic diversity during 2016 was compared between clinical and waste water samples to identify potential pandemic variants, novel recombinant viruses and the timing of their emergence. Although the GII.4 Sydney 2012 variant was prominent in 2014 and 2015, its prevalence significantly decreased in both clinical and waste water samples over 2016. This was concomitant with the emergence of multiple norovirus strains, including twoGII.4 Sydney 2012 recombinant viruses, GII.P4 New Orleans 2009/GII.4 Sydney 2012 and GII.P16/GII.4 Sydney 2012, along with three other emerging strains GII.17, GII.P12/GII.3 and GII.P16/GII.2. This is unusual, as a single GII.4 pandemic variant is generally responsible for 65–80% of all human norovirus infections at any one time and predominates until it is replaced by a new pandemic variant. In sumary, this study demonstrates the combined use of clinical and wastewater samples provides a more complete picture of norovirus circulating within the population.
Introduction
Next-generation sequencing (NGS) is a new and rapidly evolving technology that facilitates the simultaneous sequencing of large amounts of genetic material. Over the past decade, NGS has advanced and revolutionised pathogen genomic sequencing, with increased turnaround times and outputs, generating more data at much lower per base costs. Owing to the availability and cost-effectiveness of NGS, it can be used as a tool to study viral genetic diversity in waste waterCitation1.
Molecular epidemiological studies of norovirus are usually performed with clinical samples collected from patients presenting at medical facilities. However, this is not representative of the whole norovirus population and is biased towards severe symptomatic cases, thus offering only a narrow picture of the complete viral diversity. Community norovirus infection and prolonged shedding results in high levels of norovirus in waste waterCitation2,Citation3, making waste water a useful medium for population-based, epidemiological scale, enteric virus surveillance.
Norovirus is a leading cause of acute viral gastroenteritis (AGE) among people of all age groupsCitation4. Norovirus-associated outbreaks commonly occur in closed environments such as nursing homes, hospitals, childcare centres and cruise shipsCitation5. Institutional outbreaks of viral gastroenteritis are difficult to control and have significant global economic burden to public healthcare systems (USD $4.2 billion) and communities (USD $60.3 billion) each yearCitation6.
Norovirus is transmitted from person-to-person, mainly through the faecal-oral route. It is highly infectiousCitation7 and transmission is aided by its stability in the external environment. Clinical symptoms of norovirus infection include diarrhoea, vomiting, nausea, headaches, chills and abdominal cramps, usually lasting 2 to 4 daysCitation8. Severe and persistent symptoms can be experienced in vulnerable populations including children, immunocompromised individuals and the elderlyCitation9.
Norovirus is a non-enveloped, 27–35 nm virion, which contains a positive sense, single-stranded RNA genome of ~ 7500 nucleotides (nt). The Norovirus genus is classified within the Caliciviridae family and can be divided into seven genogroups (GI–GVII), and further separated into more than 40 genotypes, based on the amino acid sequence of the full-length capsid regionCitation10. GI, GII and GIV have been shown to infect humans; however, viruses from GII genotype 4 (GII.4) are responsible for pandemics and 65–80% of all norovirus infections globallyCitation11,Citation12. Norovirus GII.4 evolution is driven through the generation of genetic variants, by antigenic drift and shift (recombination), leading to the emergence of novel and potential pandemic viruses approximately every 2–3 yearsCitation13. Amino acid divergence in the P2 protruding domain of the capsid (VP1) contributes to the emergence of these viruses through escape from herd immunityCitation13,Citation14. Another important mechanism driving the evolution and emergence of norovirus is recombination, with the breakpoint usually found at the ORF1/ORF2 overlap region, which separates the non-structural and structural regions of the genomeCitation15.
Six distinct norovirus GII.4 variants have been associated with pandemics of AGE over the past two decadesCitation15,Citation16. Pandemic variants are distinguished based on the complete full-length capsid amino acid sequences, where more than 5% amino acid divergence is considered indicative of a new pandemic variant. GII.4 pandemic variants are named based on the location first identified, followed by the year. The GII.4 pandemic variants include the following: US 1995/96Citation17, Farmington Hills 2002Citation18, Hunter virus 2004Citation19, Den Haag 2006bCitation12, New Orleans in 2009Citation20 and, in early 2012, Sydney 2012. The GII.4 Sydney 2012 variant was first identified in March 2012 in AustraliaCitation21,Citation22 and originated through recombination between the GII.4 Osaka 2007 variant and GII.4 Apeldoorn 2008Citation13.
Despite the predominance of norovirus GII.4, several non-GII.4 strains are also an important cause of norovirus infections. In the 2014/2015 winter in Southeast Asia, a sudden increase in gastroenteritis was observed, as the GII.17 Kawasaki strain emergedCitation23,Citation24. However, this trend was not observed in North America or Europe, with only a low reported prevalence of GII.17 infectionsCitation25,Citation26. In addition, norovirus GII.3 appears to have a major role in childhood infections and has been the capsid genotype most frequently associated with children for the past few decadesCitation27. These strains are often recombinants, in particular the GII.3 capsid is often associated with a GII.P21 ORF1 (GII.P21/GII.3)Citation27, formerly termed GII.Pb/GII.3Citation28.
Continuous surveillance of circulating norovirus genotypes in the community is essential to better understand the evolution and diversity of norovirus. Only through early identification of potential pandemic variants can sufficient warning be provided to public health sectors, to implement infection control measures. These include isolation of infected individuals, community health warnings and education for robust hygiene and decontamination practices. Therefore, we examined the molecular epidemiology of circulating norovirus from clinical samples collected in Australia and New Zealand (NZ) from July 2014 to December 2016, to monitor current epidemic strains, to identify emerging pandemic variants and to characterise recombinant viruses. Using NGS (Illumina MiSeq platform), the diversity of norovirus in waste water was monitored at a city-based population scale in both Sydney and Melbourne, Australia. The changing patterns of prevalent strain emergence were compared with those found in clinical samples with a particular focus on the timings of viral emergence. This study highlights the importance of multiple sample types for a more complete understanding of the norovirus diversity at a population level and establishes the relationship between clinical and waste water findings.
Materials and methods
Ethics statement
University of New South Wales (UNSW) Human Research Ethics Advisory Panel reviewed and approved the ethics application for this study (HC16826 and HC17459).
Clinical specimen collection and outbreak identification
All samples were collected between July 2014 and December 2016. For Australia, clinical specimens were collected as part of routine diagnostic services requested by clinicians or public health agencies. A total of 285 norovirus positive clinical samples (New South Wales (NSW) = 270, Australian Capital Territory (ACT) = 10, Queensland (QLD) = 5) were collected from public and private laboratories. Samples were collected from sporadic gastroenteritis cases and outbreaks. For NZ, clinical samples were collected as part of the NZ Ministry of Health norovirus outbreak surveillance programme. Samples were referred to the Norovirus Reference Laboratory at the Institute of Environmental Science and Research by diagnostic community or hospital laboratory, or directly through public health agencies. At least one sample from each gastroenteritis outbreak that was positive for norovirus (n = 497) was genotyped. An outbreak is defined when two or more cases are linked by time, location or food sources, and confirmed to be the same genotype. All other samples are categorised as sporadic gastroenteritis cases.
Waste water sample collection
Influents of Bondi and Malabar waste water treatment plants (WWTPs) from Sydney, Australia (250 mL), and Western Treatment Plants in Werribee, Melbourne (1 L) (population capacities of 296,350, 1,667,460 and 2,400,000, respectively), were collected each month from January to December 2016. All samples were delivered to UNSW on the day of collection and stored at – 80 °C upon arrival.
Viral concentration and RNA extraction
For clinical samples collected in Australia, 20% (v/v) suspensions in water were prepared. Viral RNA extraction was performed using QIAamp Viral RNA mini kit (Qiagen, Hilden, Germany) following manufacturer’s instructionsCitation12. For clinical samples collected in NZ, 20% (v/v) suspensions were prepared and clarified with chloroform as previously describedCitation29. Viral RNA extraction was performed using the Roche Viral Nucleic Acid Extraction Kit (Roche, Basel, Switzerland) in accordance to the manufacturer’s instructions.
Waste water samples (12 mL) were centrifuged at 9400 × g at room temperature for 15 min to remove debris. The supernatant was ultra-centrifuged at 186,000 × g at 4 °C for 1.5 h to concentrate virus and the pellet resuspended in 100 µL of phosphate-buffered saline. Viral RNA extraction was performed using QIAamp Viral RNA mini kit (Qiagen)Citation12.
MS2 process control
MS2 bacteriophage was used as extraction and process control for Australian clinical and waste water samples. MS2 is a useful control when spiked into clinical and environmental samples to validate all downstream processes including viral RNA nucleic acid extraction, reverse transcription and PCR amplificationCitation30. MS2 was prepared as 20 µL frozen aliquots with a concentration of 2.57 × 10⁵± 1.61 × 10⁵ genome copies of viruses, which produced a cycle threshold (ct) value of 16.26 ± 1.6 when spiked into clinical and waste water samples (n = 40).
RT-PCR of norovirus RNA from clinical and waste water samples
For Australian clinical samples, norovirus detection was first performed using reverse-transcription PCR (RT-PCR) targeting the 5′-end of capsid gene (region C) of norovirus GI and GII, as described previouslyCitation13. Sequence from the 5′-end of norovirus capsid gene allows differentiation of genogroups and genotypes, and the primers used have previously been shown to be able to amplify and distinguish a wide range of genotypesCitation31,Citation32. For the detection of potential recombinant norovirus GII strains in Australia, a 575 bp region spanning the ORF1/ORF2 overlap was amplifiedCitation33. Full-length norovirus genomes from three samples collected from NSW were amplified as described in Eden et al.Citation21. For NZ samples, a norovirus GI and GII duplex RT-quantitative PCR followed by either a norovirus GI or GII RT-PCR that spanned the norovirus region B (within ORF1) and region C, across the ORF1/2 overlap, was used for genotyping as described previouslyCitation29. PCR products were purified and sequenced as previously describedCitation29.
To assess antigenic variation within the capsids of circulating strains, the full-length capsid gene sequences of representative GII.2, GII.3 and GII.4 strains were amplifiedCitation21.
In preparation for MiSeq sequencing of waste water amplicons, a second-round PCR was performed to attach Illumina sequencing adapters; this was carried out in accordance to the manufacturer’s protocol. With the addition of Illumina overhang adapters, the final amplicon size is 373 bp. All PCR amplicons were cleaned up using Agencourt AMPure XP beads (Beckman Coulter, California, USA).
Full-length norovirus genome sequencing preparation
For the norovirus full-length genome sequencing of six QLD samples, a second method was used. RNA was extracted from a 10% (v/v) faecal suspension using QIAamp viral RNA extraction kit (Qiagen). DNase Heat&Run (ArcticZymes, Tromsø, Norway) was used to remove host and other contaminating DNA. First-strand cDNA was prepared using Protoscript II kit (New England Biolabs, Massachusetts, USA) followed by second-strand DNA synthesis using a cocktail of Escherichia coli DNA ligase, DNA polymerase I and RNase H (NEB).
Nextera XT library preparation for NGS
Illumina libraries were prepared using the Nextera XT DNA sample preparation kit and quantified using the Quant-iT PicoGreen dsDNA assay kit. The fragment sizes were evaluated using Tape Station D1000 (Agilent Technologies, California, USA). Libraries generated from waste water and three NSW strains were submitted to Ramaciotti Centre for Genomics (UNSW) for paired-end sequencing on the Illumina MiSeq platform using a v2 300 cycle kit (2 × 150 bp). For the six QLD strains, libraries were sequenced using the v2 mid-output kit on a NextSeq 500 machine in the Public Health Virology Laboratory, QLD.
Norovirus phylogenetic analysis
Phylogenetic analyses of the partial polymerase (172 bp) and capsid regions (282 bp) were used to determine norovirus GII genotypes identified in clinical samples. For GI genotypes, 172 bp and 223 bp of partial polymerase and capsid regions were used for phylogenetic analysis. Polymerase and capsid sequences were aligned separately using MUSCLE and compared with known reference sequences using maximum likelihood phylogenetic analysisCitation34 and confirmed with an online genotyping tool (NoroNet)Citation35.
NGS data analysis
Sequences were removed if they did not range between 200 and 320 bp. The paired-end sequences were merged and aligned to norovirus reference sequences. A minimum of two representative reference sequences of each norovirus genotype were used. The parameters were as default for the Geneious mapper, v 9.0.5 (Geneious software R9, Biomatters, Auckland, New Zealand) and medium sensitivity was used for reference mapping and virus identification. The number of reads aligned to each reference genotype was used to quantify the abundance of each respective genotype within waste water samples. The proportion representation of each genotype was then calculated by dividing the number of reads attributed to the genotype over the total number of sequencing reads.
Identification of recombination breakpoints
Assembly of the reads generated from nine norovirus full-length genome sequencing was performed using Geneious software R9, by mapping reads to norovirus reference sequences. The full-length genome consensus sequences were then analysed using SimPlot (v3.5) to identify recombination breakpointsCitation36.
Results
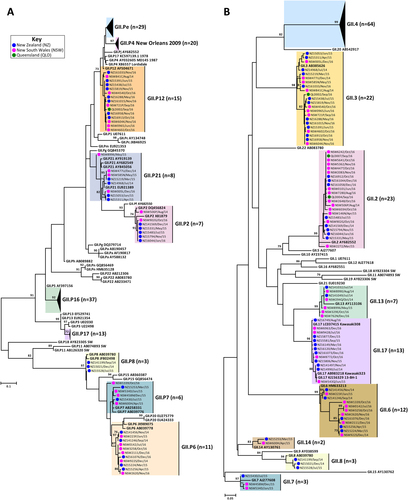
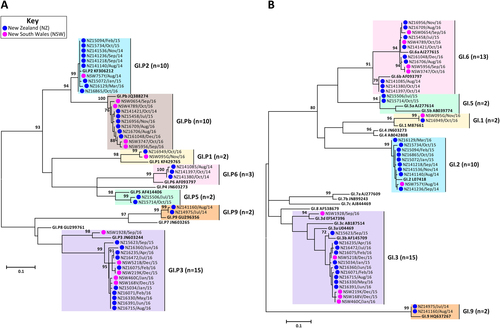
The prevalence of circulating norovirus GI and GII genotypes in Australia and NZ were determined in this study, which included a total of 782 norovirus-positive specimens. Of these, 285 norovirus-positive samples were collected from Australia (NSW, ACT and QLD), of which 238 were associated with sporadic cases and 47 were linked to outbreaks. In NZ, 497 laboratory-confirmed norovirus outbreaks, where representative samples were successfully genotyped, were included in this study (Table ). Polymerase and capsid genotypes were determined by phylogenetic analysis of sequences using the maximum-likelihood methodCitation34 and confirmed using database searches (Table ). To compare the identified norovirus sequences, a subset of 89 Australian (GI = 11 and GII = 78) and 104 NZ (GI = 33 and GII = 71) representative sequences were selected for phylogenetic tree construction (Figs. and ).
Total number of norovirus genotypes identified in Australia and NZ from July 2014 to December 2016
Representative norovirus GII strains isolated in clinical samples (n = 149/686) were analysed phylogenetically. Strains analysed are denoted with a bullet (•) and colour-coded to show sample origin (pink = NSW, blue = NZ and green = QLD). Sample names contain the geographical location and time of collection. Reference strains were downloaded from GenBank and labelled with their genotype and accession number. a Phylogenetic analysis of 172 bp of the 3′-end of the polymerase gene of norovirus GII viruses. b Phylogenetic analysis of 282 bp from the 5′-end of the capsid gene of norovirus GII viruses. The scale bar indicates the number of nucleotide substitutions per site. Sequence alignments were performed using the MUSCLE algorithm. Maximum likelihood phylogenetic trees were produced with MEGA 7 softwareCitation59 and bootstrap tests (1000 replicates) based on the Kimura two-parameter modelCitation60. The bootstrap percentage values are shown at each branch point for values ≥ 70%
Representative norovirus GI strains isolated in clinical samples (n = 52/83) are shown in this phylogenetic analysis. Strains analysed in this study are denoted with a bullet (•) and colour-coded to show sample origin (pink = NSW and blue = NZ). All sample names contain the geographical location and time of collection. Reference strains were downloaded from GenBank and labelled with their genotype and accession number. a Phylogenetic analysis of 172 bp of the 3′-end of the polymerase gene of norovirus GI viruses. b Phylogenetic analysis of 223 bp of the 5′-end of the capsid gene of norovirus GI viruses. The scale bar indicates the number of nucleotide substitutions per site. Sequence alignments were performed using the MUSCLE algorithm. Maximum likelihood phylogenetic trees were produced with MEGA 7 softwareCitation59 and bootstrap tests (1000 replicates) based on the Kimura two-parameter modelCitation60. The bootstrap percentage values are shown at each branch point for values ≥ 70%
Norovirus GII.4 distribution in Australia and New Zealand
A decline in the prevalence of GII.Pe/GII.4 Sydney 2012 was observed over the study period in both Australia and NZ (Fig. ). Specifically, in Australia in 2014 (July to December), the Sydney 2012 variant represented 74.0% of all noroviruses, which decreased to 37.5% in 2015 and only accounted for 10.8% of noroviruses in 2016 (Table and Fig. ). This was also observed in NZ, with the Sydney 2012 variant responsible for 56.7% of norovirus outbreaks from July to December 2014, 46.6% in 2015 and 16.0% in 2016 (Table and Fig. ).
a The prevalence of norovirus genotypes identified in Australia during the study period. A total of 238 individual norovirus cases and 47 outbreaks were sequenced and genotyped from Australia (NSW, ACT and QLD). b All samples collected, sequenced and genotyped from New Zealand represented viruses from 497 separate outbreaks. Samples with unknown capsid genotypes and mixed GI/GII infections were excluded in this analysis (n = 14). c The monthly norovirus genotypic distribution for Australia and New Zealand combined throughout the study period (2014–2016) was examined. Different genotypes and GII.4 variants are colour-coded as per the legends. All norovirus GI viruses identified are grouped together under GI (dark grey) and others include all GII viruses identified (GII.P2/GII.2, GII.Pe/GII.2, GII.P7/GII.6, GII.P7/GII.7, GII.P16/GII.13 and GII.P21/GII.13) that are not indicated in the legends. d The monthly number of institutional outbreaks reported to the NSW Ministry of Health, Australia
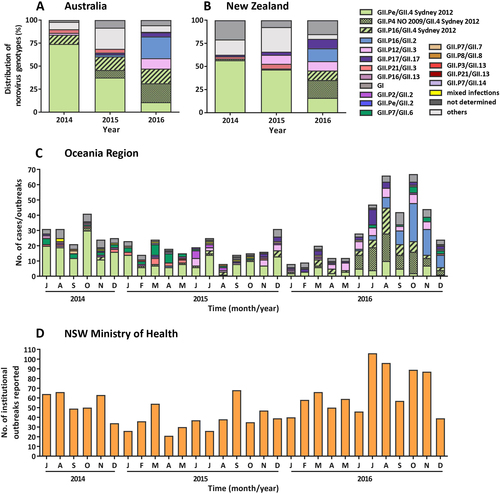
Although the GII.Pe/GII.4 Sydney 2012 variant itself exhibited a rapid decline over the study’s time frame, viruses with a Sydney GII.4 capsid remained prevalent throughout 2016, representing 47.2% and 45.5% of the total norovirus population in Australia and NZ, respectively (Fig. ). This was resultant of the two newly emerged GII.4 Sydney-derived recombinant forms. The first recombinant, GII.P16/GII.4 Sydney 2012, was initially identified in 2015 in Australia and accounted for 14.6% and 15.9% of norovirus identified in 2015 and 2016, respectively. It was the third most predominant norovirus in circulation in 2016 (Fig. ). Although this recombinant first emerged in August 2015 in NZ, the next outbreak associated with GII.P16/GII.4 Sydney 2012 was not identified until April 2016 and accounted for only 10.2% of outbreaks in 2016 (Fig. ). The second Sydney recombinant detected, GII.P4 New Orleans 2009/GII.4 Sydney 2012 (GII.P4 NO 2009/GII.4 Sydney 2012), emerged in Australia in May 2015 and represented 8.3% of cases, which increased to 20.5% in 2016 (Fig. ).
Similarly, in NZ, the GII.4 NO 2009/Sydney 2012 strain, emerged in February 2013 (with two outbreaks)Citation33, was the predominant (36/187, 19.3%) norovirus detected in outbreaks in 2016. Of these 35 outbreaks, 23 were identified in nursing homes or hospital wards between July and September 2016. The second most frequently detected norovirus was the GII.Pe/GII.4 Sydney 2012 variant (30/187, 16.0%) (Fig. ). The emergence of these new viruses was accompanied by an increase in institutional outbreaks of gastroenteritis reported to the NSW Ministry of Health, particularly during the winter period (June–August) of 2016 (Fig. ).
Other emerging noroviruses
The GII.17 Kawasaki strain was first identified in June 2015 in Australia (Table ) and accounted for 2.1% of 2015 norovirus cases and 4.6% in 2016, including one outbreak (Table and Fig. ). In NZ, the GII.17 strain was identified in April 2014 and was responsible for 1.7% (n = 3) of all outbreaks that year, followed by 3.4% in 2015 and 10.2% in 2016 (Table and Fig. ).
Full-length genome sequences of novel noroviruses viruses identified in this study and their reported outbreak dates
In addition to the GII.4 Sydney recombinants, a novel GII.P16/GII.2 recombinant emerged in Australia in April 2015 (Table ). Its prevalence steadily increased in 2016, accounting for 23.6% of all noroviruses detected that year, including three outbreaks (Table and Fig. ). In NZ, this recombinant was first identified from an outbreak in March 2016, and that year the strain accounted for 13.9% of all norovirus outbreaks (Table and Fig. ).
The GII.P21/GII.3 recombinant, often associated with childhood infections, was seen in Australia in both 2014 (4.0%) and 2015 (4.2%); however, it only accounted for one case in 2016 (Fig. ). This trend was also observed in NZ, where it accounted for 7.6% of all outbreaks in 2014/15 (of which 63.6% were associated with childcare facilities) but had disappeared by June 2015 (Fig. ). In Australia, concomitant with the GII.P21/GII.3 decline, a second emerging virus (GII.P12/GII.3) was identified in 2016 (11.3% of cases) and was largely associated with childhood infections (20/22 cases). This virus was identified in NZ in 2015 (9.7% of outbreaks) and 2016 (10.2% of outbreaks). In contrast, only one-third of those outbreaks occurred in childcare centres, with the majority in long-term care facilities (48.6%).
Genogroup I norovirus
In Australia, GI accounted for only 5.5% of all norovirus cases, with four different GI capsid genotypes identified. Norovirus GI.3 (n = 7/16) and GI.6 (n = 7/16) were the most common, followed by GI.2 (n = 1/16) and GI.1 (n = 1/16) (Table and Fig. ). In comparison, norovirus GI was more prevalent in NZ and accounted for 13.3% of the 497 norovirus-associated outbreaks. A total of six wild-type GI strains were identified; GI.P3/GI.3 as the most prevalent (22/66, 33.3%), followed by GI.P2/GI.2 (21/66, 31.8%) and GI.P6/GI.6 (7/66, 10.6%) (Table ). A recombinant strain, GI.Pb/GI.6, was also identified in four outbreaks (Table ).
Outbreak settings in Australia and New Zealand
A total of 544 norovirus-associated AGE outbreaks were identified during the study period. In Australia, norovirus GI (all GI.6) and GII were responsible for 4 and 43 outbreaks, respectively (NSW = 37 outbreaks, ACT = 7 and QLD = 3) (Table and Fig. ), whereas in NZ norovirus GI and GII were responsible for 66 and 426 outbreaks, respectively, with the genogroup of 5 outbreaks not determined (Table and Fig. ). In NZ, GI outbreaks were caused by GI.P3/GI.3 (33.3%), followed by GI.P2/GI.2 (31.8%) and GI.Pb/GI.6 (12.1%).
The pandemic Sydney 2012 variant was the most commonly detected outbreak virus in both Australia (18/47, 38.3%) and NZ (180/497, 36.2%), across the 2.5-year study period. In Australia, the second most prevalent outbreak strain was the new GII.P16/GII.4 Sydney 2012 recombinant (23.4%), whereas GII.P4 NO 2009/GII.4 Sydney 2012 was the second most common outbreak virus in NZ (7.8%) (Table ).
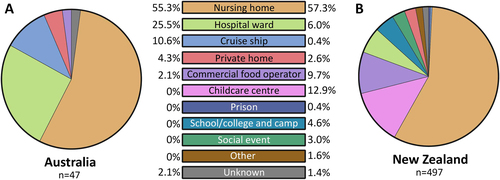
The majority of outbreaks were reported in nursing homes in both Australia (55.3%) and NZ (57.3%) (Fig. ). In Australia, hospital wards were the second most common setting for reported norovirus outbreaks (12/47, 25.5%), followed by cruise ships (5/47, 10.6%) and private homes (2/47, 4.3%) (Fig. ). In NZ, a wider range of outbreak settings were identified, with childcare centres as the second most common setting (64/497, 12.9%), followed by commercial food operators (48/497, 9.7%) (Fig. ). Eight (1.6%) outbreaks were identified as mixed GI and GII genotypes infection, all detected in NZ.
The setting for norovirus outbreaks was compared between Australia and New Zealand during the study period. A total of 47 and 497 outbreaks were identified in Australia and New Zealand, respectively. An outbreak is defined as two or more cases linked by location and time
Recombination breakpoint identification in norovirus full-length genomes
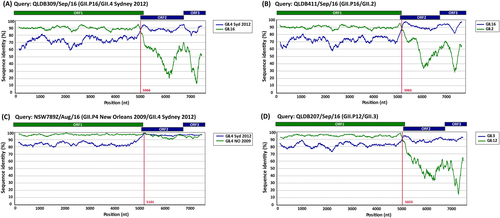
To further characterise clinically important strains, nine norovirus full-length genomes of representative viruses were analysed using Simplot to identify recombination breakpoints (Fig. ). The consensus sequences of norovirus-assembled reads were used for each virus with coverage ranging between 8.2 × 10⁶ and 10.4 × 10⁶. This analysis revealed that both GII.17 viruses were shown to be wild-type viruses with between 99.5% and 99.7% identity to the prototype GII.17 Kawasaki-323 sequence. The other five viruses analysed were either intra-genotypic (GII.Pe/GII.4 Sydney 2012 and GII.P4 NO/GII.4 Sydney 2012) or inter-genotypic (GII.P16/GII.4 Sydney 2012, GII.P16/GII.2 and GII.P12/GII.3) recombinants with breakpoints identified at the ORF1/ORF2 overlap between nucleotide positions 5023 and 5101 (Fig. ).
Representative sequences of emerging viruses were subjected to full-length genome sequencing and analysed using Simplot for the identification of recombination breakpoints. For all recombinant strains, a single breakpoint was identified at the ORF1/ORF2 overlap region. a Simplot for recombinant strain GII.P16/GII.4 Sydney 2012 (QLDB309/Sep/16, GenBank accession number KY905335) with a breakpoint identified at nucleotide position 5066. b Simplot for recombinant strain GII.P16/GII.2 (QLD411/Sep/16, GenBank accession number KY905336) with a breakpoint identified at nucleotide position 5062. c Simplot for recombinant GII.P4 New Orleans 2009/GII.4 Sydney 2012 (NSW789Z/Aug/16 (GenBank accession number KY905331) with a single breakpoint identified at nucleotide position 5101. d Simplot for recombinant GII.P12/GII.3 (QLDB207/Sep/16, GenBank accession number KY905334) with a breakpoint at nucleotide position was 5023. The breakpoint positions are shown by red lines. Each analysis used a window size of 300 nt and a step size of 5 nt. The reference strains used are as follows: GII.4 Syd 2012 for NSW0514/2012/AU (GenBank accession number JX459908), GII.4 NO 2009 for NSW001P/2008/AU (GenBank accession number GQ845367), GII.3 for HK71/1978/CHN (GenBank accession number JX846924), GII.12 for 04-179/2005/JP (GenBank accession number AB220922), GII.16 for Neustrelitz260/2000/DE (GenBank accession number AY772730) and GII.2 for KL109/1978/MYS (GenBank accession number JX846925)
Norovirus capsid genotype diversity in Australian waste water samples
This study aimed to capture a complete picture of norovirus diversity at a population level, with the use of NGS technologies on waste water samples from two major Australian cities, Sydney and Melbourne. Norovirus PCR amplicons (306 bp) were generated monthly for 2016 from Malabar, Melbourne and Bondi waste water samples, and were subjected to Illumina MiSeq sequencing. An average of 588,775 reads (range 105,082–1,452,622) were generated from each collection point. Reads were merged and assembled to known reference strains using Geneious and their relative abundance determined based on mapped read counts. Eighteen norovirus capsid genotypes were identified across all three sites and the dominant variants included were GII.4, GII.17, GII.2, GII.13, GII.3 and GII.1 (Fig. ).
Norovirus genotypic distribution was determined in waste water samples by capsid amplicon sequencing using next-generation sequencing (NGS) technology. Samples were sequenced on the MiSeq platform and Geneious was used for merging and mapping of the reads to the reference sequences. Capsid genotypes are labelled in different colours as indicated by the legends. a The genotype distribution of norovirus capsids identified in two waste water treatment plants in Sydney (Bondi and Malabar) and one in Melbourne, Australia. The Y-axis represents the percentage norovirus distribution in each sample and the time is indicated on the X-axis. b To further investigate the less predominant capsid genotypes, the three most predominant capsid genotypes (GII.2, GII.4 and GII.17) across all sites were removed and the distribution of the remaining genotypes plotted as pie charts. The number of reads attributed to non-GII.2, GII.4 and GII.17 are listed below the pie chart
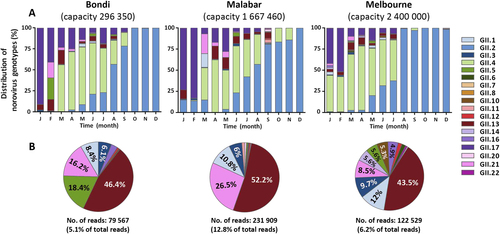
Interestingly, a decline in the proportion of GII.17 as a percentage of total reads was observed from early 2016. From its peak of 68.6% of the total WWTP norovirus population in January (average of all three sites), it decreased to 16.6% by April and accounted for only 4.1% in August 2016 (Fig. ). This reduction was accompanied by an overall increase in the GII.4 population from March (53.4%), which was steady until the emergence of the GII.2 norovirus strain (Fig. ). An increase of GII.2 was observed in all three sites from May 2016 onwards. In Malabar, GII.2 steadily increased from May (4.0%), July (42.5%) and September (80.8%) to December (99.9%), replacing GII.4 as the predominant strain identified (Fig. ). Similarly, GII.2 strains accounted for < 3% in the first months of 2016 in Melbourne, increased to 32.1% in June and to 98.3% in December. This GII.2 increase was also observed in Bondi: 2.5% in April, 56.7% in August and 99.7% in November (Fig. ).
Discussion
In order to design effective control strategies such as vaccines, it is important to understand the prevalence and diversity of current and emerging noroviruses. The genotypes of circulating norovirus strains were determined in Australia and NZ between July 2014 and December 2016 in clinical samples. However, as people infected with norovirus would not necessarily seek medical advice, this can create a bias towards severe symptomatic cases and therefore does not fully represent circulating noroviruses within a population, with less pathogenic strains perhaps under-represented. The application of NGS to monitor norovirus population diversity in waste water can provide a better understanding of norovirus epidemiological data at the population scale by screening waste water produced from many thousands or millions of people. Moreover, the comparison of clinical and waste water data allows a more complete representation of norovirus epidemiology at a city-based population level.
Sequencing and phylogenetic analysis of the polymerase and capsid overlapping regions revealed the Sydney pandemic variant (GII.Pe/GII.4 Sydney 2012) remained the predominant strain in the Oceania region in 2014 (65.4% of norovirus outbreaks and cases) and 2015 (42.1%). The Sydney 2012 variant emerged in 2012 and over the ensuing 4 years herd immunity in the population is likely to have accumulated against the virus. This could account for the sudden decline of GII.4 Sydney pandemic variant in 2016 (only 13.4% of norovirus cases), concomitant with the emergence of five new viruses including two novel GII.4 Sydney 2012 recombinants, GII.P12/GII.3, GII.P16/GII.2 and GII.17. The emergence of new viruses is likely to be responsible for the increase of institutional gastroenteritis outbreaks reported to the NSW Ministry of Health between July and November 2016.
The maintenance of the GII.4 Sydney 2012 capsid in the population was facilitated by two separate recombination events, resulting in the emergence of the intra-genotypic GII.P4 NO 2009/GII.4 Sydney 2012 and the inter-genotypic GII.16/GII.4 Sydney 2012 recombinant viruses. These two recombination events likely provided the viruses a selective advantage to evade host immunity directed towards the GII.Pe-encoded non-structural region of the Sydney variant (GII.Pe/GII.4 Sydney 2012). The GII.P4 NO 2009/GII.4 Sydney 2012 virus arose, although an unusual recombination event between a pandemic variant and its pandemic predecessorCitation37. In Europe, this strain was identified in late 2012 in the UK and DenmarkCitation38,Citation39. However, this strain was first identified in early 2013 in NZ (data not shown) and May 2015 in Australia, but remained at low prevalence throughout 2015. It was not until 2016 when it became a major cause (19.6%) of gastroenteritis within the Oceania region. This timing is consistent with a study by Bruggink et alCitation40. in Victoria, Australia, who showed this recombinant emerged in Melbourne in August 2015, but did not cause a significant increase of gastroenteritis until June 2016.
Another GII.4 recombinant, GII.P16/GII.4 Sydney 2012, emerged in mid-2015 and circulated in 2016, where it was then responsible for 12.5% of noroviruses identified in the Oceania region. This increase in strain activity was also observed in France between 2016 and 2017, where it was responsible for 24% of all norovirus outbreaks identifiedCitation41. In addition, this strain became predominant in the United States, the United KingdomCitation42 and South KoreaCitation43 in 2017.
GII.17 was found to be the cause of increased gastroenteritis in Southeast Asian countries during winter of 2014Citation23,Citation44,Citation45, but did not cause epidemics in other countries and only circulated at low prevalence. This is consistent with our findings where it accounted for less than 2.5% of norovirus cases in 2014/15 and only 4.6% of all noroviruses identified in Australia in 2016Citation25,Citation26,Citation46. However, surprisingly, across all three WWTP sites in Sydney and Melbourne higher viral prevalence was observed with an average of 68.7% of all reads were attributed to GII.17 in the early months of 2016. These findings suggest GII.17 could be less virulent compared with other genotypes, which results in an underestimation of prevalence when only clinical samples are used for norovirus epidemiological studies.
A third recombinant virus, GII.P16/GII.2, circulated at a low prevalence (two cases in 2013Citation33 and a single case in 2015) until June 2016, where it was responsible for 18.8% of all sporadic and outbreak cases identified in the Oceania region. This sudden increase of GII.P16/GII.2 was also observed in Germany, France and China. In Germany, it was found to be the most predominant strain between September and December 2016, accounting for 47.7% of acute gastroenteritis cases and 42% of outbreaksCitation47. In France, GII.P16/GII.2 was responsible for 14% of outbreaks identified during the winter seasons of 2016 and 2017Citation41. Similarly, this increase of GII.P16/GII.2 was observed in China, where it was first detected in August 2016 and caused 79% (44/56) outbreaks identified in November and December 2016Citation48. Analysis of the VP1 full-length capsid sequences revealed no amino acid changes to account for the rapid predominance through antigenic variation. Therefore, amino acid substitutions in the GII.P16 polymerase have been proposed as a possible cause of the GII.P16/GII.2 emergence through changes in polymerase functionCitation49.
Norovirus GII.P21/GII.3 has been a major cause of childhood gastroenteritis since 2002Citation28,Citation50. In addition to the other emerging viruses detected, a novel GII.P12/GII.3 recombinant was identified in 2015 and 2016 in NZ and Australia, respectively. This recombinant was found to be associated with childhood infections and probably replaced the GII.P21/GII.3 recombinant childhood strain, as its prevalence declined rapidly from May 2015 onwards. The majority (90%) of Australian patients infected with GII.P12/GII.3 strain were under 12 years old, suggesting this virus has a predilection for infecting children. In 2016, this recombinant was detected at a prevalence of 8.1% in clinical samples compared with 0.57% of genotypes identified in waste water samples. We hypothesise that this is because children have lower norovirus immunity and infection would elicit more severe symptoms upon their first norovirus exposure. Therefore, children are more likely to visit a hospital or general practitioner for medical advice compared with adults.This is not without precedence, e.g., children with respiratory syncytial virus infection results in more severe outcomes and are present for medical intervention far more than adultsCitation51. Therefore, the use of clinical samples for surveillance could create bias towards viruses from children and selection viruses that induce symptoms, thus skewing genotypic distribution patterns.
Waste water is an ideal source for molecular epidemiological studies, because infected individuals excrete high levels of virus and continue to shed for up to 8 weeks, even after symptom resolutionCitation52. In the present study, NGS was used to examine the genetic diversity, prevalence and temporal dynamics of GII noroviruses present in complex waste water samples. The findings were compared with norovirus results obtained from clinical samples in Australia for 2016. A high level of norovirus genotypic diversity was identified in waste water samples from Sydney and Melbourne, with 18 of 22 capsid genotypes detected (GII.1-8, 10-14, 16, 17, 20-22), compared with 12 capsid genotypes detected in clinical samples. Among the four genotypes not identified, two were not expected (GII.18 and GII.19) as these only infect pigsCitation53. The predominant GII genotype identified in waste water varied throughout the year; GII.17 was predominant in summer 2016 (January/February), which was slowly replaced by strains with a GII.4 capsid. From May 2016, GII.4 prevalence declined and the prevalence of GII.2 strains increased. This data correlated with an increase in GII.2-positive clinical samples, suggesting that waste water samples could augment clinical samples for norovirus surveillance. The increased abundance of GII.2 in wastewater was observed two months prior increased GII.2 detection in clinical samples, signifying its use as a predictive model, which could be used as a warning of impending epidemics leading to peaks of season.
To date, only a handful of studies have examined the genotypic diversity of viruses in wastewater, in which most used traditional Sanger sequencing/cloning methodsCitation54-Citation56, with only two employing NGS technologiesCitation57,Citation58. Studies by Kazama et al.Citation57 and Prevost et al.Citation58 applied second-generation sequencing technologies (pyrosequencing) to characterise norovirus diversity in waste water, which was then compared with the diversity found in clinical samples. A French study also identified a total of 16 norovirus GII genotypes of which GII.4 (86% Sydney 2012 variant) was the most prevalent in both sample types between May 2013 and May 2014Citation58. In contrast to our study, Prevost et al.Citation58 found a strikingly different distribution of norovirus diversity between waste water and clinical samples. For example, GII.4 was the predominant genotype identified in clinical samples throughout the year but only predominant in spring and winter in waste water samples.
In this study, we used 181 clinical samples collected over 2016 and matched the genotypes found to monthly genotype data from wastewater samples in three WWTPs. Kazama et al.Citation57 also compared the norovirus diversity between waste water and clinical samples in a shorter timeframe, between November 2012 and March 2013. A relatively low number of clinical samples (n = 96) was used for correlation purposes, which only identified three GII genotypes (GII.4, GII.5 and GII.14) and a single GI virus (GI.6)Citation57. In total, nine norovirus GII genotypes were identified in the waste water samples, with GII.14 as the most predominant (average of 36.2% of GII viruses identified), followed by GII.4 (21.5%). However, similar to our findings, GII.17 viruses were only detected in waste water samples and were not identified in clinical samplesCitation57. Further work is needed to determine the effectiveness of using waste water for norovirus molecular surveillance, but the initial studies show promising results.
In 2016, an unusual co-circulation of six prevalent norovirus strains was documented; this included four novel recombinant viruses, the GII.17 Kawasaki virus and the Sydney 2012 variant. Sequencing of both clinical and waste water samples demonstrated that both norovirus genotype diversity and the temporal dynamics of when certain viruses emerged coincided. The use of NGS technologies for monitoring norovirus diversity in waste water samples provided a more complete picture of norovirus epidemiology data population level to identify noroviruses associated more with asymptomatic infections, while complementing data obtained from clinical studies.
Acknowledgements
This Australian research was supported by funding from the National Health and Medical Research Council (project number APP1083139 and APP1123135). The New Zealand research was funded by the Ministry of Health, New Zealand. We thank Dawn Croucher from the Kenepuru Science Centre for her technical input. We would like to thank our colleagues Alper Yasar and Jason Koval from the Ramaciotti Centre for Genomics (UNSW) for advice and technical support with MiSeq sequencing. We also thank Neil Franklin and Keira Glasgow (NSW Ministry of Health) for institutional outbreak data, and Melbourne Water Corporation and Sydney Water Corporation for provision of waste water samples. JHL, DET and NEN were supported by an Australian Postgraduate Award, and JHL was additionally supported by a Water Research Australia Scholarship. J-SE is supported by an NHMRC Early Career Fellowship (1073466).
Conflict of interests
JHL’s Water Research Australia scholarship was funded by Melbourne Water Corporation. In addition, this work was partly funded by Melbourne Water Corporation. All other authors declare that they have no conflict of interests.
Related Research Data
References
- OgorzalyLHuman adenovirus diversity in water samples using a next-generation amplicon sequencing approachFood Environ. Virol.20157 112 12110.1007/s12560-015-9194-4
- LodderWJde Roda HusmanAMPresence of noroviruses and other enteric viruses in sewage and surface waters in The NetherlandsAppl. Environ. Microbiol.2005711453146110.1128/AEM.71.3.1453-1461.20051065170
- van den BergHGenetic diversity of noroviruses in raw and treated sewage waterRes. Microbiol.200515653254010.1016/j.resmic.2005.01.008
- PiresSMAetiology-specific estimates of the global and regional incidence and mortality of diarrhoeal diseases commonly transmitted through foodPLoS One201510e014292710.1371/journal.pone.01429274668836
- ZhengDPWiddowsonMAGlassRIVinjéJMolecular epidemiology of genogroup II-genotype 4 noroviruses in the United States between 1994 and 2006J. Clin. Microbiol.20104816817710.1128/JCM.01622-09
- Bartsch S. M., Lopman B. A., Ozawa S., Hall A. J., Lee B. Y. Global economic burden of norovirus gastroenteritis. PLoS One11, e0151219 (2016).
- PhanTGDetection and genetic characterization of norovirus strains circulating among infants and children with acute gastroenteritis in Japan during 2004-2005Clin. Lab.200652519525
- KaplanJEAn outbreak of acute nonbacterial gastroenteritis in a nursing home demonstration of person-to-person transmission by temporal clustering of casesAm. J. Epidemiol.198211694094810.1093/oxfordjournals.aje.a113496
- DolinRNoroviruses—challenges to controlN. Engl. J. Med.20073571072107310.1056/NEJMp078050
- KronemanAProposal for a unified norovirus nomenclature and genotypingArch. Virol.20131582059206810.1007/s00705-013-1708-55570552
- SiebengaJJNorovirus illness is a global problem: emergence and spread of norovirus GII. 4 variants, 2001–2007J. Infect. Dis.200920080281210.1086/605127
- TuETVEpidemics of gastroenteritis during 2006 were associated with the spread of norovirus GII. 4 variants 2006a and 2006bClin. Infect. Dis.20084641342010.1086/525259
- EdenJSThe emergence and evolution of the novel epidemic norovirus GII. 4 variant Sydney 2012Virology201445010611310.1016/j.virol.2013.12.005
- LindesmithLCDonaldsonEFBaricRSNorovirus GII. 4 strain antigenic variationJ. Virol.20118523124210.1128/JVI.01364-10
- BullRAWhitePAMechanisms of GII. 4 norovirus evolutionTrends Microbiol.20111923324010.1016/j.tim.2011.01.002
- WhitePEvolution of norovirusClin. Microbiol. Infect.20142074174510.1111/1469-0691.12746
- WhitePANorwalk‐like virus 95/96‐US strain is a major cause of gastroenteritis outbreaks in AustraliaJ. Med. Virol.20026811311810.1002/jmv.10177
- WiddowsonMAOutbreaks of acute gastroenteritis on cruise ships and on land: identification of a predominant circulating strain of norovirus—United States, 2002J. Infect. Dis.2004190273610.1086/420888
- BullRATuETMcIverCJRawlinsonWDWhitePAEmergence of a new norovirus genotype II. 4 variant associated with global outbreaks of gastroenteritisJ. Clin. Microbiol.20064432733310.1128/JCM.44.2.327-333.20061392656
- YenCImpact of an emergent norovirus variant in 2009 on norovirus outbreak activity in the United StatesClin. Infect. Dis.20115356857110.1093/cid/cir478
- EdenJSTanakaMMBoniMFRawlinsonWDWhitePARecombination within the pandemic norovirus GII. 4 lineageJ. Virol.2013876270628210.1128/JVI.03464-123648122
- Van BeekJIndications for worldwide increased norovirus activity associated with emergence of a new variant of genotype II. 4, late 2012Euro Surveill.20131889
- KooHSMolecular epidemiology of norovirus in asymptomatic food handlers in Busan, Korea, and emergence of genotype GII. 17J. Microbiol.20165468669410.1007/s12275-016-6312-4
- MatsushimaYGenetic analyses of GII. 17 norovirus strains in diarrheal disease outbreaks from December 2014 to March 2015 in Japan reveal a novel polymerase sequence and amino acid substitutions in the capsid regionEuro Surveill.2015202117310.2807/1560-7917.ES2015.20.26.21173
- Medici M. C., et al. Identification of the novel Kawasaki 2014 GII. 17 human norovirus strain in Italy, 2015. Euro Surveill.20, 30010 (2015).
- ParraGIGreenKYGenome of emerging norovirus GII. 17, United States, 2014Emerg. Infect. Dis.201521147710.3201/eid2108.1506524517714
- Sdiri-LouliziKMolecular epidemiology of norovirus gastroenteritis investigated using samples collected from children in Tunisia during a four-year period: detection of the norovirus variant GGII. 4 Hunter as early as January 2003J. Clin. Microbiol.20094742142910.1128/JCM.01852-08
- BoonDComparative evolution of GII. 3 and GII. 4 norovirus over a 31-year periodJ. Virol.2011858656866610.1128/JVI.00472-113165818
- GreeningGEHewittJRivera‐AbanMCroucherDMolecular epidemiology of norovirus gastroenteritis outbreaks in New Zealand from 2002–2009J. Med. Virol.2012841449145810.1002/jmv.23349
- HavelaarAVan OlphenMDrostYF-specificRNAbacteriophages are adequate model organisms for enteric viruses in fresh waterAppl. Environ. Microbiol.19935929562962182392
- HansmanGSGenetic diversity of norovirus and sapovirus in hospitalized infants with sporadic cases of acute gastroenteritis in Chiang Mai, ThailandJ. Clin. Microbiol.2004421305130710.1128/JCM.42.3.1305-1307.2004356817
- KojimaSGenogroup-specific PCR primers for detection of Norwalk-like virusesJ. Virol. Methods200210010711410.1016/S0166-0934(01)00404-9
- LimKLA multi-site study of norovirus molecular epidemiology in Australia and New Zealand, 2013-2014PLoS ONE201611e014525410.1371/journal.pone.01452544846056
- TamuraKMEGA5: molecular evolutionary genetics analysis using maximum likelihood, evolutionary distance, and maximum parsimony methodsMol. Biol. Evol.2011282731273910.1093/molbev/msr1213203626
- KronemanAAn automated genotyping tool for enteroviruses and norovirusesJ. Clin. Virol.20115112112510.1016/j.jcv.2011.03.006
- LoleKSFull-length human immunodeficiency virus type 1 genomes from subtype C-infected seroconverters in India, with evidence of intersubtype recombinationJ. Virol.199973152160103818
- MartellaVEvidence for recombination between pandemic GII. 4 norovirus strains New Orleans 2009 and Sydney 2012J. Clin. Microbiol.2013513855385710.1128/JCM.01847-133889781
- FonagerJBarzinciSFischerTEmergence of a new recombinant Sydney 2012 norovirus variant in Denmark, 26 December 2012 to 22 March 2013Euro Surveill.2013181810.2807/1560-7917.ES2013.18.25.20506
- WongTNWhole genome sequencing and de novo assembly identifies Sydney-like variant noroviruses and recombinants during the winter 2012/2013 outbreak in EnglandVirol. J.20131033510.1186/1743-422X-10-3353874643
- Bruggink L., Catton M., Marshall J. A norovirus intervariant GII. 4 recombinant in Victoria, Australia, June 2016: the next epidemic variant? Euro Surveill.21, 30353 (2016).
- Bidalot M., Théry L., Kaplon J., De Rougemont A., Ambert-Balay K. Emergence of new recombinant noroviruses GII. P16-GII. 4 and GII. P16-GII. 2, France, winter 2016 to 2017. Euro Survell.22, pii: 30508 (2017).
- RuisCThe emerging GII. P16-GII. 4 Sydney 2012 norovirus lineage is circulating worldwide, arose by late-2014 and contains polymerase changes that may increase virus transmissionPLoS ONE201712e017957210.1371/journal.pone.01795725491022
- ChoiYSRe-emergence of a GII. 4 norovirus Sydney 2012 variant equipped with GII. P16 RdRp and its predominance over novel variants of GII. 17 in South Korea in 2016Food Environ. Virol.2017916817810.1007/s12560-017-9278-4
- ChenHA novel norovirus GII. 17 lineage contributed to adult gastroenteritis in Shanghai, China, during the winter of 2014–2015Emerg. Microbes Infect.20154e6710.1038/emi.2015.674661427
- KhamrinPMolecular characterization of norovirus GII. 17 detected in healthy adult, intussusception patient, and acute gastroenteritis children in ThailandInfect. Genet. Evol.20164433033310.1016/j.meegid.2016.07.031
- LeBlanc J. J., et al. Outbreak of norovirus GII. P17-GII. 17 in the Canadian province of Nova Scotia. Can. J. Infect. Dis. Med. Microbiol.2016, 1280247 (2016).
- Niendorf S., et al. Steep rise in norovirus cases and emergence of a new recombinant strain GII. P16-GII. 2, Germany, winter 2016. Euro Surveill.22, pii: 30447 (2017).
- AoYNorovirus GII. P16/GII. 2–associated gastroenteritis, China, 2016Emerg. Infect. Dis.201723117210.3201/eid2307.1700345512504
- TohmaKLeporeCJFord-SiltzLAParraGIPhylogenetic analyses suggest that factors other than the capsid protein play a role in the epidemic potential of GII. 2 norovirusmSphere20172e001870011710.1128/mSphereDirect.00187-175437133
- PuustinenLNorovirus genotypes in endemic acute gastroenteritis of infants and children in Finland between 1994 and 2007Epidemiol. Infect.201214026827510.1017/S0950268811000549
- Atwell J. E., Geoghegan S., Karron R. A., Polack F. P. Clinical predictors of critical respiratory syncytial virus (RSV) illness in infants and children: data to inform case definitions for efficacy trials. J. Infect. Dis.214, 1712–1716 (2016).
- AtmarRLEstesMKNorovirus vaccine development: next stepsExpert. Rev. Vaccin.2012111023102510.1586/erv.12.78
- ParraGIStatic and evolving norovirus genotypes: implications for epidemiology and immunityPLoS Pathog.201713e100613610.1371/journal.ppat.10061365283768
- da SilvaAKEvaluation of removal of noroviruses during wastewater treatment, using real-time reverse transcription-PCR: different behaviors of genogroups I and IIAppl. Environ. Microbiol.2007737891789710.1128/AEM.01428-072168159
- Victoria M., et al. Norovirus molecular detection in Uruguayan sewage samples reveals a high genetic diversity and GII. 4 variant replacement along time. J. Appl. Microbiol.120, 1427–1435 (2016).
- SkraberSConcentration and diversity of noroviruses detected in Luxembourg wastewaters in 2008-2009Appl. Environ. Microbiol.2011775566556810.1128/AEM.00632-113147465
- KazamaSTemporal dynamics of norovirus determined through monitoring of municipal wastewater by pyrosequencing and virological surveillance of gastroenteritis casesWater Res.20169224425310.1016/j.watres.2015.10.024
- PrevostBDeciphering the diversities of Astroviruses and Noroviruses in wastewater treatment plant effluents by a high-throughput sequencing methodAppl. Environ. Microbiol.2015817215722210.1128/AEM.02076-154579439
- KumarSStecherGTamuraKMEGA7: Molecular Evolutionary Genetics Analysis version 7.0 for bigger datasetsMol. Biol. Evol.2016331870187410.1093/molbev/msw054
- KimuraMA simple method for estimating evolutionary rates of base substitutions through comparative studies of nucleotide sequencesJ. Mol. Evol.198016911112010.1007/BF01731581