
Abstract
Legionnaires’ disease (LD) is reported from many parts of the world, mostly linked to drinking water sources or cooling towers. We reviewed two unusual rolling outbreaks in Sydney and New York, each clustered in time and space. Data on these outbreaks were collected from public sources and compared to previous outbreaks in Australia and the US. While recurrent outbreaks of LD over time linked to an identified single source have been described, multiple unrelated outbreaks clustered in time and geography have not been previously described. We describe unusual geographic and temporal clustering of Legionella outbreaks in two cities, each of which experienced multiple different outbreaks within a small geographic area and within a short timeframe. The explanation for this temporal and spatial clustering of LD outbreaks in two cities is not clear, but climate variation and deteriorating water sanitation are two possible explanations. There is a need to critically analyse LD outbreaks and better understand changing trends to effectively prevent disease.
Introduction
Legionnaires’ disease (LD) is a cause of community-acquired atypical pneumonia, with sporadic cases and outbreaks reported from many part of the world. The disease is caused by Legionella bacterium, which was first detected during the investigation of a major pneumonia outbreak in a convention in Philadelphia in 1976Citation1. The primary reservoir of Legionella is water supplies, decorative fountains and cooling towers in buildingsCitation2. The majority of human infections (70–90%) have been caused by L. pneumophila, mainly serogroups 1 and 6. Most cases in humans are asymptomatic or cause a mild illness called Pontiac fever, and complications are rareCitation3. Symptomatic and severe disease tends to affect older people, especially those with chronic diseases, and males.
Legionella is transmitted to humans through inhalation of contaminated aerosols–common environmental sources of these aerosols include drinking water, whirlpool spas, cooling towers and decorative fountainsCitation4. Other reported sources include humidifiers and produce mistersCitation4. Human to human transmission generally does not occur but was reported in a LD outbreak in PortugalCitation5. The outbreak started on November 2014 and 334 confirmed cases were reported within 1 monthCitation5. The source of the outbreak was a wet cooling system, but person to person transmission was reported in one caseCitation6.
Although LD is a notifiable disease in many countriesCitation7, the disease burden may be underestimated due to a lack of surveillance and routine testing of bacteria in most parts of the world. Limited data are available but the reported incidence is around 10–15 cases detected per million population. Of the reported cases, 75–80% are aged >50 years, 60–70% are male and most cases have underlying chronic diseasesCitation4. The number of reported cases has been rising in the United States (US), Europe and other developed countries over the past decadeCitation8. In the US, each year 8000–18,000 people are hospitalized with LDCitation9 and the number of reported cases has increased four-fold from 2000 to 2014Citation10. This increase in the number of LD cases may reflect a true increase in the frequency of disease due to a number of factors (e.g., ageing populations, more at-risk individuals, ageing plumbing infrastructure and climate variation). However, increased ascertainment may be occurring due to more frequent diagnostic testing, enhanced reportingCitation11 and changes to the case definition since 1996Citation7. The serological cut-off limit was updated (four-fold increase equal to 1:128 in 1996 to only a four-fold increase in 2005) and travel-associated LD cases were also includedCitation7.
In most cases, LD outbreaks are discrete and limited to one geographical area. As per the Centres for Disease Control and Prevention (CDC) definition, an outbreak of Legionella occurs when 'two or more people are exposed to Legionella and get sick in the same place at about the same time'Citation10. From 2014 to 2016, multiple outbreaks of LD clustered in time and space were reported from the Bronx, New York City (NYC) and Sydney, Australia. While multiple outbreaks linked to a single source but occurring serially at different times have been describedCitation12,Citation13, rolling outbreaks associated with different exposures clustered in time and space have not been commonly reported in the past. The aim of this case study is to examine the characteristics of rolling outbreaks clustered in time and space in two cities: Sydney, Australia and New York, US.
Materials and methods
We collated data on LD outbreaks in NYC and Sydney through searches of relevant published literature in Medline and Embase databases, news reports and websites of the health departments of NYC and New South Wales (NSW). The review was carried out in 2015–2016 and updated in 2017. A step-wise search protocol was used to search Medline and Embase databases, starting initially with MeSH (Medical Subject Heading) terms, coupled with Boolean logical operations. Results of the search were exported to EndNote, and irrelevant sources were removed through a review of title and abstracts. News reports, websites and published literature were analysed to extract information on LD cases and epidemiological investigations, specifically characteristics of cases (age, sex, comorbidities, hospitalization rates), disease onset dates, locations of exposure, potential sources of infection, results of environmental testing for Legionella bacteria and public health interventions (such as cleaning of cooling towers).
The CDC collects and reports three types of data on LD outbreaks: (i) surveillance for waterborne disease and outbreaks associated with drinking water, (ii) surveillance for waterborne disease and outbreaks associated with water not intended for drinking, and (iii) surveillance for waterborne disease and outbreaks associated with recreational water use.
Graphs were created using R (version 3.1.3). Base map data was taken from the Australian Standard Geographical Classification (ASGC) Digital Boundaries, AustraliaCitation14. Coordinates of outbreak locations were retrieved by searching names of locations on Google maps. Maps were created using ArcMap 10.2. Disease data for plots and maps were obtained from publicly available sources as described above.
The epidemiologic characteristics of temporally and geographically clustered outbreaks in Sydney and NYC were compared to other previous LD epidemics in the same regions. We specifically compared the total number of LD notifications from previous years, sources of infection and evidence of clusters in both settings
Results
Case study 1—multiple LD outbreaks in the Bronx, New York City
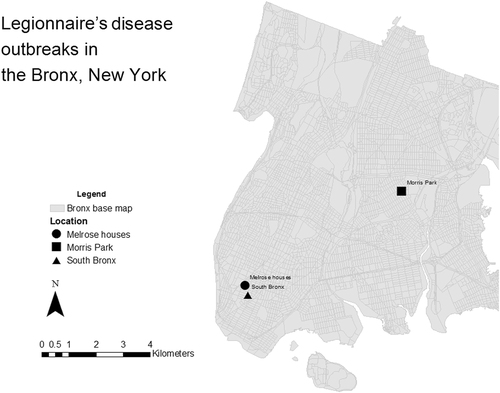
Outbreak data in the Bronx, NYC was retrieved from the NYC Department of Health and Mental HygieneCitation15 and from the CDC websiteCitation16. Three outbreaks occurred in the Bronx NYC in a span of 3 months in 2015. The location of the outbreaks in Bronx is shown in Fig. .
Outbreak locations are represented by circle (Melrouse houses), square (Morris Park) and triangle (South Bronx) shapes. Grey areas represent the streets within the Bronx district. Outbreak data in the Bronx, NYC was retrieved from the New York City Department of Health and Mental Hygiene and from the Centres for Disease Control and Prevention (CDC) website. Base map data was taken from NYC Department of city planningCitation17. Coordinates of outbreak locations retrieved by searching names of locations on Google maps. Maps were created using ArcMap 10.2
Outbreak 1—LD outbreak related to the Opera House in the South Bronx
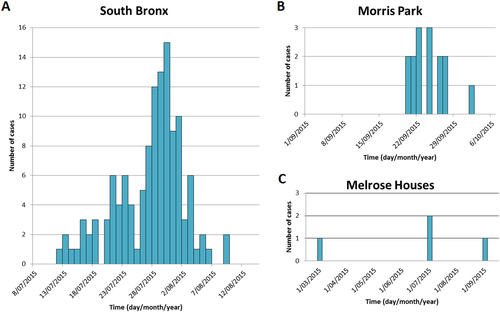
A large outbreak of LD was reported in South Bronx NYC in July–August 2015. A total of 138 cases and 16 deaths were reportedCitation18. The median age of cases was 55 years and 62% (86/138) were male. Most of the cases were hospitalized (128/138) and around 77% (107/138) had a pre-existing medical conditionCitation18. Officials traced that outbreak to a cooling tower at the Opera House Hotel. Strains of Legionella bacteria found in the hotel cooling tower were matched with the strain found in Legionnaires’ patients. By October, 21 cooling towers out of the 55 tested have been found to have the Legionella in other areas in the South BronxCitation18. The city government mandated that all cooling towers be cleaned within 2 weeks. During the outbreak, NYC health officials mandated that all cooling towers in the South Bronx be disinfected. According to the health department, the water supply was not affectedCitation19.
Outbreak 2—LD outbreak in Morris Park, Bronx
Another outbreak of LD started on 21 September 2015 in Morris Park, Bronx, which is located around 4 miles from the Opera House HotelCitation19. This cluster was unrelated to the previous outbreak in the South Bronx, with 13 cases and 1 death reported from 21 to 31 September 2015Citation20,Citation21. The age range was 45–75 years and all patients had underlying health conditions. Most patients in this cluster lived or worked in Morris Park. Thirty-five cooling towers in the area were tested for Legionella bacteria, and 15 of them were positiveCitation20. The strain found in the cooling tower at the Bronx Psychiatric Centre matched samples taken from four patientsCitation22. All towers were cleaned and disinfected immediately. According to a press statement, the NYC drinking water supply was unaffectedCitation21. According to a news report, when re-tested in September 2015, bacteria were again found in 15 of the 35 Legionella-positive cooling towers in Morris ParkCitation23. According to Legionella Risk Management Inc., this is apparently uncommon as 90% of the time the disinfection is effective and regrowth within a short period of time is rare. This highlights the need for legislation and regulation of cooling towers. Currently, there is no uniform legislation for checking cooling towers in the US, but legislation was introduced in NYC during the South Bronx outbreaksCitation18.
Outbreak 3—LD outbreak in Melrose houses in the South Bronx
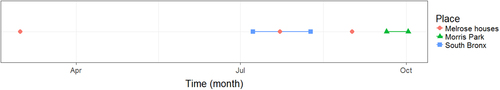
A small cluster of LD cases occurred at the Melrose houses in the South Bronx, apparently unrelated to South Bronx and Morris Park outbreaksCitation20. Four cases were reported over a period of 6 months—one occurred in the beginning of 2015, two during the South Bronx LD outbreak and one in September 2015Citation20. Melrose houses are situated within a one mile radius of the Opera House cooling tower. Cooling towers were not the source in this cluster and bacteria were found in the water distribution system of four of the nine buildings at a Bronx public housing complex. Whether patient strains were matched to environmental strains is unknown. After this outbreak, the Government installed water filters to reduce risk in the Melrose Houses. Figure shows the temporal clustering of outbreaks in the Bronx and Fig. shows outbreak curves.
Red circles indicate the date of report of individual cases in Melrose houses. Lines indicate dates of outbreak durations at South Bronx (blue) and Morris Park (green). Outbreak data in the Bronx, NYC was retrieved from the New York City Department of Health and Mental Hygiene and from the Centres for Disease Control and Prevention (CDC) website. Plot was created using R (version 3.1.3)
The first panel a shows the number of Legionnaire’s disease (LD) cases in the South Bronx, the top right panel b shows Morris Park and the bottom right c shows number of cases in Melrose Houses. Outbreak data in the Bronx, NYC was retrieved from the New York City Department of Health and Mental Hygiene and from the Centres for Disease Control and Prevention (CDC) website. Graph was created in Microsoft Excel
Past outbreaks in New York
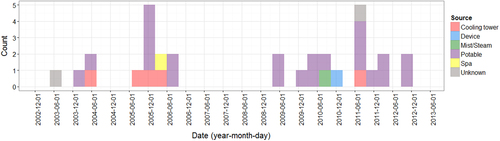
A total of 32 outbreaks were reported in NYC from July 2003 to November 2012, and of these, only 5 (16%) were due to cooling towers. Figure shows the source of these different outbreaks, with most being caused by contamination of potable water. A previous study found that 1449 LD cases were reported in NYC from 2002 to 2011. Although most LD cases reported during this period were sporadic, a few healthcare or community-associated clusters were also reported that may or may not have been outbreak related, involving a point source exposureCitation24. Of the 155 outbreaks reported in the US from 2000 to 2012, around half (76/155) were due to drinking water and only 7% (11/155) were attributed to cooling towers (7%)Citation25.
Bars are coloured according to water source: Cooling tower (red), device (blue), mist/steam (green), potable water (purple), spa (yellow) and unknown (grey). Plot was created using R (version 3.1.3)
Case study 2—multiple LD outbreaks in Sydney
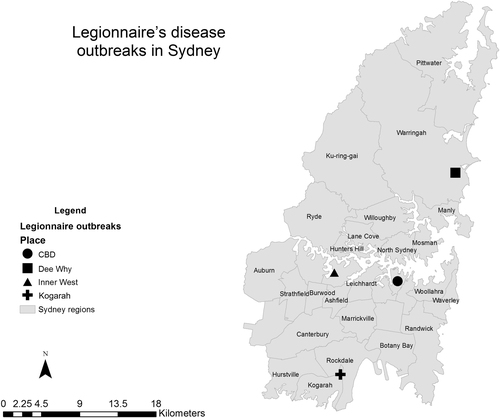
Case data (disease onset dates and location of exposure) of multiple LD outbreaks in Sydney in March–May 2016 were obtained from NSW HealthCitation26. There have been a number of outbreaks of LD identified in Sydney in different locations in 2016Citation26,Citation27. The location of the outbreaks in Sydney is shown in Fig. and the timeline of Sydney outbreak is shown in Fig. . The first outbreak began in March 2016 (notified to health department on 8 and 9 March 2016), with a further four outbreaks reported between March and June 2016. Using government reports and news article sources, a total of 26 cases associated with the different clusters in the Sydney area were identified: 9 cases in Town Hall in the central business district (CBD) in February/MarchCitation26, 3 cases near Kogarah/Hurstville in MarchCitation27,Citation28, 3 cases in Dee Why in AprilCitation29, 6 cases in the CBD near Wynard station in April/MayCitation26 and 5 cases in the inner West in MayCitation30. Two deaths were reported, one in an 80-year-old man in the CBD outbreak in March 2016, and a second in an elderly man associated with the Burwood outbreak in April 2016Citation26. The source of these outbreaks is not confirmed; however, several cooling towers tested positive for L. pneumophilla serogroup 1 in the CBD area in the initial investigation into the March and May outbreaksCitation26. Very high counts of bacteria (>1000 cfu/mL) were isolated from two different cooling towers in the May outbreak. A genetically identical strain was found in both cooling towers and in two of the three culture-positive patients from March outbreak and three of the four culture-positive patients from the May outbreakCitation26. There were also two culture-positive cases identified during these outbreaks who had a different genetic sequence and were judged on this basis by the authorities to have acquired their LD elsewhere.
Outbreak locations are represented by circle (CBD district), square (Dee Why), triangle (Inner West) and cross (Kogarah) shapes. Grey areas represent the administrative districts within the Sydney region. Data source of outbreak data: NSW HealthCitation26. Base map data was taken from the Australian Standard Geographical Classification (ASGC) Digital Boundaries, AustraliaCitation14. Coordinates of outbreak locations retrieved by searching names of locations on Google maps. Maps were created using ArcMap 10.2
Solid lines indicate dates of outbreak durations in central business district (CBD) locations (red), Kogorah (purple), Dee Why (green) and Inner West (teal) locations. Data source of outbreak data: NSW Health 26. Plot was created using R (version 3.1.3)
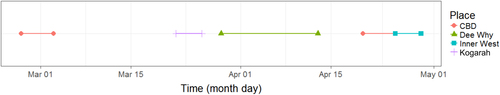
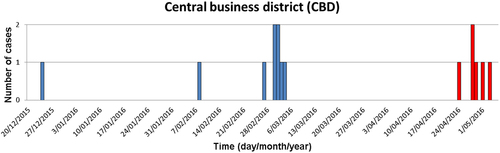
Epidemiological curves for two LD outbreaks in CBD Sydney are shown in Fig. . In these two outbreaks, two cooling towers harboured the identical strain found in five patients. One-hundred and ninety-nine cooling towers were investigated in both CBD outbreaksCitation26. Cooling towers have also been tested in investigations in the other three clustersCitation27,Citation31,Citation32. A cooling tower at St George Hospital was identified as a possible source of outbreak in KogarahCitation27. This outbreak was not related to the CBD outbreakCitation27. The source of Inner West outbreak could not be identifiedCitation30. NSW Health reports that the sources may never be identified, with cooling towers often being cleaned prior to inspection by the building operators once an outbreak has been publicly announced in the area. An expert working group has been tasked with making recommendations as to whether closer regulation of cleaning and inspecting cooling towers is neededCitation27.
Blue bars represent cases in the first outbreak and red bars represent cases during the second outbreak. Data source of outbreak data: NSW HealthCitation26. Graph was created in Microsoft Excel
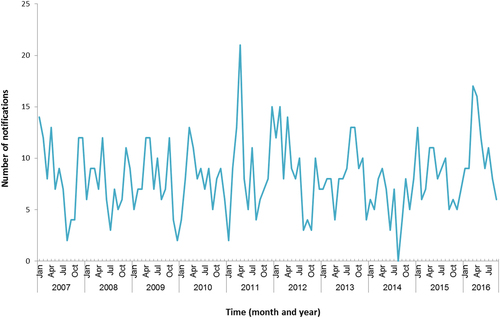
NSW Health has reported that notifications for the first 4 months of the year (42 notifications) are only slightly higher than the previous 5 years (an average of 37 cases)Citation33. Data from the National Notifiable Disease Surveillance System (Fig. ) shows that numbers of notifications in the first 4 months of the year are not much higher than previous yearsCitation33.
Data source: Australia’s notifiable diseases status: Annual report of the National Notifiable Diseases Surveillance SystemCitation33. Graph was created in Microsoft Excel
NSW Health reports that there have been improvements in testing in NSW recently, and LD alerts were sent to doctors that may have resulted in improved case ascertainmentCitation34. The total number of notifications at that time of year is slightly higher than previous years, but the number of outbreaks identified appears higher than previous years. Five outbreaks were identified in Sydney between February and May 2016. There have been a number of previous outbreaks of LD in Sydney since 1990. The majority have been associated with cooling towers.
Discussion
We describe rolling outbreaks of Legionella clustered in time and geography in the Bronx, New York, USA and in Sydney, Australia. Such clustering in time and geography has not commonly been described previously and warrants further critical analysis. The past outbreaks in New York were fairly small compared to the outbreaks in the Bronx, and the majority was linked to hospitals or health facilities. The rate of Legionella has increased in New York from 0.8 cases per 100,000 population in 2002 to 2.7 cases per 100,000 in 2009Citation35 and this increase could be artefact due to increased testing for Legionella or could be a real increase—possibly due to changes in water sanitation, management of cooling towers, seasonal weather changes or other reasons. Climate change and aging populations may have little impact on LD case reports as these are long-term changes. The influence of poverty, underlying patient conditions, seasonal weather changes and technical challenges play a larger role.
The Bronx, the Opera House Hotel and Morris Park outbreaks were linked to cooling towers, but the Melrose outbreak was linked to the water supply. Interestingly, the two cooling tower outbreaks were not related to each other despite being in close proximity.
Similarly in Sydney, it appears unusual to have five outbreaks of Legionella within a 4-month period in the Sydney area, with a genetically identical strain found in two different cooling towers and linked to five patients. The finding of more than one contaminated environmental source with an identical genetic sequence is unusual, with most reported outbreaks linked to a single source. Regulation of cooling towers in Sydney is more stringent than NYC (which has no legislation prior to 2015), with mandatory standards for disinfection and random audits of cooling towersCitation36. The NSW Ministry of Health have also put in a number of additional public health actions in response to the outbreaks, but it is unclear whether water sources other than cooling towers have been investigated.
Investigation of Legionella outbreaks requires matching of environmental samples of Legionella with patient samples to determine if the environmental source is likely to have infected the patient. In the Opera House outbreak, the environmental and patient strains were matchedCitation18; however, no data have been reported on matching to date on the remaining outbreaks in the Bronx and Sydney. Beyond this, the genetic epidemiology of the outbreak Legionella isolates need to be studied further to assess their phylogenetic relatedness at each site. A review of sporadic, epidemic and environmental Legionella isolates from 1982 to 2014 by the US CDC showed that Legionella pneumophila serogroup 1 (Lp1, also the causative strain in the Bronx outbreaks) was the most common and that outbreak and sporadic strains were more similar to each other than to environmental isolatesCitation37. The most frequent sequence type was ST1, and they hypothesised that this may have increased pathogenicityCitation37. A study in Europe shows recent unusual and surprising phylogenetic diversity in Legionella strainsCitation38. They describe recently emerged and globally dispersed clones, which they explain as adaptation to new built environments.
Legionella is a notifiable disease in both US and Australia. In the US, cases are monitored through Nationally Notifiable Diseases Surveillance System (NNDSS) and Supplemental LD Surveillance System (SLDSS)Citation11. In addition to routine surveillance, outbreaks are reported through the Waterborne Disease Outbreak Surveillance SystemCitation10. In Australia, the NNDSS collects LD data from states and territoriesCitation39. The reporting standards are generally good in both countries; however, there is likely underestimation, especially of sporadic cases, as many Legionella cases may be asymptomatic or may not be notified due to mild illness. Cases requiring hospitalization may not be tested for Legionella and treated with broad spectrum antibiotics. In the Sydney outbreak, 61 possible LD cases identified through surveillance for pneumonia were tested retrospectively following the outbreak, and three were positiveCitation40, indicating that around 5% of undiagnosed pneumonia may be due to LD.
Cooling towers are more commonly the source of Legionella in Australia than in the US, whereas potable water supply is a more common source in US outbreaks, as in the Melrose housing outbreakCitation11. A range of factors need to be considered in understanding and mitigating these epidemics, including surveillance systems and regulation of cooling towers and water systems. Climate variation is also a factor—warmer weather facilitates growth of Legionella in biofilms—and is associated with outbreaks. This may explain rolling outbreaks, with unseasonably warm weather in Sydney in 2016, extending beyond the summer monthsCitation41. The Bronx outbreaks also spanned the summer, with temperatures slightly warmer compared to the preceding yearCitation42.
Routine monitoring and testing of cooling towers is not mandated in the US. A Legionella control standard (188–2015) has been developed by the American Society of Heating, Refrigerating, and Air-Conditioning Engineers (ASHRAE®) which is a non-profit organizationCitation43. The ASHRAE standard is a voluntary consensus Standard in form of a copyrighted document that is not freely available and has to be purchased from ASHRAE websiteCitation43. After two outbreaks in Bronx, NYC was the first major city in the US to pass new legislation to mandate regular testing of cooling towers for Legionella bacteriaCitation44 (NYC local law 77 of 2015. NYC Adm Code, title 28, article 317). In Australia, states mandate regular, routine testing of cooling towersCitation45.
Australia has comparatively stringent laws including state-based Public Health ActsCitation40. Under the NSW State Public Health Regulations of 2012, for example, regulation and testing of cooling towers is mandatedCitation45. Installation, operating and maintenance requirements have been outlined in reference policy documents. In a 2011 compliance survey among 276 random cooling tower samples, only 5% had total Legionella of >10 cfu/mLCitation46. Other jurisdictions in Australia also have regular audits of cooling towers.
Following identification of the clusters, the NSW Ministry of Health has put in place a number of public health actionsCitation40. Water service treatment providers have been required to send in all cooling tower documentation regarding cooling towers inspected since November 2015. All cooling towers that have tested positive in the investigations are further investigated. Business owners have also been notified by the Sydney council to clean all cooling systems within a set timeframe or face inspection and a fineCitation47.
Drinking water is the most common source of LD in the US. A 2015 report by the US Environmental Protection Agency found that 67% of drinking water storage tanks sampled contained Legionella. Another EPA study published in 2014 found Legionella in 47% of cold water taps sampled nationwide. Interestingly, the Southwest US has relatively few cases of LD while the Northeast has roughly twice the national averageCitation48. According to the CDC, in the South and Southwest US the potable distribution system tends to approach 1 parts per million (ppm) chlorine while in the Northeast and central North it is <0.5 ppm. Chlorination standards for water in Australia suggest that the chlorine level should be between 0.2 and 0.5 mg/LCitation49. In contrast, except for a few hospital outbreaks, LD outbreaks have not been associated with the water supply in AustraliaCitation50,Citation51.
According to a report from a meeting of professionals in the cooling technology industry, all cooling towers in NYC were disinfected at the end of first outbreak in South BronxCitation20 and emergence of another outbreak in Morris Park raised questions around the source of this outbreak. It is possible the general climatic conditions favoured Legionella growth, and some cooling towers in Morris Park were not disinfected properly. However, cooling towers are not the main source of Legionella outbreaks in the US. A recent report suggests that the measures taken by NYC were not adequate because they did not address an important source of Legionella exposure, the drinking waterCitation20. In the US, there have recently been two examples of neighbourhood-scale or city-scale outbreaks, which were linked directly to the potable water distribution system. In New Jersey, the drinking water was investigated because there were no cooling towers in the area that could explain the outbreakCitation52. The second example is Flint Michigan, where corrosion in the distribution system led to city-wide proliferation of Legionella, particularly at the ends of the main water pipes where concentrations of disinfectant had progressively decreased before entering plumbing in homesCitation53. It is interesting to note in Flint that infections were caused by multiple strains of Legionella, suggesting a system-wide problem of maintenance.
A limitation of this study was that most information on LD cases and epidemiological investigations were taken from public reports and news items, rather than official health department records. There is a possibility that some public information may be incorrect or incomplete.
In summary, we present unusual geographically and temporally clustered Legionella outbreaks in two cities, for which an explanation is not clear. For example, in relation to the Bronx, the Opera House Hotel and Morris Park outbreaks, it is unusual for so many cooling towers to be contaminated at one time. In addition in relation to the Sydney outbreaks, it is unusual to have five outbreaks occurring in the same city within 4 months and unusual to find more than one contaminated environmental source with an identical genetic sequence. In contrast to the Flint Michigan outbreakCitation53, where a systematic problem with the water supply was identified that explained ongoing LD cases from a single source, these rolling outbreaks stand out as different from past Legionella outbreaks. This is a concerning trend that requires further investigation and mitigation.
Acknowledgements
This work was supported through the NHMRC Centre of Research Excellence, Integrated Systems for Epidemic Response (Grant number APP1107393). The funders had no role in study design, data collection and analysis, decision to publish or preparation of the manuscript.
Authors' contributions
C.R.M.: lead investigator, conception and design of the study, manuscript revision; A.D. and C.M.B.: data collection and manuscript revision; A.A.C.: data collection and drafting the manuscript. All authors approved the final version to be submitted.
Conflict of interest
C.R.M. has received in-kind support and funding for investigator-driven research from GlaxoSmithKline, Pfizer, Merck and bioCSL and has sat on advisory boards for Merck, GlaxoSmithKline and Pfizer. The other authors declare that they have no conflict of interest.
References
- FraserDWLegionnaires’ disease: description of an epidemic of pneumoniaN. Engl. J. Med.1977297 1189 119710.1056/NEJM197712012972201
- CunhaBABurilloABouzaELegionnaires’ diseaseLancet201638737638510.1016/S0140-6736(15)60078-2
- Munoz-GomezSCunhaBAFever of unknown origin (FUO) due to Legionnaire’s diseaseHeart Lung201544727410.1016/j.hrtlng.2014.09.003
- World Health Organisation (WHO). Legionellosis. http://www.who.int/mediacentre/factsheets/fs285/en/ (2017) (accessed 15 November 2017)
- ShivajiTA large community outbreak of Legionnaires disease in Vila Franca de Xira, Portugal, October to November 2014Eur. Surveill.2014192099110.2807/1560-7917.ES2014.19.50.20991
- CorreiaAMProbable person-to-person transmission of Legionnaires’ diseaseN. Engl. J. Med.201637449749810.1056/NEJMc1505356
- Centers for Disease Control and Prevention. Strengthening surveillance for travel-associated legionellosis and case definitions for legionellosis. http://www.cdc.gov/legionella/health-depts/inv-tools-single/cste-position-statement.html (accessed 4 April 2016)
- JosephCALegionnaires’ disease in Europe 2000-2002Epidemiol. Infect.200413241742410.1017/S09502688040020182870121
- MarstonBJIncidence of community-acquired pneumonia requiring hospitalization: results of a population-based active surveillance study in OhioArch. Intern. Med.19971571709171810.1001/archinte.1997.00440360129015
- Centers for Disease Control and Prevention. Legionella (Legionnaires’ disease and Pontiac fever) - outbreaks. http://www.cdc.gov/legionella/outbreaks.html (accessed 4 April 2016)
- Centers for Disease Control and Prevention. Legionella (Legionnaires’ disease and Pontiac fever): surveillance and reporting. http://www.cdc.gov/legionella/surv-reporting.html (accessed 5 April 2016)
- CowgillKDRecurrence of Legionnaires disease at a hotel in the United States virgin islands over a 20-year periodClin. Infect. Dis.2005401205120710.1086/428844
- SilkBJEight years of Legionnaires’ disease transmission in travellers to a condominium complex in Las Vegas, NevadaEpidemiol. Infect.20121401993200210.1017/S0950268811002779
- Australian Bureau of Statistics. The Australian Standard Geographical Classification (ASGC) digital boundaries. http://www.abs.gov.au/websitedbs/D3310114.nsf/home/Australian+Standard+Geographical+Classification+(ASGC) (2011) (accessed August 2016)
- NYC Health. http://www1.nyc.gov (accessed 1 December 2017)
- Centers for Disease Control and Prevention. https://www.cdc.gov/ (accessed 1 December 2017)
- NYC Department of City Planning. MapPLUTO - Bronx (Shapefile). https://www1.nyc.gov/site/planning/data-maps/open-data/dwn-pluto-mappluto.page (accessed August 2016)
- WeissDA large community outbreak of Legionnaires’ disease associated with a cooling tower in New York City, 2015Public Health Rep.201713224125010.1177/00333549166896205349490
- NYC Health. Fact sheet: Legionnaires’ disease in the South Bronx. http://www1.nyc.gov/assets/home/downloads/pdf/press-releases/2015/fact_sheet_legionnaires_disease_south_bronx.pdf (2015) (accessed 1 December 2017)
- FerrariSNew York Legionella regulations: are they missing the boat?CTI J.201637607210.5007/2175-7968.2016v36n3p60
- NYC Health. Press Release # 039-15 Monday, September 28, 2015, Health Department Investigating Cluster of Legionnaires’ disease in Morris Park Section of the Bronx. https://www1.nyc.gov/site/doh/about/press/pr2015/pr039-15.page (2015) (accessed 1 December 2017)
- NYC Health. Health Department identifies likely source of East Bronx Legionnaires’ disease outbreak (Press Release, November 20, 2015). http://www1.nyc.gov/site/doh/about/press/pr2015/pr055-15.page (2015) (accessed 23 August 2017)
- Mueller, B. Legionnaires’ bacteria regrew in Bronx cooling towers that were disinfected. https://www.nytimes.com/2015/10/02/nyregion/legionnaires-bacteria-regrew-in-bronx-cooling-towers-that-were-disinfected.html (2016) (accessed 15 December 2016)
- FarnhamAAlleyneLCiminiDBalterSLegionnaires’ disease incidence and risk factors, New York, New York, USA, 2002-2011Emerg. Infect. Dis.2014201795180210.3201/eid2011.1318724214295
- Centers for Disease Control and Prevention. Surveillance reports for drinking water-associated disease & outbreaks. https://www.cdc.gov/healthywater/surveillance/drinking-surveillance-reports.html (2017) (accessed 8 December 2017)
- NSW Health. Public Health investigation into the legionella outbreaks in Sydney CBD - March and May 2016. http://www.health.nsw.gov.au/Infectious/Publications/Legionella-cbd-report.pdf (2016) (accessed 30 Nov 2017)
- NSW Health. Legionella outbreaks 2016 – a detailed overview. 2016. https://www.ehansw.org.au/documents/item/907 (2016) (accessed 30 November 2017)
- NSW Health. Communicable Diseases Weekly Report (Week 13, 28 March to 3 April 2016). http://www.health.nsw.gov.au/Infectious/Reports/Publications/cdwr/2016/CDWR-week13-2016.pdf (2016) (accessed 11 Dec 2017)
- NSW Health. North Sydney Local Health District, Dee Why Legionnaires’ disease link investigated (Press Release - 15 April, 2016). http://www.nslhd.health.nsw.gov.au/AboutUs/media/Documents/160415-JY-NB-Dee%20Why%20Legionnaires.pdf (2016) (accessed 8 Dec 2017)
- NSW Health. Sydney Local Health District, information about Legionnaires’ cluster in inner west Sydney (Press Release - Monday May 23, 2016). https://www.slhd.nsw.gov.au/PopulationHealth/pdf/Legionnaires-QandAs.pdf (2016) (accessed 8 December 2017)
- NSW Health. Communicable Diseases Weekly Report (Week 16, 18 to 24 April 2016). http://www.health.nsw.gov.au/Infectious/Reports/Publications/cdwr/2016/CDWR-week16-2016.pdf (2016) (accessed 8 December 2017)
- NSW Health. Legionnaires’ disease alert - Burwood area - May 2016 (Press Release Tuesday 24 May 2016). http://www.health.nsw.gov.au/Infectious/alerts/Pages/Legionnaires-Burwood-May2016.aspx (2016) (accessed 8 December 2017)
- Australian Government Department of Health. National Notifiable Disease Surveillance System data. http://www9.health.gov.au/cda/source/cda-index.cfm (accessed 2 June 2016)
- NSW Health. CBD Legionnaires’ disease outbreak – update (05 May 2016). http://www.health.nsw.gov.au/news/Pages/20160505_00.aspx (2016) (accessed 8 December 2017)
- EpiQuery. Communicable Disease Surveillance Data (CDSD). https://a816-healthpsi.nyc.gov/epiquery/CDSS/index.html (accessed 23 August 2017)
- NSW Health. Legionella and Legionnaire's disease. http://www.health.nsw.gov.au/environment/legionellacontrol/Pages/default.aspx (2017) (accessed 12 January 2017)
- Kozak-MuiznieksNAPrevalence of sequence types among clinical and environmental isolates of Legionella pneumophila serogroup 1 in the United States from 1982 to 2012J. Clin. Microbiol.20145220121110.1128/JCM.01973-133911437
- DavidSMultiple major disease-associated clones of Legionella pneumophila have emerged recently and independentlyGenome Res.2016261555156410.1101/gr.209536.1165088597
- Department of Health Australia. Introduction to the National Notifiable Diseases Surveillance System. http://www.health.gov.au/internet/main/publishing.nsf/Content/cda-surveil-nndss-nndssintro.htm (accessed 20 May 2016)
- Griffiths, E., et al. Public Health Investigation into the Legionella Outbreaks in Sydney CBD. NSW Health, Sydney, 2016.
- Australian Bureau of Meteorology. Sydney in 2016: warmest year on record (Thursday, 5 January 2017 - annual climate summary for Sydney - product code IDCKGC55L0). http://www.bom.gov.au/climate/current/annual/nsw/sydney.shtml (2017) (accessed 11 December 2017)
- Weather underground. https://www.wunderground.com/ (accessed 15 July 2016)
- Centers for Disease Control and Prevention. Water system maintenance. http://www.cdc.gov/legionella/water-system-maintenance.html (accessed 11 May 2016)
- BassettMTBalterSRegulating cooling towers to prevent outbreaks of Legionnaires’ diseasePublic Health Rep.201713213313510.1177/00333549166896125349487
- NSW Health. Public Health Act 2010 and Public Health Regulation 2012. http://www.health.nsw.gov.au/phact/Documents/summ_env.pdf (accessed 11 November 2017)
- NSW Health. NSW Water Cooling System Compliance Survey 2010–2011 Report. http://www.health.nsw.gov.au/environment/legionellacontrol/Documents/wcs-compliance-report-2011.pdf (2011) (accessed 30 November 2017)
- Harriet, A. Health authorities quickly and quietly respond to new legionnaires’ disease outbreak in Burwood. http://www.smh.com.au/national/health/health-authorities-quickly-and-quietly-respond-to-new-legionnaires-disease-outbreak-in-burwood-20160517-gowzo6.html (2016) (accessed 3 June 2016)
- Centers for Disease Control and Prevention.Legionellosis - United States, 2000-2009MMWR Morb. Mortal. Wkly. Rep.20116010831086
- NHMRC. Australian Drinking Water Guidelines (2011) - Updated October 2017. https://www.nhmrc.gov.au/guidelines-publications/eh52 (2017) (accessed 30 November 2017)
- GuestCO'BrienEA review of national legionellosis surveillance in Australia, 1991 to 2000Commun. Dis. Intell. Q. Rep.200226461
- CameronSRoderDWalkerCFeldheimJEpidemiological characteristics of Legionella infection in South Australia: implications for disease controlAust. N. Z. J. Med199121657010.1111/j.1445-5994.1991.tb03007.x
- CohnPDCommunity outbreak of legionellosis and an environmental investigation into a community water systemEpidemiol. Infect.20151431322133110.1017/S0950268814001964
- SchwakeDOGarnerEStromORPrudenAEdwardsMALegionella DNA markers in tap water coincident with a spike in Legionnaires’ disease in Flint, MIEnviron. Sci. Technol. Lett.2016331131510.1021/acs.estlett.6b00192