
 ?Mathematical formulae have been encoded as MathML and are displayed in this HTML version using MathJax in order to improve their display. Uncheck the box to turn MathJax off. This feature requires Javascript. Click on a formula to zoom.
Abstract
The H3N2 canine influenza virus (CIV) originated from an avian species. Since its emergence, it has circulated in multiple states and has caused pandemics among dog populations; however, no comprehensive studies have explored the causes driving these ongoing cases. The study of the codon usage patterns of viruses can reveal the genetic changes required for the viruses to adapt to new hosts and the external environment. Here we performed a thorough genetic, evolutionary, and codon usage analysis. We identified three evolutionary H3N2 CIV clades from a timescaled phylogenetic tree, namely, Origin, China, and Korea/USA, by principal component analysis (PCA). Additionally, we found a low codon usage bias and that mutation pressure, natural selection, and dinucleotide abundance shape the codon usage bias of H3N2 CIVs, with natural selection being more crucial than the others. Moreover, the human codon adaptation index was similar to that of dogs (the natural host) and cats. In addition, the H3N2 CIV similarity index values were higher than those of the avian influenza virus (AIV), suggesting viral adaptation to the host. Therefore, H3N2 CIVs may pose a potential risk to public health in the future, and further epidemiologic, evolutionary, and pathogenetic studies are required.
Introduction
Dogs should be carefully considered for their role as influenza hosts because of their close contact with humans and their influenza receptor distributionCitation1, Citation2. H3N8 and H3N2 are the current circulating subtypes of canine influenza virus (CIV) in dog populations. H3N8 CIV, which caused a pandemic in dogs, was first isolated in Florida in 2004Citation3, and there were no documented reports of CIV infections prior to 2004Citation4. In 2008, Korea first reported H3N2 CIVs, followed by China and ThailandCitation1, Citation5, Citation6. In April 2015, the H3N2 CIV circulating in Asia was isolated from an infected golden retriever in Cook County, Illinois. The virus has since spread to several states, causing respiratory disease in thousands of dogs across the United StatesCitation4. Of note, a 2012 study showed that a novel H3N1 virus infecting dogs arose by reassortment of a human-origin H1N1 influenza virus and an avian-origin H3N2 CIV. In addition, a 2015 study showed that a novel CIV reassortant, H3N2, containing the polymerase acidic (PA) genomic segment from the H9N2 pandemic avian influenza was isolated from a dog in South Korea. These developments suggest that dogs may play critical roles as mixing vessels and reservoirs of avian-origin H3N2 CIVsCitation7. Therefore, canines carrying H3N2 CIV may transmit the virus to other species with whom they have frequent close contact, including humansCitation8. In addition, companion animals may pose a potential public health risk. Although no H3N2 CIV human infections have been reported, the increasing number of new H3N2 CIV cases in the United States and East Asia, as well as the quick evolution of the virus, calls for detailed genetic analysis of emerging H3N2 CIVs to understand and estimate the risk of CIV adapting to humans.
Phylogenetic and codon usage bias analyses are widely used to investigate viral evolution. For example, Franzo et al.Citation9 reported that the feline panleukopenia virus jump to canines leading to canine parvovirus type 2 experienced codon usage adaptation. Butt et al.Citation10 found that the codon usage bias analysis was consistent with the phylogenetic analysis of Zika virus (ZIKV). Moreover, Anhlan et al.Citation11 reported that codon usage along with phylogenetic analysis helped identify the origin of the 1918 pandemic H1N1 influenza A virus. Choosing synonymous codons is a non-random process. During protein translation, some codons are used more frequently than others, a phenomenon known as “codon usage bias”Citation12. Studying codon usage bias can help explain adaptive changes during viral evolutionCitation9. The codon usage pattern plays a significant role in viral evolution due to species-specific preferences for certain codonsCitation13–Citation15. A codon usage preference offers an evolutionary force driving the overall viral fitness during replicationCitation16.
Several studies have been published on the codon usage bias of different viruses. Notably, the codon usage bias is low in most RNA virusesCitation17, Citation18. For instance, the average effective number of codons (ENC) of ZIKV is 53.146 (range 52.559–53.585)Citation17. The codon usage bias of Zaire Ebola virus strains is 57.23Citation19. The ENC value for Japanese encephalitis virus is 55.30Citation20. For H1N1pdm09 influenza A virus (IAV) strains, the average ENC is 52.51, indicating that it is only slightly biasedCitation21, similar to H5N1 with an ENC value of 50.91 (range of 43.11–55.21)Citation22 and the equine influenza virus (EIV), with a mean ENC value of 52.09 (range 47.7–53.72)Citation23. However, for the H9N2 avian influenza virus, the codon usage bias is very low, with an ENC ranging from 48.83 to 51.31Citation24.
In this study, we comprehensively analyzed the genetic evolution and synonymous codon usage pattern of different H3N2 CIV lineages circulating worldwide between 2006 and 2016. We also investigated the codon usage bias and phylogenetic relationships of H3N2 CIVs based on sequence data from past and current outbreaks in Asia and the United States. Our findings show novel perspectives on the molecular evolution of H3N2 CIVs.
Results
Evolutionary analysis of H3N2 CIV complete genomes
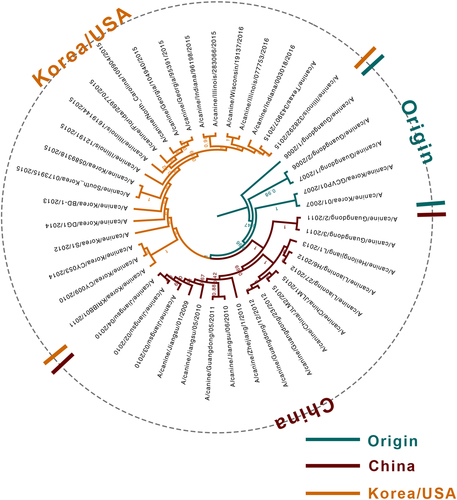
Among the 48 selected complete genomes, 5 were previously reported as reassortment eventsCitation4, Citation25, Citation26, and low-quality genomes (Table S1) were excluded from the analysis. Therefore, 43 CIV genomes were used to infer the phylogenetic tree (Fig. ) and codon usage. Phylogenetic analysis revealed that since the outbreak of H3N2 CIV in 2006 in Guangdong, China, un-reassortant H3N2 CIV mainly circulated in three countries, namely, China, Korea and the United States. Based on the tree structure, three clades, namely, Origin, China, and Korea/USA were identified, with the Origin clade including the earlier strains prevailing in China and Korea. The recent isolated strains from China and Korea/USA were clustered with the China and Korea/USA clades, accordingly.
Origin, China, and Korea/USA clades are represented in green, red, and orange, respectively
A and U nucleotides are more abundant in the H3N2 CIV genomes
Nucleotide compositions are commonly used to demonstrate bias in genes/genomes. Here we found that the most frequent mononucleotide was A, with a mean ± standard deviation (SD) value of 33.59% ± 0.25. The next most common mononucleotides was G, U, and C with mean ± SD values of 23.26% ± 0.242, 22.41% ± 0.056, and 20.75% ± 0.065, respectively. The composition of AU was higher than that of GC, with 56.0% ± 0.283 compared with 44.01% ± 0.283. Additionally, the frequency of codons at the third position suggested that A3s (42.3% ± 0.007) and U3s (31.0% ± 0.002) were more abundant synonymous codons than G3s (26.3% ± 0.007) and C3s (27.5% ± 0.002). The average GC contents at the first, second, and third positions (GC12s and GC3s) were 45.29% and 40.97%, respectively. Furthermore, the nucleotide composition calculated by specific phylogenetic clades, which was also in accordance with the total composition, showed that A and U were rich among the three clades. The detailed compositions of the H3N2 CIV genomes are shown in Table S2. The unequal nucleotide composition observed in the H3N2 CIV clades suggested codon usage bias.
Codon usage bias of H3N2 CIV coding sequences and differences in specific clades
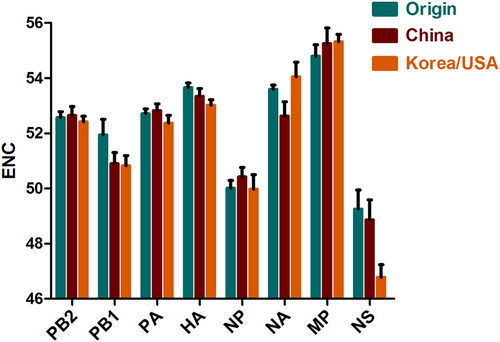
To infer the magnitude of the H3N2 CIV codon usage choice, the ENC values were calculated. ENC values ranged from 52.740 to 53.420, with a mean value ± SD of 53.053 ± 0.192, indicating a lower codon usage choice in all strains. In addition, the mean ENC values were 53.326, 53.151, and 52.903 for the Origin, China, and Korea/USA clades, respectively. Analyzing individual genomic segments showed that MP had the highest ENC value (55.24 ± 0.44), while NS had the lowest (47.89 ± 1.25) (Fig. ). Interestingly, the NS gene had the highest ENC value in the Korea/USA clade. Overall, the H3N2 CIV ENC value was >35, indicating a significantly low codon usage bias. Moreover, a low degree of codon usage bias was identified among the clades and individual genes.
The H3N2 CIV strains are clustered into three genotypic groups, namely, Origin, China, and Korea/USA, represented in green, red, and orange, respectively
Relative synonymous codon usage analysis of H3N2 CIV genomes
Relative synonymous codon usage (RSCU) analysis is commonly applied to explore the synonymous codon usage pattern. Here we found that among the most frequently used synonymous codons, 14 were A/U-ended codons (9 terminated in A), and the numbers of U-, C-, and G-ended codons were 5, 2, and 1, respectively, with no bias in Tyr (Table ). Importantly, 5 of the 18 optional synonymous codons were overrepresented with RSCU values higher than 1.6. Furthermore, all were A-terminated codons (CCA, ACA, GCA, AGA, and GGA). No optional synonymous codons were underrepresented (RSCU < 0.6). We next analyzed the synonymous codon tendencies among the clades and found that A/U-ended codons were more common than G/C-ended codons. This was in accordance with the occurrence of all strains, regardless of clade, except for the optional codon encoding for Leu, which was CUU in all China and Korea/USA clade strains and CUG in the Origin clade. Regarding Tyr, no bias was found for UAU and UAC in all strains, whereas the preferred codon was UAC in the Origin and China clades and UAU in the Korea/USA clade. We then explored the relationship between H3N2 CIV and its natural host, dogs, as well as its potential hosts including cats, chickens, and humans. We found that the 18 most abundant host codons were not completely harmonious with the H3N2 CIV codons.
RSCU of H3N2 CIVs, genotypes, and potential hosts
Additionally, we compared the RSCU value of the HA gene of H3N2 CIVs to those of avian and human influenza viruses and found that among the 18 abundant synonymous codons, most synonymous codons were the same across all influenza virus species (Table S3). We also discovered that UUG, encoding Leu, was abundant relative to codon usage. Interestingly, UUG was the synonymous codon encoding amino acid 222 for Leu in the HA gene, which is important in receptor binding.
The synonymous codon usage pattern tendency varied and was specific to individual clades
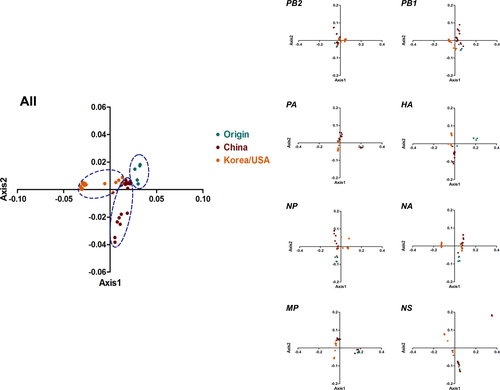
To study the synonymous codon usage variation in the complete coding sequences of H3N2 CIVs, we performed principal component analysis (PCA). The first four principal axes (axes 1–4) accounted for 80.9%, specifically 54.21%, 16.05%, 6.67%, and 3.97%, respectively (Fig S1). Axes 1 and 2 were significant in determining the synonymous codon usage pattern (Fig. ). All strains were mainly clustered into three groups, consistent with the phylogenetic tree topology. The Origin clade was mainly distributed in group 1, the China clade mainly belonged to group 2, and the Korea/USA clade belonged to group 3. In addition, we performed PCA of individual genes based on clades. We found that the different clade strains partially overlapped, except for the HA and NA genes, especially in the Origin clade. Above all, the clades were related during evolution, specifically the recent China and Korea/USA outbreak strains.
Genotype-specific PCA was structured for whole genomes and H3N2 (eight segments). Origin, China, and Korea/USA clades are represented in green, red, and orange, respectively
The potential roles of mutation pressure and natural selection in shaping the H3N2 CIV codon usage bias
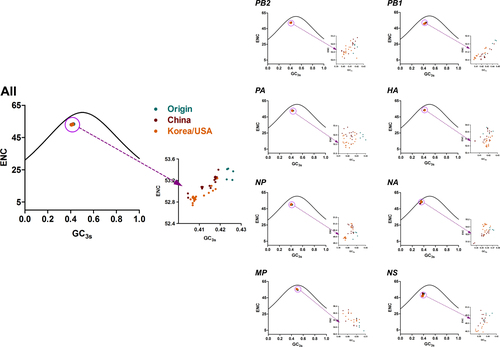
Previous studies underlined that mutation pressure and natural selection were key factors driving the codon usage bias of individual genes or genomes; thus, to prove the hypothesis for the complete H3N2 CIV coding sequences, ENC plots were constructed according to the defined clades and individual genes (Fig. ). In the complete coding sequence plot, all strains sat lower than the expected curve. In addition, the China clade overlapped with the Korea/USA clade, while the Origin clade was distributed in a single group. Furthermore, ENC plots were drawn based on individual genes. The plot showed that all clades mixed together for the eight individual genes, except the Origin clade that separated from other clades for the PA gene. Interestingly, several Korea/USA clade strains in the NA gene sat near the expected curve, suggesting that mutation pressure played a major role in this strain. Overall, ENC plots elucidated that both mutation pressure and natural selection are essential in driving the codon usage bias of the complete genomes of H3N2 CIVs.
Solid curves represent the stranded ENC. Origin, China, and Korea/USA clades are represented as green, red, and orange diamonds, respectively
To confirm the above results, we performed regression analysis among the nucleotide compositions, sense codon content, Axis1, Axis2, Aroma, and Gravy (Table ). Nucleotides, codons, and ENC were significantly correlated (p < 0.01). Axis2 correlated with nucleotide and codon composition (p < 0.05). Axis1 correlated with several indices, including A, C3, U3, and GC3. Additionally, the relationship between Gravy and A, G, A3, G3, GC, GC3, and ENC was remarkable. Aroma only correlated with mononucleotide U at 0.01 < p < 0.05. This emphasizes that mutation pressure and natural selection shape the codon usage propensity.
Correlation analysis among nucleotide composition, codon composition, ENC, Aroma, Gravy, Axis1, and Axis2
Natural selection is the major driver of H3N2 CIV codon usage
Given the conclusion that mutation pressure and natural selection were important drivers of H3N2 CIV codon usage bias in the complete coding sequences, we sought to determine the mutation pressure-natural selection equilibrium using parity rule 2 (PR2) analysis (Fig S2). We found that AU-optional degenerate codons were preferred over GC codons in the frequently used fourfold degenerate codon families (Ala, Arg, Gly, Leu, Pro, Ser, Thr, and Val). Most importantly, the magnitudes of mutation pressure and natural selection varied.
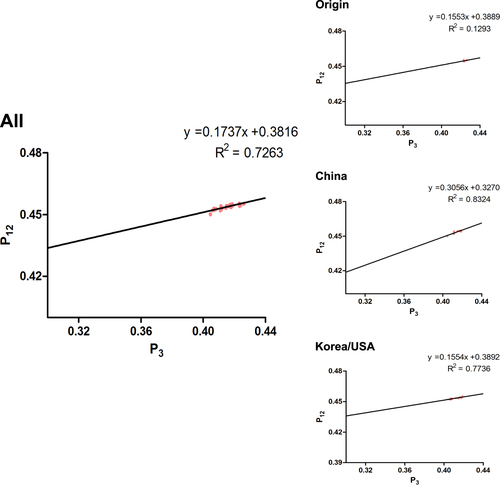
Next, we performed neutrality analyses to explain the decisive role in choosing codon usage in H3N2 CIV complete coding sequences (Fig. ). P12 (GC12s) and P3 (GC3s) were significantly correlated (r = 0.852, p = 0.0001) when analyzing all strains, with a correlation coefficient of 0.1737 ± 0.3816. Thus, the mutation pressure (relative neutrality) was 17.37%, whereas natural selection (relative constraint on P3) was 82.63%. Based on individual clade analysis, the linear regression slopes were 15.53% for the Origin clade (r = 0.36), 30.56% for the China clade (r = 0.553), and 15.54% for the Korea/USA clade (r = 0.394). This indicates that the role of natural selection is more crucial than mutation pressure in shaping the H3N2 CIV codon usage bias. We also analyzed the specific coding sequences of the eight independent segments by evolutionary clades. We found that the coefficients between P12 and P3 were positively correlated, except that for the NA gene, which was −0.06997. Moreover, mutation pressure predominated over natural selection in the China clade for the MP and NS coding sequences (the mutation pressure percentage was 50.66% compared with 72.55% for natural selection).
.
In summary, although we found different constraints of natural selection in distant clades and individual genes, natural selection was more significant in driving the codon usage bias of the complete coding sequences of H3N2 CIVs.
Host-specific codon usage pattern of H3N2 CIVs
To investigate the adaptation of individual H3N2 CIV genes to their natural hosts and potential hosts, we performed codon adaptation index (CAI) analysis (Table S4). CAI represents the relationship between gene expression levels and codon usage patterns. The CAI values of the eight genes related to the potential hosts were calculated for all selected strains. We found that the CAI values of the different hosts varied. Specifically, chickens displayed the highest in all eight individual genes, with mean values of 0.7695 for the HA gene, 0.7657 for MP, 0.7434 for NA, 0.7456 for NP, 0.745 for NS, 0.7728 for PA, 0.7883 for PB1, and 0.756 for PB2. In addition, at the evolutionary clade level, the highest CAI values were also observed in chickens, followed by humans, felines, and canines, regardless of clade.
We also performed similarity index (SiD) analysis (Fig S3). The overall levels and specific clades were studied based on potential hosts. Compared with the other three potential hosts, canines were crucial to H3N2 CIV evolution. Moreover, the Korea/USA clade was largely influenced, followed by the China and Origin clades.
H3N2 CIV displayed a deoptimized codon usage pattern from its potential hosts
To identify the codon usage deoptimization of H3N2 CIV coding sequences with their potential hosts, the relative codon deoptimization index (RCDI) values were calculated for the individual segments as well as the evolutionary clades. The RCDI values were >1 relative to the four potential hosts, not considering the independent segments and specific clades, suggesting a deoptimization codon usage pattern relative to the potential hosts (Table S5). Higher RCDI values were observed in the feline and canine species. In detail, except for the MP gene relative to the feline species, which was the highest among the four hosts, the highest deoptimization codon usage was observed in the canine species for the other seven genes. Additionally, the NS gene was considered the most deoptimized from its potential hosts.
Evolution and natural selection of HA and NA genes on H3N2 CIV cross-species transmission
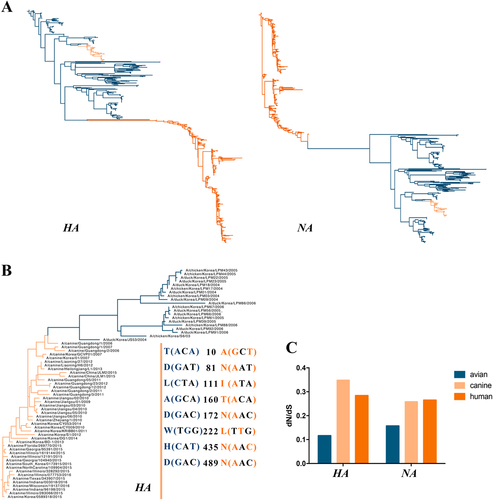
The HA and NA phylogenetic trees showed that H3N2 CIVs are closely related to the avian influenza virus H3N2 (Fig. ), indicating an avian origin, consistent with a previous studyCitation26. Additionally, 20 sequences that were closely related to H3N2 CIV were chosen to detect the relationship between H3N2 CIV and AIV (Fig. ). Previous studiesCitation26, Citation27showed that eight amino-acid sites in the HA gene, namely, T(ACA)10A(GCT), D(GAT)81N(AAT), L(CTA)111I(ATA), A(GCA)160T(ACA), D(GAC)172N(AAC), W(TGG)222L(TTG), H(CAT)435N(AAC), and D(GAC)489N(AAC), differed in the avian precursor virus compared to H3N2 CIV. Moreover, six of the mutated amino acids were due to A mutations, which were abundant among H3N2 CIVs. Of note, our analysis revealed consistently more non-synonymous substitutions per site compared with reservoir H3N2 AIVs (Fig. ). In H3N2 CIVs, the mean dN/dS values were 0.349 in HA and 0.259 in NA, whereas the equivalent values in the avian viral forms were 0.116 for HA and 0.157 for NA. This might be due to host-specific selection after transfer.
Fig. 6 ML phylogenetic trees of the HA and NA(A) genes reconstructed with 597 sequences and phylogenetic tree of the HA(B) gene constructed with 43 H3N2 CIVs and 20 AIVs and the dN/dS(C) value of the influenza viruses (including avian, canine, and human) corresponding to the HA and NA genes (H3N2 AIVs are blue, CIVs are pink, and the human influenza virus is orange)
Dinucleotide abundance influences the codon usage bias of H3N2 CIV coding sequences
We calculated the occurrence of the 16 dinucleotide frequencies to understand their influence in codon usage choice (Fig S5). We found that all dinucleotides were non-random, with no dinucleotide being overrepresented, while dinucleotides CpG and UpA were underrepresented (<0.7). In the RSCU analysis, both CpG (UCG, CCG, ACG, GCG, CAG, CGU, CGC, and CGG) and UpA (UUA, CUA, AUA, GUA, UCA, UAU, UAC, and AUU) were not optional in the relative amino acids. Furthermore, no overrepresented codons were found, except for the codons encoding Tyr (UAU and UAC). This demonstrated that dinucleotide occurrence affects the codon usage bias of the complete coding sequences of H3N2 CIVs.
Discussion
The H3N2 CIV genome undergoes evolutionary changes. Two vital patterns contribute to influenza A virus evolution: shift and driftCitation26. The occurrence of mutations over time leading to evolutionary drift can be explained by codon usage bias. Here 43 strains from different geographical areas were thoroughly analyzed to reveal the synonymous codon usage patterns and the evolutionary history of H3N2 CIVs. The analysis was conducted for individual segments and specific clades. Previously identified reassortment sequencesCitation4, Citation25, Citation26,] or low-quality sequences were excluded since they can mislead tree topology. According to the timescaled phylogenetic tree, three clades were identified, namely, the Origin clade, the China clade, and the Korea/USA clade. The phylogenetic tree topology was also consistent with our another unpublished study about H3N2 CIV evolution and a previous studyCitation4. Hence, it is interesting to note that the PCA distribution of complete coding sequences was consistent with the phylogenetic structure, supporting the idea that PCA can reflect the evolutionary clade classification from the perspective of codon usage analysisCitation28.
Previous studies typically concentrated on calculating the nucleotide/codon frequency to determine codon usage biasCitation23, Citation29. The H3N2 CIV complete coding sequences were rich in A/U in triplet codons and mononucleotides. This phenomenon demonstrated that codon usage bias plays a role in H3N2 CIV evolution. We then measured the degree of codon usage bias. We found a low ENC value for the H3N2 CIV genome, indicating a low codon usage bias. Other studies have also reported low codon usage biases for other influenza A viruses, such as H3N8 EIV (mean value of 52.09)Citation23, the H5N1 influenza virus (mean value of 50.91)Citation22, and H1N1pdm IAV (mean value of 52.5)Citation11. In addition, other RNA viruses also show low codon biases, including ZIKV (mean value of 53.93)Citation10, Marburg virus (mean value of 54.2), and Ebola virus (mean value of 57.23)Citation19. An explanation for low codon usage bias in RNA viruses is that it reduces the resistance of host cells to viral genome replicationCitation10. Therefore, we hypothesized that the low codon usage bias of H3N2 CIV could have contributed to the CIV epidemic. Mutation pressure and natural selection are commonly thought to be major drivers of codon usage bias. ENC plots depicted that all strains were under the expected curve regardless of individual genes or clade evolution, demonstrating that in addition to mutation pressure and natural selection, other forces contribute to codon usage. In addition, correlation analysis of codon usage indices suggests the existence of mutation pressure and natural selection. Therefore, we investigated how mutation pressure and natural selection govern codon usage. Using the PR2 method, we found that A/U-terminated codons predominated over G/C-terminated codons in the fourfold degenerated codon families, which was consistent with the finding that A/U-ended codons were abundant in the complete coding sequences of H3N2 CIVs. The same phenomenon was observed when the analysis was performed using individual genes, although the A/U termination differed among the genes, indicating that the eight genes diverged during evolution. Analysis of EIV H3N8 showed that natural selection was a stronger force than mutation pressureCitation23. Using neutrality analysis, we found that the natural selection percentage constrained the codon usage by 82.63% compared to 17.37% for mutation pressure. Additionally, P12 and P3 were significantly correlated. Importantly, detailed descriptions of the eight individual genes also confirmed that natural selection dominated over mutation pressure.
The phenomenon that A/U-preferred codons governed the selection pressure of the complete coding sequences of H3N2 CIVs was confirmed not only via the codon composition analysis but also by PR2 analysis. Additionally, optional codon usage was previously reported to largely rely on the relative host(s), which was reflected by RSCU analysis between viruses and their corresponding host(s)Citation10. In the present study, RSCU analysis of H3N2 CIVs with their natural host (canines) and potential hosts (humans, felines, and chickens) revealed discordant codon usage of H3N2 CIVs. This was consistent with reports on ZIKVCitation10 but distinct from the completely unanimous patterns observed for the poliovirusCitation30 and hepatitis A virusCitation31. The complex codon usage pattern of H3N2 CIVs relative to its hosts can be explained because consistent synonymous codons allow sufficient protein translation, while inconsistent codon usage allows proper protein foldingCitation32. CAI analysis revealed that the viral expression level adapts to the corresponding host(s). A higher CAI indicates strong adaptationCitation33, which strongly demonstrates natural selection. The CAI values were highest in chickens, followed by humans, canines, and felines. These results might be because H3N2 CIVs originated from avian species and then were transmitted to canines and felines, with the potential risk of human infection. For example, other studies have previously reported that house cats are reservoirs of influenza and can spread it to humans;Citation8, Citation34 however, this requires further investigation. Additionally, using SiD and RCDI analysis, we discovered that canines and felines significantly shaped the H3N2 CIV codon usage compared with chickens and humans, which may be because canines and felines have been crucial in the H3N2 CIV epidemics.
Based on the combined results of the CAI, SiD, and RCID analyses, we discovered a low codon usage bias in the HA gene, possibly due to the role of HA gene in triggering immune responseCitation35. Therefore, we hypothesized that H3N2 CIV originated from the avian influenza A virus, followed by transmission to canines and felines with successful preliminary adaptation in dogs. Interestingly, a previous study showed that the USA H3N2 CIVs and the recent strains isolated in South Korea exhibited changes in the receptor binding and antigenic sites of the HA gene (Gly to Ser change in position 146 in the Korea/USA clade)Citation4. Consistent with this, the Korea/USA sequences displayed the highest relationship between H3N2 CIV and its hosts. Moreover, CAI analysis suggested that the eight segments are also adapted to the human species similar to canines and felines. Thus, the H3N2 CIVs circulating in the canine population may acquire amino-acid changes, particularly in the receptor-binding sites (changes from a-2,3-linked sialic receptors to a-2,6-linked sialic receptors)Citation34, which could aid adaptation to humans. Canine-specific mutations that differentiate H3N2 CIV from avian reservoir viruses have been reported in previous studiesCitation26, Citation27. Of note, we discovered that most mutant amino sites among H3N2 CIV compared with the avian precursor virus involved A changes. In addition, amino acid 222 was located at the H3N2 CIV receptor-binding site. RSCU analysis of different influenza viruses (avian, canine, and human) revealed that UUG (encoding amino acid 222) was abundant, demonstrating that codon usage can reveal viral evolution. Emerging viruses were considered to undergo host-specific selection after transferring to new hosts, thus improving the viral replication and transmissibility. Apart from mutation pressure and natural selection, other factors, such as dinucleotide abundance, are considered to influence codon usage bias. We found no overrepresented dinucleotides in the H3N2 CIV genome, but CpGs and UpAs were underrepresented. Unmethylated CpGs, recognized by the intracellular pattern recognition receptor-toll-like receptor 9, are believed to trigger the immune responseCitation36. Therefore, low CpG use can be a means of evading immune responses. Since CpG underrepresentation is attributed to the U/A-biased codons in single-stranded negative-sense RNA viruses, the dinucleotide usage influences the codon usage bias. Since UpAs were underrepresented, dinucleotide abundance was minor in driving the H3N2 CIV codon usage bias.
In conclusion, this study shows that from the first identified H3N2 CIV strains in 2006 to the recent epidemic, natural selection, mutation pressure, and dinucleotide abundance shape the codon usage of H3N2 CIVs. Specifically, natural selection was more important than the other factors. Interestingly, previous studies found that during pet-to-human transmission, H7N2 AIV receptor-binding sites were changedCitation34. The codon usage analysis performed here, both on the hosts and on the H3N2 CIVs, allowed us to hypothesize that during long-term circulation, H3N2 CIVs may cause potential future risks to companion hosts and veterinary personnel. Therefore, more epidemiologic surveys, systemic evolutionary analyses, and monitoring are needed.
Materials and Methods
Sequence information
Forty-eight complete genomes, including eight segmented complete H3N2 CIV coding sequences, deposited in the Influenza Virus Resource at the National Center for Biotechnological Information (http://www.ncbi.nlm.nih.gov/genomes/FLU/FLU.html) were analyzed in this study. Additionally, 259 complete avian influenza virus HA and NA genes and 295 complete human influenza virus HA and NA genes were also analyzed. Detailed information, including accession number, strain name, collection date, and country of isolation, is listed in supplemental material Table S1. Additionally, the complete coding sequences were concatenated in the following order: PB2 + PB1 + PA + HA + NP + NA + MP + NS.
Reassortment event removal and phylogenetic tree reconstruction
Reassortment events confuse the codon usage patternCitation37, Citation38 and phylogenetic tree topology;Citation39 therefore, reassortant strains were removed based on previous studies and evidenced from the phylogenetic trees. Alignments were performed using Muscle. Timescaled phylogenetic trees were reconstructed using BEAST (version 1.8.0)Citation40. We used Bayesian Markov Chain Monte Carlo (MCMC) method to infer phylogenetic trees. The optimal nucleotide substitution model was estimated using MEGA 7.0. The HKY85 plus gamma distribution substitution model was used in BEAST. Additionally, Bayesian skyline coalescent prior was assumed with a relaxed lognormal clock. The MCMC chains were run twice independently for 108 generations and sampled every 10 000 steps. Runs were further combined using LogCombiner softwareCitation41. Using the TreeAnnotator program in the BEAST package, a target tree was summarized by selecting the tree with the largest posterior probability with a 10% burn-in. Additionally, 597 complete H3N2 HA and NA sequences, including 43 CIV sequences, 259 complete avian influenza virus sequences, and 295 complete human influenza virus sequences, were used to reconstruct the maximum likelihood phylogenetic tree using RAxMLCitation42.
Codon usage parameters
Nucleotide and codon usage composition
To explore codon usage bias, the nucleotide frequencies of A, U, C, and G and the total content of AU and GC were calculated using BioEdit. Additionally, the GC contents at the first, second, and third synonymous codon positions (GC1s, GC2s, and GC3s) were calculated by Emboss: cuspCitation43. The codon compositions at the third position (A3%, U3%, C3%, and G3%) were computed using the CodonW 1.4.2 package. Five non-bias codons were excluded, namely, AUG and UGG, since they are the only codons encoding Met and Trp, respectively, and UAA, UAG, and UGA, which encode termination codons.
Effective number of codons
The ENC value, which indicates the degree of codon usage bias, ranges from 20 to 61. The smaller the ENC value is the stronger is the bias, and a value of 35 is the cutoff point (<35 indicates significant bias and vice versaCitation44). The ENC value was calculated as follows:where Fi (i = 2, 3, 4, 6) represents the mean value of Fi for i-fold degenerate codon families. The Fi value was calculated using the following formula:
where n is the total number of codon occurrences for a given amino acid and nj is the total number of jth codon frequencies for that amino acid.
Relative synonymous codon usage
The synonymous codon usage bias was also evaluated using RSCU values, which can accurately express the synonymous codon frequencies, avoiding the confounding factors of amino-acid composition and coding sequence length. The RSCU was calculated as follows:where Xij is the number of occurrences of the ith codons for the jth amino acid and ni is the number of synonymous codons that encode the ith amino acid. An RSCU value > 1.0 represents positive codon usage bias, while a value <1.0 indicates negative bias. Additionally, synonymous codons with RSCU values > 1.6 and <0.6 suggest “overrepresented” and “underrepresented” codons, respectivelyCitation45. RSCU values were calculated using MEGA 7.0.
Effect of mutation pressure on codon usage bias
ENC-plot analysis
To explore the factors influencing codon usage bias, ENC-plot analysis was performed by plotting ENC values against GC3s. Plotting ENC-GC3s near the standard curve of the expected ENC values suggests a specific role of mutation pressure driving codon usage bias; otherwise, other factors are contributing. The expected ENC was calculated as follows:where “s” is the frequency of G + C at the third codon position of synonymous codons.
Neutrality analysis
The relationship between GC12s (P12) and GC3s (P3), referred to as the neutrality analysis, was used to identify the roles of mutation and natural selection on codon usage bias. GC12s was plotted against GC3s, and linear regression was calculated by GraphPad Prism 5.0. An equation slope near 1 indicates that GC12s and GC3s are significantly correlated, and mutation pressure is the dominant factorCitation46. Conversely, if the value tends to the abscissa or the ordinate, natural selection is the dominant factor.
Natural selection on codon usage bias
Aroma and Gravy indices
Aroma and Gravy were used to understand the factors influencing codon usage. Aroma indicates the aromatic amino-acid frequency, while Gravy indicates the hydropathic amino-acid frequency. The values range from −2 to 2Citation23 and were calculated using the CodonW package.
CAI analysis
The H3N2 CIV codon usage patterns were compared to those of different host species (Homo sapiens, Canis familiaris, Felis catus, and Gallus gallus). The host data were extracted from the Codon Usage Database (http://www.kazusa.or.jp/codon/). The CAI value by reference codon usage database of the different potential hosts ranged from 0 to 1. The calculation method was performed as previously describedCitation47 (http://genomes.urv.cat/CAIcal/RCDI/), and the five non-bias codons were excluded. High values indicate that the codon usage bias of the strain is significant and more adaptable to that hostCitation33.
RCDI analysis
The RCDI value of eight segmented complete coding sequences of H3N2 CIV strains were calculated by the RCDI/eRCDI SERVER (http://genomes.urv.cat/CAIcal/RCDI/)Citation47. The five non-bias codons were excluded. The reference codon usage table of potential hosts was obtained from the codon usage database (http://www.kazusa.or.jp/codon/). All above data were used to determine the codon deoptimization trends. An RCDI value of >1 means that the H3N2 CIV codon usage pattern is adapted to the host. Unlike CAI, if the value is higher, it indicates that the codon usage pattern deviates from the hostCitation48.
SiD analysis
To determine the H3N2 CIV codon usage bias compared with the codon usage for different host species, SiD analysis was performed. The value was calculated as follows:where ai is the RSCU value of 59 synonymous codons from the H3N2 CIV complete coding sequences and bi is the RSCU value of the identical codons in the potential host. R (A, B) is defined as the cosine of the angle between A and B and represents the degree of similarity between the H3N2 CIVs and the host codon usage patterns. D (A, B) represents the potential effect of the overall codon usage of the host. Higher SiD values are thought to suggest stronger host adaptation.
Principal component analysis
PCA, a multivariate statistical method, was used to reflect the major tendency of the synonymous codon usage pattern in the H3N2 CIV coding sequences. The RSCU values were transformed into small numbers of uncorrelated variables (59-dimensional vector), which were principal components represented by the axis, and the percentage of each axis was calculated by CodonW. To detect H3N2 CIV coding sequence clustering, the first two axes were plotted (Axis1 against Axis2 of each strain).
PR2 analysis
PR2 analysis, corresponding to the fourfold degeneration codons, is frequently used to understand the roles of mutation pressure and natural selection in driving complete gene codon usageCitation49. It entails plotting the relationships of the codons at the third position, A3/(A3 + U3), in the abscissa against G3/(G3 + C3) in the ordinate. If A = U and G = C, the values sit in the center of the plot (both coordinates are 0.5), indicating equal roles of mutation pressure and selection rates (substitution rates);Citation50 otherwise, bias exists.
Correlation analysis
Pearson correlations among the A%, U%, G%, C%, A3s, U3s, G3s, C3s, GC3s, ENC, Aroma, Gravy, Axis1, and Axis2 were calculated using GraphPad Prism 5. The correlation coefficients and p values were used to test significance. p values < 0.01 and 0.05 < p < 0.01 denote extremely significant correlations and significant correlations, respectively. Mean and SDs were calculated using Microsoft Excel, and the differences in ENC were calculated using analysis of variance.
dN/dS analysis
dN/dS values of all reported avian influenza viral strains and the selected CIV and human influenza virus strains were estimated using DATAMONKEY (http://www.datamonkey.org/). Alignments were performed using Muscle after removing termination codons.
Dinucleotide frequency analysis
The frequencies of 16 dinucleotides per strain were calculated using DAMBE software. The ratio was calculated as follows:where rx and ry represent the frequency of nucleotides X and Y, respectively, while rxy represents the observed dinucleotide XY value, and ryrx represents the expected value of the dinucleotide XY. It is normally considered that the XY dinucleotide is overrepresented when Pxy is >1.23 and underrepresented when it is <0.78Citation51.
Table s1
Download MS Word (167.3 KB)FIGURE S1
Download PDF (23.6 KB)FIGURE S2
Download PDF (368.6 KB)FIGURE S3
Download PDF (6.8 MB)FIGURE S4
Download PDF (18.9 KB)FIGURE S5
Download PDF (13.8 KB)Acknowledgements
This work was financially supported by the National Key Research and Development Program of China (2017YFD0500101), the China Association for Science and Technology Youth Talent Lift Project, the Natural Science Foundation of Jiangsu Province (BK20170721), the Fundamental Research Funds for the Central Universities (Y0201600147), and the Priority Academic Program Development of Jiangsu Higher Education Institutions.
Conflict of interest
The authors declare that they have no conflict of interest.
Electronic supplementary material
Supplementary Information accompanies this paper at (10.1038/s41426-018-0079-0).
Related Research Data
References
- LiSAvian-origin H3N2 canine influenza A viruses in Southern ChinaInfect. Genet. Evol.201010 1286 128810.1016/j.meegid.2010.08.0102950248
- DaesubSExperimental Infection of dogs with avian-origin canine influenza A virus (H3N2)Emerg. Infect. Dis.2009155610.3201/eid1501.080755
- SunchaiPInfluenza A virus (H3N8) in dogs with respiratory disease, FloridaEmerg. Infect. Dis.20081490210.3201/eid1406.071270
- IanEHVSpread of canine influenza A(H3N2) virus, United StatesEmerg. Infect. Dis.201723195010.3201/eid2312.170246
- BunpapongNGenetic characterization of canine influenza A virus (H3N2) in ThailandVirus Genes201448566310.1007/s11262-013-0978-z
- DaesubSTransmission of avian influenza virus (H3N2) to dogsEmerg. Infect. Dis.20081474110.3201/eid1405.071471
- LeeIWComparison of the virulence and transmissibility of canine H3N2 influenza viruses and characterization of their canine adaptation factorsEmerg. Microbes Infect.2018710.1038/s41426-017-0013-x5841232
- BrettASInfluenza a pandemic (H1N1) 2009 virus infection in domestic catEmerg. Infect. Dis.20101653410.3201/eid1603.091737
- FranzoGTucciaroneCMCecchinatoMDrigoMCanine parvovirus type 2 (CPV-2) and Feline panleukopenia virus (FPV) codon bias analysis reveals a progressive adaptation to the new niche after the host jumpMol. Phylogen. Evol.2017114829210.1016/j.ympev.2017.05.019
- ButtAMNasrullahIQamarRTongYEvolution of codon usage in Zika virus genomes is host and vector specificEmerg. Microbes Infect.2016510.1038/emi.2016.1065117728
- AnhlanDGrundmannNMakalowskiWLudwigSScholtissekCOrigin of the 1918 pandemic H1N1 influenza A virus as studied by codon usage patterns and phylogenetic analysisRNA201117647310.1261/rna.23952113004067
- Behura SusantaKSeverson DavidWCodon usage bias: causative factors, quantification methods and genome‐wide patterns: with emphasis on insect genomesBiol. Rev. Camb. Philos. Soc.201288496110.1111/j.1469-185X.2012.00242.x
- PepinKMDomsicJMcKennaRGenomic evolution in a virus under specific selection for host recognitionInfect. Genet. Evol.2008882583410.1016/j.meegid.2008.08.008
- ChenHSunSNorenburgJLSundbergPMutation and selection cause codon usage and bias in mitochondrial genomes of ribbon worms (Nemertea)PLoS ONE20149e8563110.1371/journal.pone.00856313893253
- GranthamRGautierCGouyMMercierRPavéACodon catalog usage and the genome hypothesisNucleic Acids Res.1980819719710.1093/nar/8.1.197-c
- Parmley JoannaLHurst LaurenceDHow do synonymous mutations affect fitness?Bioessays20072951551910.1002/bies.20592
- HussainSRasoolSTAnalysis of synonymous codon usage in Zika virusActa Trop.201717313614610.1016/j.actatropica.2017.06.006
- van HemertFvan der KuylACBerkhoutBImpact of the biased nucleotide composition of viral RNA genomes on RNA structure and codon usageJ. Gen. Virol.2016972608261910.1099/jgv.0.000579
- CristinaJMorenoPMoratorioGMustoHGenome-wide analysis of codon usage bias in EbolavirusVirus Res.2015196879310.1016/j.virusres.2014.11.005
- SinghNKTyagiAKaurRVermaRGuptaPKCharacterization of codon usage pattern and influencing factors in Japanese encephalitis virusVirus Res.2016221586510.1016/j.virusres.2016.05.008
- GoñiNPandemic influenza A virus codon usage revisited: biases, adaptation and implications for vaccine strain developmentVirol. J.2012926310.1186/1743-422X-9-2633543350
- ZhouTGuWMaJSunXLuZAnalysis of synonymous codon usage in H5N1 virus and other influenza A virusesBioSyst200581778610.1016/j.biosystems.2005.03.002
- KumarNRevelation of influencing factors in overall codon usage bias of equine influenza virusesPLoS ONE201611e015437610.1371/journal.pone.01543764847779
- LiuXWuCChenAYHCodon usage bias and recombination events for neuraminidase and hemagglutinin genes in Chinese isolates of influenza A virus subtype H9N2Arch. Virol.201015568569310.1007/s00705-010-0631-2
- MoonHH3N2 canine influenza virus with the matrix gene from the pandemic A/H1N1 virus: infection dynamics in dogs and ferretsEpidemiol. Infect.201414377278010.1017/S0950268814001617
- ZhuHHughesJMurciaPROrigins and evolutionary dynamics of H3N2 canine influenza virusJ. Virol.2015895406541810.1128/JVI.03395-144442499
- YangGMutation tryptophan to leucine at position 222 of haemagglutinin could facilitate H3N2 influenza A virus infection in dogsJ. Gen. Virol.2013942599260810.1099/vir.0.054692-04093785
- BeraBCGenetic and codon usage bias analyses of polymerase genes of equine influenza virus and its relation to evolutionBMC Genomics20171810.1186/s12864-017-4063-15568313
- LiuXsZhangYgFangYzWangYlPatterns and influencing factor of synonymous codon usage in porcine circovirusVirol. J.201296810.1186/1743-422X-9-683341187
- MuellerSPapamichailDColemanJRSkienaSWimmerEReduction of the rate of poliovirus protein synthesis through large-scale codon deoptimization causes attenuation of viral virulence by lowering specific infectivityJ. Virol.2006809687969610.1128/JVI.00738-061617239
- SánchezGBoschAPintóRMGenome variability and capsid structural constraints of hepatitis A virusJ. Virol.20037745245910.1128/JVI.77.1.452-459.2003140588
- HuJsThe characteristic of codon usage pattern and its evolution of hepatitis C virusInfect. Genet. Evol.2011112098210210.1016/j.meegid.2011.08.025
- SharpPMLiWHThe codon adaptation index-a measure of directional synonymous codon usage bias, and its potential applicationsNucleic Acids Res.1987151281129510.1093/nar/15.3.1281340524
- AtanaskaMPAvian influenza A(H7N2) virus in human exposed to sick cats, New York, USA, 2016Emerg. Infect. Dis.2017232046
- HorimotoTKawaokaYInfluenza: lessons from past pandemics, warnings from current incidentsNat. Rev. Microbiol.2005359110.1038/nrmicro1208
- DornAKippenbergerSClinical application of CpG-, non-CpG-, and antisense oligodeoxynucleotides as immunomodulatorsCurr. Opin. Mol. Ther.2008101020
- ChenYChenYFExtensive homologous recombination in classical swine fever virus: a re-evaluation of homologous recombination events in the strain AF407339Saudi J. Biol. Sci.20142131131610.1016/j.sjbs.2013.12.0044150228
- MaraisGMouchiroudDDuretLDoes recombination improve selection on codon usage? Lessons from nematode and fly complete genomesProc. Natl Acad. Sci. USA200198568810.1073/pnas.09142769833274
- SalterLAThe phylogenetic handbook: a practical approach to DNA and protein phylogenyAm. J. Hum. Biol.20041635435510.1002/ajhb.20017
- HuelsenbeckJPRonquistFMRBAYES: Bayesian inference of phylogenetic treesBioinformatics20011775475510.1093/bioinformatics/17.8.754
- FranzoGCorteyMSegalésJHughesJDrigoMPhylodynamic analysis of porcine circovirus type 2 reveals global waves of emerging genotypes and the circulation of recombinant formsMol. Phylogen. Evol.201610026928010.1016/j.ympev.2016.04.028
- StamatakisARAxML version 8: a tool for phylogenetic analysis and post-analysis of large phylogeniesBioinformatics2014301312131310.1093/bioinformatics/btu0333998144
- RicePLongdenIBleasbyAEMBOSS: the European Molecular Biology Open Software SuiteTrends Genet.20001627627710.1016/S0168-9525(00)02024-2
- ComeronJMAguadéMAn evaluation of measures of synonymous codon usage biasJ. Mol. Evol.19984726827410.1007/PL00006384
- WongEHMSmithDKRabadanRPeirisMPoonLLMCodon usage bias and the evolution of influenza A viruses. Codon Usage Biases of Influenza VirusBMC Evol. Biol.20101025310.1186/1471-2148-10-2532933640
- SueokaNDirectional mutation pressure and neutral molecular evolutionProc. Natl Acad. Sci. USA198885265310.1073/pnas.85.8.2653280056
- PuigbòPBravoIGGarcia-VallveSCAIcal: a combined set of tools to assess codon usage adaptationBiol. Direct2008310.1186/1745-6150-3-382553769
- PuigbòPAragonèsLGarcia-VallvéSRCDI/eRCDI: a web-server to estimate codon usage deoptimizationBMC Res. Notes2010310.1186/1756-0500-3-872853550
- SueokaNIntrastrand parity rules of DNA base composition and usage biases of synonymous codonsJ. Mol. Evol.19954031832510.1007/BF00163236
- SueokaNTranslation-coupled violation of Parity Rule 2 in human genes is not the cause of heterogeneity of the DNA G+C content of third codon positionGene1999238535810.1016/S0378-1119(99)00320-0
- NasrullahIButtAMTahirSIdreesMTongYGenomic analysis of codon usage shows influence of mutation pressure, natural selection, and host features on Marburg virus evolutionBMC Evol. Biol.20151517410.1186/s12862-015-0456-44550055