
Abstract
In recent years, the morbidity of Mycoplasma pneumoniae pneumonia (MPP) has dramatically increased in China. An increasing number of studies indicate that an imbalance in the respiratory microbiota is associated with respiratory infection. We selected 28 hospitalized patients infected with M. pneumoniae and 32 healthy children. Nasopharyngeal (NP) and oropharyngeal (OP) swabs were collected from healthy children, whereas NP, OP and bronchoalveolar lavage (BAL) specimens were collected from patients. Microbiota analysis was performed on all microbial samples using 16 S ribosomal RNA (16 S rRNA) sequencing. The NP microbial samples in healthy children were divided into two groups, which were dominated by either Staphylococcus or mixed microbial components. The respiratory microbiota in pneumonia patients harbored a lower microbial diversity compared to healthy children, and both the NP and OP microbiota of patients differed significantly from that of healthy children. Hospitalized MPP children with a higher abundance of Mycoplasma in the BAL fluid (BALF) microbiota tended to suffer longer hospitalization lengths and higher peak fevers and serum C-reactive protein levels. Concordance analysis explained the succession of imbalanced NP microbiota to the OP and lung in diseased children. However, the association of the abundance of Mycoplasma in BALF microbiota with that in NP or OP microbiota varied among individuals, which suggested the sensitivity of BALF in MPP diagnostics, mirroring MPP severity.
Introduction
The respiratory tract is home to a variety of microbial commensals that cultivate the immune system and confer resistance to colonization of pathogensCitation1, Citation2. Increasing reports have demonstrated the association of altered respiratory microbiota with disease severity in acute respiratory infections (ARIs), such as bronchiolitis and pneumoniaCitation3–Citation5. Mycoplasma pneumoniae pneumonia (MPP) is resulting in an increasingly high morbidity in Chinese childrenCitation6. Previous studies have also demonstrated the alterations of the nasopharynx (NP) and oropharynx (OP) microbiota in MPP, as well as microbiota transmission between the NP and OPCitation5, Citation7, Citation8.
However, imbalanced lung microbiota in MPP remains unexplored. Meyer Sauteur PM et al. showed that the clearance of M. pneumoniae in the lung differed significantly from that in the NPCitation9, which suggested different alterations of lung microbiota in MPP compared to the NP/OP. In addition, the use of bronchoalveolar lavage fluid (BALF) is a more sensitive measure for the establishment of microbial diagnosisCitation10 and assessment of disease severity compared with NP and OP swabsCitation11, Citation12. Given that BALF collection is restricted to cases of severe disease, it is imperative to explore the possibility of predicting lung microbiota alterations via NP or OP microbiota analysis.
In this study, we enrolled 28 MPP and 32 healthy children to analyze respiratory microbiota via 16 S rRNA analysis. We intended to answer the following two questions: 1) how the imbalanced NP/OP microbiota is associated with lung microbiota in MPP and 2) how altered respiratory microbiota is associated with MPP severity.
Results
Sample characteristics
Both healthy and diseased children were not exposed to antibiotics for at least one month prior to sampling to ensure no confounding effect of antibiotics on the respiratory microbiota. None of the recruited healthy children suffered any chronic respiratory diseases or acute respiratory infection during the one month prior to sampling and for one week after sampling. Selected patients had chest radiographic abnormalities consistent with pneumonia (Table ). Notably, the average hospitalization length of MPP children with a history of pneumonia was longer than that of other patients (Table S1).
Sample information
Data output and confounder assessment
A total of 8,177,030 high-quality tags were produced, averaging 41,846 (27,666–56,342), 30,848 (15,558–53,235), 67,467 (25,505–77,144), 73,856 (45,551–77,154) and 67,634 (19,862–77,454) for the NP-healthy (NP-H), OP-healthy (OP-H), NP-pneumonia (NP-P), OP-pneumonia (OP-P), and BALF groups, respectively. The average OTU numbers in the NP-H, OP-H, NP-P, OP-P, and BALF groups were 460, 343, 242, 134, and 763, respectively. Association analysis indicated that the onset of pneumonia most significantly explained the variations in microbial samples (p-value < 0.001) (Table S2). The concentration of extracted DNA in the unused sampling swabs and DNA extraction kits was lower than 0.01 ng/μl, whereas it was higher than 80 ng/μl in the sampling swabs and BALF. In addition, 16 S rRNA gene amplification on the extracted DNA indicated less than 0.01 nmol/l bacterial DNA in the enveloped sampling or extraction materials.
The alterations of NP and OP microbiota in MPP patients
There was no difference between bacterial diversity in the OP microbiota of MPP patients and that of healthy children (Fig. ). NP microbial samples in healthy children were divided into two clusters based on principal component analysis (PCA) (Fig. ), whereas OP microbial samples in healthy and diseased children were clearly separated (Fig. ). In parallel, the bacterial richness and evenness in the NP microbiota of the two clusters differed significantly in healthy children (Fig. ).
a Shannon index of NP and OP microbiota in patients and healthy infants; healthy NP samples were further divided into NP-H1 and NP-H2. Asterisk (*) and (**) represent p-values of ≤0.05 and ≤0.01. NS represents not significant. b Principal component analysis (PCA) of NP and OP samples. Points colored green, blue, red and purple represent samples from NP-H1, NP-H2, OP-H, NP-P, and OP-P, respectively
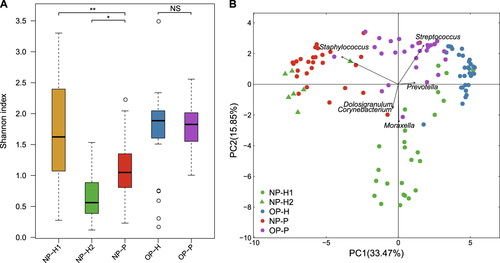
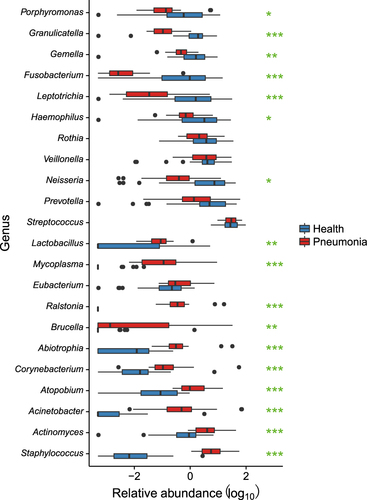
Compared to the other twenty-five NP-H samples (NP-H1), we identified a lower bacterial diversity in seven NP-H samples (NP-H2) (Fig. ), which were clustered in the NP-P group (Fig. , p-value < 0.01). Further analysis indicated that Staphylococcus dominated in the NP-H2 (81.87%) and NP-P (62.28%) microbiota, whereas NP-H1 microbiota mainly comprised Moraxella (21.66%), Streptococcus (11.97%), Corynebacterium (11.44%) and Dolosigranulum (10.22%) (Fig. S1, Table S3). Conversely, the OP microbiota structure was similar in all healthy children (Table S3), comprising highly abundant Streptococcus (35.94%, vs. 31.32% in the OP-P microbiota, q-value = 0.93) and Prevotella (12.43%, vs. 6.82% in the OP-P microbiota, q-value = 0.09) (Fig. ). In addition, Staphylococcus, Corynebacterium and Mycoplasma were significant components in the OP-P microbiota (Fig. ).
The vertical axis represents the genus name, and the horizontal axis shows the log10 value of relative abundance. Asterisk (*), (**), and (***) represent q-values of ≤0.05, ≤0.01, and ≤0.001, respectively
Significant association of lung microbiota with disease severity in MPP patients
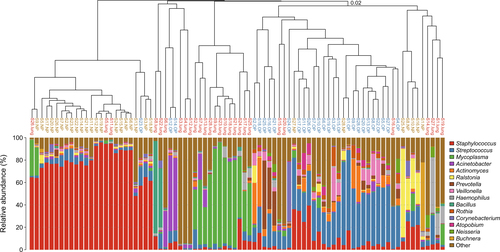
The hierarchical cluster analysis (Fig. ) showed that one cluster was composed of only 12 BALF samples (BALF-1) (Fig. ), with Mycoplasma being dominant (61.40%, 32.91–93.69%) in the lung microbiota (Table S4). Significantly decreased levels of Mycoplasma (4.08%, 0.12–32.24%) were verified in the lung microbiota in the remaining 16 BALF samples, which were identified in the NP or OP clusters (BALF-2) and featured Haemophilus, Staphylococcus or novel microbial genera as the dominant isolates in the lung microbiota (Fig. ). The bacterial diversity in BALF-1 is higher than that in BALF-2, but the difference is not significant (Figure S2).
Clustering was based on the Bray-Curtis dissimilarity distance. The clade names colored yellow, blue and red represent samples originating from the NP, OP and lung, respectively
The peak fever was higher in BALF-1 patients than in BALF-2 patients (40.2 °C vs. 39.4 °C, p-value < 0.05) (Table S1). The length of hospitalization and length of persistent fever were also longer in BALF-1 patients (average 12.8 days and 14.4 days) compared with the BALF-2 (average 9.8 days and 7.1 days) group (p-value = 0.267 and <0.05). In addition, we identified a higher abnormal CRP ratio in the BALF-1 group (10/12 in BALF-1, 6/16 in BALF-2) (Table S1). Subject S10, who previously had pneumonia, suffered the longest hospitalization period (37 days) and had an extremely high level of serum CRP (121.2 mg/l) during hospitalization, which may be caused by bilateral pulmonary effusion and necrotizing lung consolidation (Table S1). This can be attributed to severe M. pneumoniae infection, with 76.39% of the lung microbiota being Mycoplasma (Table S4), and exposure to various empirical antibiotics (Table S1).
Similarity of microbial communities between respiratory niches in MPP patients
The similarity between upper respiratory tract (URT) and lower respiratory tract (LRT) microbiota was assessed to determine whether URT microbiota could mirror or predict microbiota imbalances in the lung. A non-metric multidimensional scaling (nMDS) analysis showed that the lung microbiota was more similar to that of the NP than the OP (Fig. ). Additionally, NP microbial samples were clustered between BALF and OP samples (Fig. ), which indicated the transmission of NP microbiota to both the lung and OP.
Dots colored yellow, blue and red represent samples originating from the NP, OP and lung respectively. Ellipses around the geometric mean are the standard deviations of niche samples
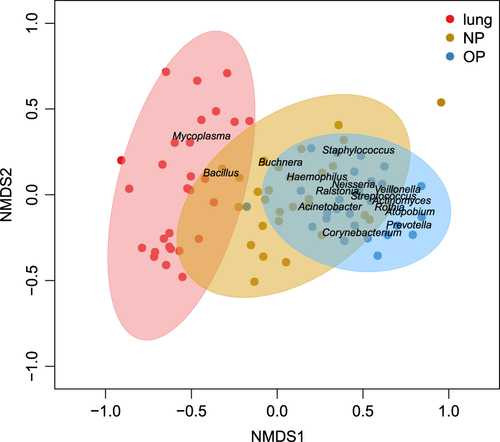
Of the top fifteen genera in URT and LRT microbiota, the abundances of Staphylococcus, Corynebacterium and Haemophilus were not different between the OP and lung microbiota (Table , Fig. S3). By comparison, we observed a decrease in Streptococcus and Prevotella in both the NP and lung microbiota (Table ). Mycoplasma dominated the BALF microbiota (28.64%), which, however, was in low abundance in the URT (1.96% in NP and 0.60% in OP microbiota) (Table ). Ralstonia and Atopobium represented ≤0.05% of the lung microbiota, whereas Acinetobacter and Buchnera were not significantly different among the NP, OP and lung (Table ).
Comparison of top 15 genera between the URT and LRT in MPP patients
Individual-specific NP and OP microbiota compared to the BALF
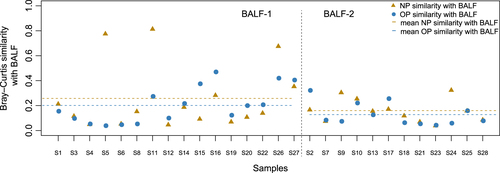
Bray–Curtis similarity measures were applied to assess the concordance between the NP, OP and BALF microbiota in hospitalized children. We observed variable intra-individual concordance between NP/OP and BALF, and the similarity between the NP and BALF microbiota was higher than that between the OP and BALF microbiota (Fig. ). In the BALF-1 group, we identified a higher similarity between the NP and BALF microbiota and the OP and BALF microbiota compared with the BALF-2 group (Fig. ). In parallel, the abundance of Mycoplasma was higher in the NP and OP microbiota of patients in the BALF-1 group compared to the BALF-2 group (Fig. S2, Table S4). For two individuals, S5 and S11 in the BALF-1 group, we identified Staphylococcus as being dominant (94.50% and 94.81%, respectively) in the lung microbiota, as well as a high similarity between the lung and NP microbiota (Fig. , Table S4). The present clinical tests identified M. pneumoniae in BALF samples even with 0.12% Mycoplasma (patient S4) in the lung microbiota (Table S4), which suggested the accuracy and sensitivity of the current MPP diagnostics based on BALF. However, it is difficult to establish an M. pneumoniae diagnosis by NP or OP swab, given that M. pneumoniae represented less than 0.05% of the URT microbiota in individuals with 1.35–54.52% M. pneumoniae in the lung microbiota (Table S4).
The 16 subjects on the left represent patients according to BALF-2, and the 12 subjects on the right represent patients according to BALF-1. Points colored blue are the similarity indices between the NP and BALF, and triangles colored yellow are the similarity indices between the OP and BALF
Discussion
Emerging reports have demonstrated the pivotal role of respiratory microbiota in immune system education and resistance to colonization by pathogenic organismsCitation2, Citation13. Several studies revealed various patterns of the NP microbiota in healthy children, with different susceptibilities to ARICitation14–Citation16. Our study also identified the divergence of NP microbiota in healthy children, which was dominated by either Staphylococcus or mixed microbial components. A Staphylococcus-dominated NP microbiota pattern was reported to be associated with high severity of disease in ARIs, whereas a mixed NP microbiota pattern suggested a lower ARI riskCitation3, Citation17, Citation18. These differences may explain the clustering of the seven microbial samples with a Staphylococcus-dominated NP microbiota in the NP-P group, and it may also guide the comparison of NP microbiota structures between the two healthy groups (NP-H1 and NP-H2) and the patient group (NP-P). With only a one-week follow-up after sampling, we identified no differences in the clinical characteristics between the NP-H1 and NP-H2 groups. In contrast to the two NP groups identified, the OP microbiota in healthy children showed no significant difference. The respiratory commensals decreased significantly in MPP, including a reduced amount of the lactic acid-producing bacterium Lactobacillus and the short-chain fatty acid producer PorphyromonasCitation19, Citation20. Prevotella, which antagonizes lipid polysaccharides and inhibits mucosal inflammation, was also decreasedCitation21. This may provide clues about the microbial etiology in MPP at the level of the microbiota.
Food ingestion and esophageal reflux affected the oropharyngeal microbial composition, which signifies a higher bacterial richness in the OP than in NP and lungCitation11. Prevaes et al.demonstrated that BALF microbial samples clustered between the NP and OP, showing a higher similarity between the lung and NP microbiota than between the lung and OP microbiota in children with cystic fibrosisCitation22. A prospective study of 112 infants indicated that there was exchange between the NP and OP microbiota in children with high ARI risk in early lifeCitation23. Our study identified the clustering of NP microbial samples between BALF and OP samples, which suggested the transmission of NP microbiota to both the OP and the lung. This may be due to nasal infection and robust pathogenic intrusion of M. pneumoniaeCitation24, which also induced the disequilibrium of OP microbiota in diseased children. Correspondingly, the NP-lung axis should be explored further to identify M. pneumoniae infections and the associated microbiota imbalance, as well as host responses.
Notably, MPP patients can be divided into two groups that feature different levels of Mycoplasma abundance in the lung microbiota. Consistent with previous studies that indicated that the abundance of either Lactobacilli, Rothia or S. pneumoniae was related to the pneumonia severity index (PSI)Citation4, children with a higher load of Mycoplasma in the lung microbiota tended to suffer longer hospital stays, higher peak fevers and abnormal CRP ratios. Compared to patients with a low abundance of Mycoplasma in the lung microbiota, the average proportion of Mycoplasma in NP and OP microbiota was also greater in patients with a high abundance of Mycoplasma in the lung. Nonetheless, the Mycoplasma load in the NP and OP microbiota was not proportional to that in the lung microbiota at the individual level, suggesting the limitations of using URT microbiota to predict MPP severity. This could be explained by the differences in clearance of M. pneumoniae in the lung compared to the URTCitation9. The complex etiology in pneumonia, such as co-infection with unknown pathogens, may explain the long hospitalization lengths and fever durations in patients with a low abundance of M. pneumoniae in the BALF.
Several limitations of this study should also be considered. The short-term follow-up for healthy children made it difficult to assess the susceptibility of different URT microbiota to ARI. The small sample size could impose restrictions on determining the association of respiratory microbiota with disease severity. Moreover, we could neither precisely identify the pathogens at the species level nor reveal functional dysbiosis in the respiratory microbiota in MPP via 16 S rRNA analysis.
In conclusion, we provide significant evidence for an imbalanced URT microbiota in MPP and varied URT microbiota patterns in healthy children. More importantly, we explored the transmission of URT and LRT microbiota, which suggested an association of respiratory microbiota imbalance with severity of disease in MPP.
Materials and methods
Ethical approval
The study was approved by the Ethical Committee of Shenzhen Children’s Hospital under registration number 2016013. The guardians of the recruited children provided their informed consent. All procedures performed in this study were in accordance with the ethical standards of the institutional and/or national research committee, as well as with the 1964 Helsinki declaration and its subsequent amendments or comparable ethical standards.
Sample inclusion and pathogen examination
All children with pneumonia were enrolled from inpatients at Shenzhen Children’s Hospital. The inclusion criteria for patients were as follows: 1) no asthma; 2) a diagnosed M. pneumoniae infection via BALF detection; 3) no antibiotic exposure for at least 1 month before sampling; 4) no admission to a pediatric intensive care unit (PICU); and 5) no mechanical ventilation during hospitalization. Age-matched healthy children were recruited after physical examination in Shenzhen Children’s Hospital according to the following criteria: 1) no asthma or family history of allergies; 2) no history of pneumonia; 3) no wheezing, fever, cough or other respiratory/allergic symptoms at sampling one month prior to the study; 4) no antibiotic exposure within 1 month; and 5) no disease symptoms one week after sampling.
URT and LRT sampling was conducted 3 to 11 days after hospitalization when the diseased children maintained a high fever or had no significant disease remission (Table S1). URT samples were collected by NP (25-800-A-50, Puritan, Guilford, North Carolina, USA) and OP (155 C, COPAN, Murrieta, California, USA) swabs, and BALF was collected by fiberoptic bronchoscopy. The same BALF sample was used for both clinical pathogen detection and 16 S rRNA gene sequencing. All samples were frozen at –80 °C within 10 minutes of sample collection.
Common pathogens were detected by the following methods: bacterial culturing was conducted to detect clinical common bacterial pathogensCitation25, and the nucleic acid testing (NAT) method was applied to identify the viral or atypical pathogens as described previouslyCitation26. Unused swabs and DNA extraction kits were utilized as negative controls to assess experimental contaminationCitation26.
DNA extraction, library construction, and sequencing
The genomic DNA of the microbiota was extracted using the Power Soil DNA Isolation Kit (Mo Bio Laboratories, Carlsbad). A PCR amplicon library was constructed using the V3-V4 hypervariable region of the 16 S rRNA geneCitation14. The qualified libraries were then sequenced with the Illumina MiSeq sequencing platform (Illumina, San Diego, USA)Citation27.
Data processing, statistical analysis, and visualization
Raw sequencing data were processed with the QIIME pipelineCitation28 and in-house scriptsCitation26. Low-quality data filtration, OTU clustering, representative taxon classification and community diversity calculation were conducted as described previouslyCitation26, Citation29. PERMANOVA was used to evaluate the confounding effect of subject characteristics on microbiota compositionCitation30, Citation31. An nMDS plot was used to visualize the concordance of the overall microbial community composition between niches. Inter-group comparisons were performed via the Wilcoxon rank-sum test. Hierarchical clustering of NP, OP and BALF microbial samples in MPP patients was conducted, and the sample backgrounds in different sub-clusters were summarized. Differences in the top fifteen genera in the NP, OP and BALF microbiota were calculated by Kruskal–Wallis tests, and all multiple test results were adjusted by the FDR method. The intra-individual distance between the BALF and NP/OP microbiota was calculated by the Bray-Curtis dissimilarity. All graphs were produced by the package ‘ggplot2’ of the R software (v3.2.3).
Data availability
All the sequencing data have been deposited in GenBank under the accession numbers SRP090593 (healthy children) and SRP130820 (children with pneumonia).
Figure S3
Download PDF (106.8 KB)Figure S1
Download PDF (257.2 KB)Figure S2
Download PDF (78.5 KB)Supplementary Tables
Download MS Excel (184 KB)Acknowledgements
This study was supported by the Key Medical Disciplines Building Project of Shenzhen (201506053), Key Medical Disciplines Building Project of Shenzhen (SZXJ2017005), Guangdong Medical Research Fund (A2016501), Sanming Project of Medicine in Shenzhen [SZSM201512030], Shenzhen public service platform for clinical drug trials (20151964) and Shenzhen Science and Technology Project (JCYJ20170303155012371). We also would like to thank Mr. Xiaofeng Lin from EasyPub for polishing the language when preparing the first submission.
Author contributions
Y.Z. and S.L. managed the project. Z.L., H.W., and G.X. enrolled the children and performed the specimen sampling and common pathogen detection. X.F. and D.L. performed the bioinformatics analysis. Q.Z. and W.D. interpreted the analysis results and wrote the paper. Y.L. and Z.Y. optimized the graphs. Y.L. polished the article. K.S. and Y.Y. provided professional suggestions and revised the manuscript. All authors reviewed this manuscript.
Conflict of interest
The authors declare that they have no conflict of interest.
Electronic supplementary material
Supplementary Information accompanies this paper at (10.1038/s41426-018-0097-y).
Related Research Data
References
- ZhouYBiogeography of the ecosystems of the healthy human bodyGenome Biol.20131410.1186/gb-2013-14-1-r14054670
- Human Microbiome Project C.Structure, function and diversity of the healthy human microbiomeNature2012486 207 21410.1038/nature11234
- HasegawaKAssociation of nasopharyngeal microbiota profiles with bronchiolitis severity in infants hospitalised for bronchiolitisEur. Respir. J.2016481329133910.1183/13993003.00152-20165459592
- de Steenhuijsen PitersWADysbiosis of upper respiratory tract microbiota in elderly pneumonia patientsISME J.2016109710810.1038/ismej.2015.99
- HasegawaKNasal airway microbiota profile and severe bronchiolitis in infants: A case-control studyPediatr. Infect. Dis. J.2017361044105110.1097/INF.0000000000001500
- QinQXuBaopingLiuXShenKStatus of Mycoplasma pneumoniae pneumonia in chinese children: A systematic reviewAdv. Microbiol.2014470471110.4236/aim.2014.411076
- BassisCMAnalysis of the upper respiratory tract microbiotas as the source of the lung and gastric microbiotas in healthy individualsmBio20156e0003710.1128/mBio.00037-154358017
- CharlsonESTopographical continuity of bacterial populations in the healthy human respiratory tractAm. J. Respir. Crit. Care Med.201118495796310.1164/rccm.201104-0655OC3208663
- Meyer SauteurPMThe role of B cells in carriage and clearance of Mycoplasma pneumoniae from the respiratory tract of miceJ. Infect. Dis.201821729830910.1093/infdis/jix559
- BrennanSGangellCWainwrightCSlyPDDisease surveillance using bronchoalveolar lavagePaediatr. Respir. Rev.2008915115910.1016/j.prrv.2008.01.002
- AvitalAUwyyedKPicardEGodfreySSpringerCSensitivity and specificity of oropharyngeal suction versus bronchoalveolar lavage in identifying respiratory tract pathogens in children with chronic pulmonary infectionPediatr. Pulmonol.199520404310.1002/ppul.1950200108
- HuangYJNasopharyngeal microbiota: Gatekeepers or fortune tellers of susceptibility to respiratory tract infections?Am. J. Respir. Crit. Care. Med.20171961504150510.1164/rccm.201707-1470ED
- EspositoSPrincipiNImpact of nasopharyngeal microbiota on the development of respiratory tract diseasesEur. J. Clin. Microbiol. Infect. Dis.2018371710.1007/s10096-017-3076-7
- TeoSMThe infant nasopharyngeal microbiome impacts severity of lower respiratory infection and risk of asthma developmentCell Host Microbe20151770471510.1016/j.chom.2015.03.0084433433
- TanoKvon EssenRErikssonPOSjöstedtAAlloiococcus otitidis--otitis media pathogen or normal bacterial flora?APMIS200811678579010.1111/j.1600-0463.2008.01003.x
- BiesbroekGSeven-valent pneumococcal conjugate vaccine and nasopharyngeal microbiota in healthy childrenEmerg. Infect. Dis.20142020121010.3201/eid2002.1312203901477
- HasegawaKSerum cathelicidin, nasopharyngeal microbiota, and disease severity among infants hospitalized with bronchiolitisJ. Allergy Clin. Immunol.20171391383138610.1016/j.jaci.2016.09.037
- BogaertDVariability and diversity of nasopharyngeal microbiota in children: A metagenomic analysisPLoS One20116e1703510.1371/journal.pone.00170353046172
- ZaunmullerTEichertMRichterHUndenGVariations in the energy metabolism of biotechnologically relevant heterofermentative lactic acid bacteria during growth on sugars and organic acidsAppl. Microbiol. Biotechnol.20067242142910.1007/s00253-006-0514-3
- SatoMThree CoA transferases involved in the production of short chain fatty acids in Porphyromonas gingivalisFront. Microbiol.20167114610.3389/fmicb.2016.011464949257
- MillerSIErnstRKBaderMWLPS, TLR4 and infectious disease diversityNat. Rev. Microbiol.20053364610.1038/nrmicro1068
- Prevaes S. M., et al. Concordance between upper and lower airway microbiota in infants with cystic fibrosis. Eur. Respir. J. 49, 1602235 (2017).
- AATMBosch. Maturation of the infant respiratory microbiota, environmental drivers and health consequences a prospective cohort studyAm. J. Respir. Crit. Care Med.20171961582159010.1164/rccm.201703-0554OC
- Al MasalmaMThe expansion of the microbiological spectrum of brain abscesses with use of multiple 16s ribosomal DNA sequencingClin. Infect. Dis.2009481169117810.1086/597578
- PettigrewMMAssociation of sputum microbiota profiles with severity of community-acquired pneumonia in childrenBMC Infect. Dis.20161610.1186/s12879-016-1670-44939047
- Lu Z., et al. The alteration of nasopharyngeal and oropharyngeal microbiota in children with MPP and non-MPP. Genes8, E380 (2017).
- KozichJJWestcottSLBaxterNTHighlanderSKSchlossPDDevelopment of a dual-index sequencing strategy and curation pipeline for analyzing amplicon sequence data on the Miseq Illumina sequencing platformAppl. Environ. Microbiol.2013795112512010.1128/AEM.01043-133753973
- CaporasoJGQiime allows analysis of high-throughput community sequencing dataNat. Methods2010733533610.1038/nmeth.f.3033156573
- WangHMycoplasma pneumoniae and Streptococcus pneumoniae caused different microbial structure and correlation network in lung microbiotaJ. Thorac. Dis.201681316132210.21037/jtd.2016.04.634885968
- KellyBJComposition and dynamics of the respiratory tract microbiome in intubated patientsMicrobiome2016410.1186/s40168-016-0151-84750361
- YilmazPThe Silva and “All-species Living Tree Project (LTP)” taxonomic frameworksNucleic Acids Res.201442D643D64810.1093/nar/gkt1209