
 ?Mathematical formulae have been encoded as MathML and are displayed in this HTML version using MathJax in order to improve their display. Uncheck the box to turn MathJax off. This feature requires Javascript. Click on a formula to zoom.
Abstract
This paper discusses two real effects of financial reporting on pay and incentives: (1) Better earnings leads to better incentives, and (2) If pay is mismeasured, pay can be misused. The first real effect follows from the fact that incentives are often based on earnings, and the effectiveness of earnings-based incentives is positively related to the quality of earnings. Greater use of earnings in incentives provides better incentives at a lower cost. The second real effect has to do with how well the accounting system measures the expense of various pay components. Complex calculations are required to value complex pay components such as options, post-employment benefits, and performance-vested equity, and these calculations have historically not been done correctly. The incorrect accounting leads to these pay components being misused. I conclude by discussing how accounting and disclosure of pay and incentives can be improved.
1. Introduction
This paper discusses two real effects of financial reporting on pay and incentives. The two real effects are based on two properties of earnings. First, how well does earnings measure CEO performance? Second, how well does earnings measure the expense of pensions, options, and other complex pay?
If earnings better measure CEO performance, then the firm can provide good incentives at a low cost. This is the real first real effect: better earnings leads to better incentives. The clearest example of this effect comes from cross-country studies of managerial ownership. When earnings quality in a country is low (for example when earnings can be manipulated to hide managerial theft), managers own more stock (e.g. La Porta et al. Citation1998, Leuz et al. Citation2003, Core et al. Citation2015). This results in more risk on the CEO, higher pay for this greater risk, and less effective incentives. As a second example, regulatory reforms and international financial reporting standards (IFRS) have improved earnings quality throughout the world. In the US, Sarbanes-Oxley and related reforms significantly reduced earnings manipulation. When earnings manipulation became more difficult, US firms responded by using more earnings-based incentives (Carter et al. Citation2009). After IFRS, there is a greater likelihood that the CEO is fired following bad earnings (Wu and Zhang Citation2009, Citation2019). These examples suggest that improved accounting leads to greater use of earnings in incentive contracts. I argue below that this greater use of earnings provides better incentives at a lower cost. This is the first real effect of financial reporting on pay and incentives: Better earnings leads to better incentives.
While the first real effect relates to the accounting system in general, the second real effect relates to how well earnings measures pay. Historically, the accounting system under-expensed options and post-employment benefits. This under-expense led to over-use and over-pay. When the accounting for pensions and other post-employment benefits improved, firms cut back these plans (e.g. Mittelstaedt et al. Citation1995). In the US, lack of an accounting value for options led some firms to use the number of options as a heuristic for option value, and this led to option over-use (e.g. Murphy Citation2013, Shue and Townsend Citation2017). Pay is too high as a result of these too large option grants. Thus, in this case, the lack of accounting had a macro effect in terms of increased US pay levels. This is the second real effect of financial reporting on pay and incentives: If pay is mismeasured, pay can be misused.
Before proceeding, I caveat that this paper reflects my views and abilities. In part because we all get paid and because we all tend to have concerns about relative pay, pay and the accounting for pay generates more opinions and more emotion than most accounting topics. Pay can be viewed through the lens of many disciplines including, for example, psychology and ethics, but because of my training, I view pay through the lens of economics. What my background means for this discussion is this: While I give examples of how managers and boards make bad decisions about pay, and in some cases systematic bad decisions, my view is that these bad decisions are eliminated over time due to learning and better information. This learning and better information come in part from improvements in financial reporting.
The next section of the paper overviews pay and incentives. Section 3 discusses the real effect that better earnings leads to better incentives. Section 4 examines factors that lead to complex and difficult-to-measure pay. Section 5 argues that if pay is mismeasured, pay can be misused. Section 6 concludes.
2. Overview of pay and incentives
2.1. Types of pay
Pay can be characterised as the sum of five components or types of pay:(1)
(1) where:
Salary: cash salary paid over the course of the year; Bonus: cash paid for annual performance; Long-term incentives: grants of restricted stock, options, and long-term performance-vested plans; Benefits: value of retirement plans, health care, etc.; Perquisites: value of country clubs, private jets, etc.
Some of these components are easy to value (cash salary and bonus, grants of stock), whereas other are difficult to value (stock options, performance-vested plans, pensions).
The bonus plan payout varies with annual performance, and the payouts of long-term plan grants vary with long-term performance. Salary, benefits and perquisites do not explicitly vary with performance, but may implicitly. A better performing person may get a larger salary increase, and this turns into more valuable benefits and perquisites.
2.2 Earnings-based bonus plans and long-term incentive plans
One purpose of accounting is to allow owners to assess managers’ performance. Earnings-based bonus plans have a long history in corporations’ pay plans in the UK, Europe, and US (Watts and Zimmerman Citation1986, p. 201). Also, if the company has no publicly traded stock, it must use an accounting-based measure. While the details of plans vary, a typical managerial bonus plan pays a target bonus amount for target performance, and then a greater bonus for performance above the target, and a smaller bonus (or no bonus) for performance that falls below the target. Consider the following typical bonus plan as an example:Footnote1
In this example, the manager receives his or her salary plus a bonus ranging from $0 million for accounting income up to $16 billion and a bonus of $2.5 million for accounting income of $24 billion and above.
Long-term incentive plans can be simple – a grant of stock that vests with the passage of time. Or they can be complex – a grant of options or a grant of stock, options, or cash that vest based on performance. Long-term performance-vested plans typically have a minimum / target / maximum structure similar to the annual bonus plan above with the exception that the payout can be in stock and options as well as cash. In the US, about 85% of plans vest at least in part based on accounting performance (Bettis et al. Citation2018). For example, consider the following performance-vested restricted stock plan:
In this example, the number of shares that vest varies with three-year earnings performance, so that the plan payout (number of shares multiplied by stock price at vesting date) is greater with earnings performance and with the price per share when the shares vest:
2.3. Pay vs. incentives
Pay is how much a person received for past performance. If 2017 earnings in the above example were $20 billion, the manager received a bonus of $1.25 million for 2017. In contrast, incentives are how much a person will receive for future performance. If the above bonus plan were in place for 2019, it gives the manager incentives to increase earnings, for greater earnings will provide a greater bonus. Incentives come when the employee’s future pay and/or wealth varies with performance.
A grant of long-term incentives is pay this year and incentives for future years. In other words, if firm A pays its CEO a fixed $1 million in cash salary while B pays its CEO a fixed $1 million in stock, pay for the two firms is the same – $1 million. However, if B’s CEO holds the stock and does not sell it, he or she has future incentives from the stock.
2.4. Holdings incentives
Because grants of restricted stock, options, and long-term performance-vested plans vest over a number of years, at a point of time, employees hold vested and unvested stock, options, and long-term performance-vested plans. If, for example, a company grants restricted stock each year with a three year vesting period, once an employee has been with the firm three years, the employee will have grants that vest in the next one, two, and three years. If the grant is performance-vested based on earnings similar to the above performance-vested restricted stock plan, the amount vested depends on earnings performance over the next one, two, and three years. In addition to holdings of unvested grants, employees often own vested stock and vested options.
These holdings of firm stock and other securities provide incentives because changes in performance change the value of these holdings. Until recently, most holdings incentives came from stock and to a lesser extent options. If the employee only owns stock, holdings incentives are easy to compute. For example, if the CEO owns 1 million shares of stock and the price is $100, a 1% change in stock price leads to a $1 million change in the stock value. Options require an adjustment for the Black–Scholes ‘delta’ (typically about 0.7 for executive options). If the example CEO also owns 1 million options and the stock price is $100 and the option delta is 0.7, a 1% change in stock price leads to a $0.7 million change in the option value.
Most difficult are incentive calculations when the employee holds stock or options that vest based on earnings performance as in the above example. In this case, the value of the holdings increases when the stock price increases and when earnings increases. Bettis et al. (Citation2018) and Core and Packard (Citation2019) value performance-vested plans based on assumptions about the probability distributions of earnings and prices. Their methods assess the probability of each possible combination of three-year earnings and price. For example, they might assess a 0.1% probability of three-year earnings being $48 billion and the price being $100, and so on. The value of the performance-vested plan is the discounted sum of each possible future value multiplied by its probability. The incentives to increase price (earnings) are calculated as the change in value for a small change in price (earnings). The reason these calculations are difficult is the difficulty of specifying a distribution for future earnings. Unlike stock returns that follow a Brownian motion, earnings are mean-reverting, exhibit persistence, and are only observed at a quarterly frequency. For these reasons, it is much more difficult to specify a distribution for future earnings than it is for future prices.
Many practitioners and academics tend to focus on incentives from pay and tend to ignore incentives from holdings, but this can lead to error. Because holdings incentives can be very large relative to pay incentives, examining pay incentives alone can be misleading. Core et al. (Citation2003) find that holding incentives are over 10 times larger than pay incentives for 75 percent of US CEOs from 1993 to 2000. They further find that the inference about the relation between noise and pay incentives can be opposite to that from the relation between noise and holdings incentives.
One would like a comprehensive measure that combines pay incentives with holdings incentives, but this is difficult. While in principle one can observe the weight on earnings in an incentive plan (as in the example above), the annual bonus is often only 20–30% of pay for a CEO, and one does not observe what motivates changes to salary, long-term incentive grants, etc. Therefore, instead of being able to observe pay incentive weights directly, one has to infer the weight from regressions of pay on performance such as Equation (7) below. To create the comprehensive measure, one would add the estimated pay incentives to the holdings incentives calculated as described above (see Core and Packard Citation2019, for an example).
3. Better earnings leads to better incentives
3.1. Incentive design
This section discusses how pay and incentives are designed in theory, and then discusses the evidence. In this section, I assume that the board designs CEO incentives to maximise firm value net of the CEO’s pay, and that the CEO in turn designs other employee incentives to maximise firm value net of their pay. For this to happen requires the following assumptions: the board is informed and independent of the CEO; and the board chooses the best performance measures and sets unbiased targets for those performance measures. I relax these assumptions in Sections 4 and 5 below.
Intuitively it seems good to provide incentives (pay for performance), but how much incentives and how? Suppose in the example above pre-bonus earnings were $24 billion, entitling the employee to the maximum bonus of $2.5 million. If the bonus plan was effective, the high earnings resulted from the employee’s work and thoughtful choices. But the high earnings could have come from the following ineffective factors: (1) measurement error in capturing true earnings; (2) systematic factors unrelated to the employee’s performance – earnings increased because of the entire economy was doing well; (3) bad target-setting – earnings for this firm are always $24 billion or above; or (4) manipulation – earnings were much lower but the employee manipulated them upward.
All fixed salary with no variable pay will not motivate the employee: In this case, the employee’s pay will be the same regardless of firm performance. On the other hand, as more incentives are imposed on the employee, more of the employee’s wealth is tied to performance, and this exposes the employee to more risk. The employee requires higher pay to accept this risk. In addition, too much variable pay can motivate an employee to take action to reduce firm risk, and this can lower firm value if the risk-averse employee is not motivated to adopt risky but value increasing projects (e.g. Amihud and Lev Citation1981). This is known as the cost–benefit trade-off between incentives and risk. Greater incentives can provide the benefit of more alignment between the employee and the firm, but this comes at the cost of higher risk imposed on the employee, which requires greater pay. Effective incentive plan design recognises this trade-off, and stops applying incentives when the risk cost of additional incentives exceeds their benefits.
3.2. Manipulation
Incentives motivate participants to increase the performance measure. If a performance measure is easy to manipulate, an employee may find it easier to get the bonus by manipulating than by increasing value. The Wells Fargo cross-selling scandal of 2016 is a sad example of this – Wells Fargo set up incentives that paid based on numbers of new accounts opened, and some employees responded by opening fake and fraudulent accounts. If the accounting system and internal controls are weak, it can be easy to affect a performance measure by manipulating it.
A number of studies use the earnings-based bonus structure above in Section 2.2 that has a minimum and maximum to test for accrual manipulation. Healy (Citation1985) predicts and finds that this structure motivates managers to increase accruals when earnings are between the minimum and maximum, and to reduce accruals when earnings are below the minimum or are above the maximum. Because low accruals this year tend to become high accruals next year, manipulating accruals downward when they have no effect on this year’s bonus tends to increase earnings next year and to increase next year’s bonus. Holthausen et al. (Citation1995) and Guidry et al. (Citation1999) find similar results in different settings.
This raises a point about the design of incentives. Manipulation is another source of noise, and if a performance measure is easy to manipulate it should receive a low weight. In contrast, improvements to accounting and internal controls make earnings more difficult to manipulate. This greater difficulty of manipulation in effect removes noise from earnings and enables earnings to provide stronger incentives. Carter et al. (Citation2009) examine bonus plans before and after Sarbanes-Oxley and related reforms in the US. Consistent with the reforms improving earnings quality, they and others find less earnings management afterwards. More important, they find that firms respond by placing more weight on earnings in bonus contracts. Because successful manipulation is more costly, plan participants focus instead on increasing firm value.Footnote2
3.3. Properties of good performance measures
Earnings quality affects the choice of incentives because higher quality earnings allows stronger earnings-based incentives and better overall incentives. One sign of a high-quality performance measure is less noise in the mapping from true performance to reported performance. Suppose that:(2)
(2) where noise has an average of zero but random variation. Noise is in part firm-specific (idiosyncratic). For example, even a very high quality accounting system has measurement error in capturing true earnings. Noise also is systematic: some firms’ earnings or stock returns may be largely determined by outside forces such as economic cycles or commodity prices. These outside forces are outside the manager’s control and are noise. Suppose two firms A and B use an earnings-based bonus. These firms are identical except that B has much more noise in its earnings. If B uses the same amount of earnings-based incentives as A, the extra noise in B’s earnings imposes more risk on B’s employees, which requires extra pay. This cost exceeds the benefits, so that B will use less earnings-based incentives.
A related property of performance measures is whether they are ‘sensitive’ or capture the full effect of the employee’s value-creating actions. If the employee takes an action that increases firm value, is this increase in value reflected in earnings? Suppose that the employee has increased firm value, but the accounting system always reports earnings of $20 billion. In this case, the above bonus plan provides no incentives – the employee always gets a bonus of $1.25 million. This measure is insensitive to the employee’s value increasing choices; another way of saying this is that the measure is poorly aligned. As another example where earnings do not fully reflect value creation, consider a firm where R&D investments (or other long-term investments) are important to firm value. Accounting earnings is more likely to capture near-term cost of these investments, but not their long-term cash flow implications. Earnings in this case is not sensitive and not well aligned. An earnings based bonus plan might motivate the manager to work on existing projects and not to invest in the long-term.
The stock return (the percent change in stock price) is thought to be more sensitive and better aligned than is earnings, but is noisier. The alignment comes from the fact that returns are what the owners care about. Their primary concern is not whether earnings increase, but whether the stock price goes up. Another alignment advantage is that the stock price contains an assessment about the long-term value implications of investments like R&D about which the accounting system can be silent. The disadvantage of stock returns is that they are noisy. Although they reflect an assessment about the long-term value implications of the employee’s choices, they also reflect systematic factors such as market returns, which are beyond the employee’s control.
Many firms base incentives on both earnings (through bonus plans and performance-vested plans) and the stock price (through stock and option holdings), and the design issue is how incentive compensation is weighted on earnings vs. on the stock price. Extending the example above, suppose that the properties of A’s and B’s stock returns are the same in terms of alignment and noise. Then because B’s earnings are noisier, B will use relatively more stock return incentives than A. But B’s re-weighting towards the stock price is costly. If B’s earnings were the same quality as A’s, its incentive weights on earnings and price would be the same as A’s. When B’s earnings quality decreases, B has to shift to less preferred incentive weights that impose more risk on its employees (at a higher cost).
In summary, theory suggests that the weight on a performance measure is higher when the measure is better aligned and less noisy, and the relative weights of two performance measures determined by their relative alignment and noise.
3.4. Relative performance evaluation and peer spillovers
Performance measure noise has a systematic component and a firm-specific component, both of which impose risk on the employee. Theory suggests relative performance evaluation (RPE) as a way of reducing systematic noise in a performance measure (Holmstrom Citation1982). This is accomplished by referencing or subtracting the average performance of a set of peer firms. For example, suppose that the noise in a performance measure consists of a single systematic risk factor f with firm loading bi and a firm-specific component ui.Footnote3 Then we can re-write Equation (2) for a given firm i as follows:(3)
(3) The difference between a firm’s performance and the average performance of peer firms j is:
(4)
(4) If the peer firms have similar b’s to firm i (are comparable), taking this difference removes systematic risk (the middle term) from firm performance.Footnote4 The trade-off is that it introduces additional noise – the average idiosyncratic noise (
) of the peer firms. This noise diversifies away if the number of peer firms is sufficiently large, but the number of peer firms is constrained by the need to have peer firms with similar b’s.
The preceding suggests three ways that improvements in reporting quality by peer firms can spill over to another firm. An improvement in reporting quality can:
Increase comparability leading to more peers having similar b’s. In this case, the firm can expand its peer group, better reduce systematic noise, and better diversify idiosyncratic noise.
Reduce idiosyncratic noise in all peers. In this case, because diversifying idiosyncratic noise is easier, the firm can reduce its peer group to those with the most comparable b’s, and better reduce systematic noise.
Reduce idiosyncratic noise in a single peer. If a single peer can improve its reporting quality to reduce idiosyncratic noise, it can achieve better incentives at the same or lower cost. These better incentives lead to superior performance, and because this peer will tend to out-perform other firms, it puts pressure on other firms to improve their reporting quality as well.
The empirical literature on RPE suffers from some misunderstandings. First, despite naïve claims to the contrary (e.g. Bebchuk and Fried Citation2004), managers’ equity holdings are implicitly indexed and do not contradict RPE.Footnote5 Thus, any test for RPE is only sensible for pay, but may not be important to the extent pay incentives are small relative to holdings incentives. Second, the literature and my discussion above tend focus on the benefits of RPE without considering the additional costs and complexity of designing and administering a pay plan with RPE.Footnote6 Finally, once RPE is added to a pay component, that component is more complex and more difficult to value.
3.5. Empirical evidence – incentives from holdings
Much academic research examines the prediction that a more sensitive and less noisy performance measure will be more highly weighted. Academic studies tend to look at holdings incentives and pay incentives separately. One set of research examines top managers’ stock holdings, and this research can be interpreted as how much incentives come from the stock price (ignoring earnings-based and price-based incentives from pay). Cross-country studies run regressions of the form:(5)
(5) where:
Ownership: the percentage of firm stock owned by insiders; Disclosure quality: a proxy for country level disclosure quality.
These studies find a negative relation between the proxy for disclosure quality and ownership concentration (e.g. La Porta et al. Citation1998, Leuz et al. Citation2003, Core et al. Citation2015). This suggests when accounting quality is worse, stock ownership is higher. In other words, when earnings is noisy or not aligned, there is greater weight on stock returns and this greater weight is costly because pay must be higher.
Within country, data also generally support the idea that lower earnings quality is negatively associated with ownership. A number of studies run regressions of the form:(6)
(6) where:
Firms with low book-to-market ratios have a large value of assets not recorded by the accounting system, and this can be considered a proxy for low accounting quality. Studies find that US firms with low book-to-market ratios have higher CEO equity incentives (e.g. Core and Guay Citation1999). Conyon et al. (Citation2011a) find the same result for a combined sample of UK CEOs and US CEOs.
3.6. Empirical evidence – incentives from pay
Another group of studies examines how the weights on performance measures in pay vary as a function of their sensitivity and noise. To do this, academics examine how pay changes with accounting and stock return performance with variants of the following regression:(7)
(7) where:
Acc Return: the firm’s accounting return (e.g. ROE or ROA); Stock Return: (ending price plus dividends)/beginning price; wA: weight on accounting returns; wS: weight on stock returns.
When earnings is more sensitive and less noisy, theory predicts it will have a higher weight in the above regression. The higher weight indicates that earnings provide more incentives.
Pay is determined by many factors in addition to performance (such as the scope of the employee’s job and the type of industry). Researchers seek to control for these factors by using last year’s pay as a proxy and computing %Change in Pay (that is, if the scope of the employee’s job is the same from year to year, the change in pay will difference these other determinants out).
Although stock returns are often not an explicit performance measure in pay, they are included in academic models of pay for the following reasons. First, although they are not explicitly tied to returns, one can imagine that salary increases (and other non-bonus pay like LT grant values) are higher when stock returns are higher. Second, in large samples, researchers cannot observe exactly what accounting measure is used, and returns can control for the variation in the exact measure. Last, bonus plans can include non-financial measures and discretionary measures, and returns can control for variation in these non-accounting measures.
Lambert and Larcker (Citation1987) and Sloan (Citation1993) examine cash pay and find that the weight on accounting earnings relative to stock returns is higher when earnings are less noisy and when returns are noisier. Smith and Watts (Citation1992) find that the book-to-market ratio is positively associated with the existence of a bonus plan and negatively associated with the existence of an option plan. This is consistent with a higher weight on earnings (through the bonus plan) and a lower weight on stock prices (through the option plan) when accounting is higher quality (book assets closer to market assets). Baber et al. (Citation1998) examine CEO cash pay and find that the incentive weight on earnings is higher when earnings are more persistent. If more persistent earnings are more sensitive and less noisy, this finding is consistent with a higher weight on earnings when earnings have relatively higher quality.
Under the hypothesis that some components of earnings (e.g. extraordinary gains and losses, restructuring charges, and other special items) are noise in terms of incentives, a number of studies examine whether compensation committees appear to back these items out of earnings and ‘shield’ managers from them. In general, studies like Dechow et al. (Citation1994) find that boards do adjust earnings for non-persistent components like restructuring charges. This shielding is consistent with an effort to remove noise from earnings.
More recent work focuses on whether and how IFRS adoption improved or worsened earnings and therefore affected incentives. Wu and Zhang (Citation2009, Citation2019) predict and find that the relation between earnings performance and the likelihood the CEO is fired is more negative following IFRS adoption. One can view a CEO firing as the most negative incentive pay outcome (i.e. the CEO will never be paid again by that firm), so the greater weight on earnings post IFRS suggests higher earnings quality.
In addition to its effects on earnings for a given firm, the common standard also improves earnings comparability across firms in different countries. Instead of each country having a different local GAAP, under IFRS all countries have a more similar common GAAP. Because the comparability of one firm to others increases (because the others are now on similar GAAP), this improves the usefulness of other firms’ earnings for RPE, as discussed above in Section 3.4. To test this idea, Ozkan et al. (Citation2012) use a modified version of Equation (7) above that includes foreign peer firms’ average accounting returns:(8)
(8) where
Peer Acc Return: an average of foreign peer firms’ accounting returns.
Ozkan et al. find that following IFRS, the average accounting return for a firm’s foreign peers is significantly more negatively associated with pay changes following IFRS, which means that when foreign peers do better, boards assess lower relative performance to the CEO and increase pay less. This result suggests that IFRS improved the usefulness of earnings for incentives by increasing comparability. Wu and Zhang (Citation2010) provide similar evidence for CEO firings: when peer performance is good, the CEO is more likely to be fired when the firm’s earnings are bad. Thus, improvements in comparability through IFRS improve incentives through greater use of RPE.
While these papers suggest IFRS improved earnings quality for incentives, a related recent paper by DeFond et al. (Citation2019) suggests that in some case IFRS can reduce earnings quality. They note that IFRS ‘resulted in an increase in the use of fair value accounting relative to the local GAAP it replaced’ (p. 1). They hypothesise that while earnings in general may be better under IFRS, firms with large fair value (FV) adjustments have lower earnings quality. To support this prediction, they use GAAP-IFRS reconciliations to classify firms on whether they have high or low FV adjustments following IFRS. They find that for high FV firms, the weight on earnings decreases after IFRS adoption. In contrast, for the firms most affected by IFRS’s non-fair-value provisions, the weight on earnings increases after IFRS adoption. Taken together, the results are consistent with IFRS’s non-fair-value provisions increasing the incentive weight on earnings, but with the fair value provisions decreasing this weight.
A caveat to this analysis (and to all the pay-based studies) is that they do not examine holdings incentives. It is conceivable that the IFRS FV adjustments increased the sensitivity and/or reduced the noise in stock prices, and firms in response increased required stock holdings, with the result that the increased weight on stock returns provided better incentives at a lower cost.
3.7. Incentives from pay and holdings
While the ideal measure would combine pay incentives with holdings incentives, perhaps because of computational difficulties described above in Section 2.4, few studies employ it. Using a combination of pay and holdings incentives, Core et al. (Citation2003) find a puzzling result for their sample. Unlike the prediction above that noise in a performance measure should decrease its weight, they find that firms with noisier stock returns have CEOs with more price-based incentives. While this is puzzling, Core and Packard (Citation2019) re-examine the result using a later sample using a combination of pay and holdings incentives. They find the puzzling result does not occur after 2006, and that it may be specific to the 1993–2000 sample. Core et al. (p. 978) note that it is possible that ‘because of a recent time-series shift in the percentage of annual pay delivered in the form of option grants, CEO contracts are not in equilibrium’ in their sample period. Work discussed below by Shue and Townsend (Citation2017) supports this explanation of over-granting stock options and links it to the lack of accounting expense for stock options. A related explanation offered by Core and Packard (Citation2019) is that once stock options no longer had favourable accounting treatment, firms were more likely to use long-term earnings-based incentives, and this higher use of earnings-based incentives resulted in a higher weight on earnings.
This concludes Section 3, and the key takeaway is that better earnings quality leads to better incentives at a lower cost.
4. Pay complexity
4.1. Sources of pay complexity
The preceding section discusses how earnings quality affects incentives. This section discusses how tax considerations, outside scrutiny, and accounting considerations lead to pay complexity. While in theory pay could be comprised of all easy to value measures (cash and stock), in practice pay includes many hard to value measures (options, other long-term incentives, benefits, and perquisites). In the real world, pay is complicated in most firms, and some pay components are complex and hard to value. Because more complex pay (like pensions and options) are more difficult for the accounting system to value, there is the potential for the accounting system to misvalue this pay leading to the potential for managers to misuse this pay. In this section and in Section 5, I no longer require the assumptions that the board is informed and independent of the CEO, and that the board chooses the best performance measures and sets unbiased targets for those performance measures.
In terms of tax explanations, cash pay is often less tax-advantaged than other forms of pay. For example, in the US health benefits are tax-deductible for firms, but are not income for employees. It is therefore efficient to pay less salary and more health care. Similar asymmetries in the tax code favour deferred compensation, and this leads to a substitution away from cash pay into deferred compensation vehicles such as pensions and options.Footnote7 IRS code 162(m) in US, which was a political measure intended to lower total pay, drove the use of options because of a loophole for ‘performance-based compensation.’ In terms of perquisites, a firm may get a tax deduction for providing a country club or jet to an executive or meals to employees; these items are not generally tax deductible for individuals, so it can seem sensible for the firm to provide them.Footnote8
Outside pressure also drives pay complexity. The press and other outside observers focus on pay incentives and ignore and/or do not understand the strong holdings incentives that come from holdings of stock and previously granted incentives. As noted above, most US CEOs have substantial incentives to increase value from their holdings of stock and previously granted incentives, and therefore any variation in pay is only a small part of their incentives. In spite of this fact, influential critics like Bebchuk and Fried (Citation2004) focus on pay and ignore holdings incentives. Similarly, the US proxy advisor ISS has a long discussion about how it scores firms based on how the CEO’s pay correlates with stock returns, but is silent on whether or how it evaluates management’s incentives from stock ownership. On top of this are the constant complaints about pay from politicians, unions, the press, etc. A recent example is the requirement by the US SEC and by the UK Companies (Miscellaneous Reporting) Regulations to disclose the ratio of CEO pay to employee pay. This disclosure is of no use to shareholders, who can already observe profit margins across firms. The requirement is motivated by, and will feed, concerns by politicians and activists about inequality.
Because it is costly to have a proxy advisor recommend ‘No’ on Say for Pay and because press and non-shareholder scrutiny can be time wasting, firms rationally make choices to limit perceived pay and to make wordy disclosures in proxy statements to create the appearance that pay varies with performance. I conjecture that because of this pressure, which is exacerbated by expanded disclosure requirements, firms spend a lot of time designing and talking about complex bonus plans that have numerous performance measures. Likewise, while good incentives can be provided by simple (and easy-to-value) plans like time-vested restricted stock, the pejorative press (‘pay for pulse’) associated with these plans drive firms to layer on one or more additional performance measures to turn a simple pay component into a complex and hard-to-value component (performance-vested restricted stock and options).
Gipper (Citation2019) provides evidence of outside scrutiny generating pay complexity. He examines the effects of the introduction of the Compensation Discussion and Analysis (CD&A) in the U.S. in early 2007. The CD&A requires significant disclosures and discussion related to executive pay determinants, such as performance measures in bonus plans and long-term incentive plans. Gipper uses a difference-in-difference analysis of pay before and after the new SEC disclosure requirements in 2007. He finds a 44% increase in the length of the proxy statement and a 40% increase in the number of performance measures. Although the reform was expected to lower pay due to increased transparency, Gipper somewhat surprisingly finds a 10% increase in total pay. He attributes this increase in pay as additional pay to compensate for the risk of additional performance measures and to less discretionary bonus pay. In short, the additional scrutiny increased pay complexity and increased pay.
In terms of accounting motivations for complexity, managers care about accounting earnings, and if two forms of pay deliver the same incentives and the same perceived value to an employee at a similar economic cost, some managers will choose the form of pay that has the lowest expense. This drives pay complexity because in general hard to value pay components are more likely to be under-expensed.Footnote9 Broadly speaking, choosing the form of pay that has the most desirable accounting properties is similar to managerial machinations to keep debt off the balance sheet (e.g. some leases under the old standard and special purpose entities). So long as managers care about the expense implications of compensation, different accounting treatments can lead to different pay components. The payoff to a stock appreciation right and option are very similar, but pre-reform options had no accounting expense, so options were more used. Core and Packard (Citation2019) note that FAS 123R offers more favourable accounting to long-term awards that vest based on accounting performance relative to long-term awards that vest based on stock price performance.Footnote10 They conjecture that this difference can lead firms to prefer accounting-based vesting awards, which are more difficult to value than awards that vest based on stock price performance.Footnote11
Consistent with the idea that prior lack of accounting for options lead to more use of options, Carter et al. (Citation2007, p. 327) conclude that ‘favorable accounting treatment for options led to a higher use of options and lower use of restricted stock than would have been the case absent accounting considerations.’ They find that once options are accounted for, US firms switch away from options to restricted stock. They find that firms’ use of options vs. restricted stock before option expensing vary cross-sectionally by the extent to which they are sensitive to the earnings effect of the grant. Carter et al. (Citation2007) term this sensitivity ‘financial reporting concerns,’ and predict and find that firms with higher financial reporting concerns grant more stock options when options are not expensed. These same firms are more likely to switch to restricted stock when options are expensed. Related to the discussion in Section 5.3 below, they do not find that this switch changes average pay.
Differences in taxes, accounting, and outside scrutiny across countries can lead to differences in pay components. Conyon et al. (Citation2011b, p. 61) use these as explanations for why there were large increases in option use in the US but not in Europe:
America’s reliance on stock options … began in the 1950s as a result of tax policies designed to promote options, and declined in the late 1960s when the government reduced the tax benefits. The early 1990s created a “perfect storm” for an escalation of option grants: (1) in May 1991, the SEC eliminated the six-month holding requirement for shares acquired by exercising options; (2) in 1993, Congress caved to shareholder pressure, exempting options from the new $1 million deductibility limit; and (3) in 1995, FASB halted its crusade for option expensing, allowing options to be granted without an accounting expense to the company. . . Eventually, FASB mandated expensing, and companies moved away from options towards restricted stock.
4.2. Complex pay makes accounting difficult
Accounting for pensions, options and other deferred compensation requires a present value calculation. In other cases the accounting system is uneven in how it recognises (or not) present values. It does a good job of valuing debt liabilities, but applies no present value to the future cash flows associated with deferred taxes. The value of deferred tax liabilities associated with depreciation differences seem overstated given they do not reflect present values.Footnote12 Historically and continuing until today, there are acute misunderstandings and disagreements among academics and practitioners about the accounting valuation of options and post-employee benefits, which value are in essence complicated present value calculations.
In terms of pensions, there still is debate even among finance academics about the correct discount rate (e.g. Brown and Pennacchi Citation2016).Footnote13 The accounting for pensions under US GAAP and IFRS requires the use of a settlement rate, which is close to the risk-free rate and is consistent with theory. US GAAP does not apply to governmental entities that have their own accounting standard setter, the Government Accounting Standards Board (GASB). Perhaps reflecting genuine confusion about the correct discount rate, the GASB allows the discount rate to be the assumed rate of return on plan assets.Footnote14, Footnote15 Using the rate of return on assets to set the discount rate on a liability seems ‘misguided,’ as discussed in Novi-Marx and Rauh (Citation2011, p. 1232):
Financial liabilities should be discounted using discount rates that are specific to the risk inherent in the liabilities. The way the liabilities are funded is irrelevant to their value.
This GASB accounting for pensions is like banking accounting that allows a bank that invests its assets in junk bonds to have less capital than a bank that invests in government bonds.
In terms of options, there is still disagreement about valuing vesting and forfeiture provisions, and there is a continued (incorrect) argument that options should be lower- valued since they are held by risk-averse and non-diversified employees (e.g. Hall and Murphy Citation2002). One can see this disagreement lingering from the fact that many US companies report non-GAAP earnings that exclude stock compensation expenses.
5. If pay is mismeasured, pay can be misused
The preceding discusses drivers of pay complexity. The accounting system historically under-valued complex pay components like options and post-retirement benefits. Because of this under-valuation, if a firm uses this pay component instead of cash (or something that is fairly valued), earnings increase. This earnings increase motivates substitution toward under-valued complex pay components. The effects of the pay substitution depend on whether the CEO and the board correctly understand the value and the incentives of the pay that is substituted.
5.1. Do markets under-estimate pay?
Early research implicitly assumes that both boards and CEOs understand fair value, so that the substitution of complex pay like options and post-retirement benefits to reduce expenses leads to no change in total pay (cash pay is reduced by $100 and complex pay is increased by $100). As discussed above, one motivation for making the substitution is to make stockholders think earnings are higher, which implicitly assumes that stockholders do not have the information to undo the manipulation. Amir (Citation1993) presents evidence that during the period before SFAS 106 quantified the other post-employment benefit (OPEB) liability (1984–1986), investors, on average underestimated the liability associated with firms’ promise to continue making payments in the future. He develops this evidence using a regression of stock prices on pay-as-you-go cash payments and an estimate of the OPEB liability. Espahbodi et al. (Citation1991) find some results consistent with this undervaluation explanation when they examine stock market reactions to nine announcements relating to the elimination of pay-as-you-go accounting for OPEBs and the requirement of liability accounting. On the date that the FASB issues the Exposure Draft on accounting for OPEBs (which was to become SFAS No. 106), they find a −3% abnormal return for their sample of 143 firms with OPEBs. This sharp negative reaction suggests that markets previously under-estimated OPEB liabilities.
5.2. Evidence on the ‘contracting cost hypothesis’
A reason for pay substitution that does not involve deceiving shareholders is the ‘contracting cost hypothesis’ of Watts and Zimmerman (Citation1986). Contracts such as debt contracts typically contain covenants that are based on reported earnings and book value. By making an income-increasing choice of pay, boards and CEOs can loosen accounting-based debt covenants and reduce the chance of covenant violation. Under the assumption that it is costly for firms to renegotiate debt covenants, managers may change pay to avoid covenant violation, especially if the covenants are binding. A related reason is the ‘political cost hypothesis’ of Watts and Zimmerman (Citation1986). A firm may seek to lower reported pay if its pay is highly scrutinised by politicians and other non-shareholders that can impose costs on the firms.
In cross-sectional tests, Espahbodi et al. (Citation1991) find that market reactions are more negative for firms with high debt ratios, which is consistent with the contracting cost hypothesis. Espahbodi et al. (Citation2002) study returns around events leading up to SFAS 123, which initially required the recognition of stock-based compensation costs, but later reversed itself and required disclosure only (while encouraging recognition). They find that the abnormal returns are most pronounced for high-tech, high-growth, and start-up firms. They claim that the results are consistent with the contracting theory. However, as noted by Dechow et al. (Citation1996), for option expense to affect a start-up (that typically has little debt), managers have to believe that the reduction in a company's earnings due to the expense would lower the price of its stock and limit its access to capital markets. This seems less consistent with the contracting cost hypothesis and more consistent with managers thinking that investors are deceived by lack of accounting for options.
More consistent with the contracting hypothesis, Mittelstaedt et al. (Citation1995) find that the almost 90 percent of health care benefit reductions are made within one year of SFAS No. 106 adoption, and that the effect of SFAS No. 106 on reducing benefits is more negative for firms with greater leverage. Likewise, there is some evidence that improved accounting for pensions led to reductions and/or terminations of these plans (Kiosse and Peasnell Citation2009).
5.3. Boards and managers under-value and over-use complex pay
While this earlier research implicitly assumes that managers understand the value of complex pay, later research explicitly examines the idea that boards and managers misunderstood the value of complex pay, which lead to them over-using it. Under the information perspective developed and tested by Shroff (Citation2017), some accounting changes cause managers to do new calculations, gather new information, and engage outside experts. Shroff (Citation2017, p. 9) uses OPEBs as an example:
To the extent firms simply used current cash outflows as a proxy for expected future cash outflows towards retirement benefits (as anecdotal evidence suggests), they would have underestimated the true cost of postretirement benefits, and compliance with SFAS 106 would have provided firms with information about this cost.
In earlier work, Mittelstaedt et al. (Citation1995, p. 555) offer a similar explanation for why once SFAS 106 quantified the costs of OPEBs, firms modified them and/or curtailed them:
A third scenario is that the necessary examination by managers of their firms’ retiree health care liabilities pursuant to adoption of SFAS No. 106 accelerated decisions to reduce retiree benefits, and as a consequence, benefit reductions clustered near the time of SFAS No. 106 adoption.
Shroff tests his hypothesis by examining firm investment decisions (capital expenditures and R&D) following standard changes. He argues that pay is an expense that managers consider when evaluating the profitability of an investment, and if a standard change increases estimated pay, it reduces the estimated profitability of investments, which lowers the amount invested. Shroff finds that the cumulative effect of the OPEB liability predicts lower investment for three years after the liability is booked. His results are consistent with over-pay due to misunderstanding. His finding suggests that although payments to future workers can be cut, current workers will not accept less pay (although they may be willing to trade more cash pay for less OPEBs), so that over-payment before the standard changed is persistent.
Related to Shroff’s information perspective is the ‘perceived cost’ argument of Murphy (Citation2002, p. 860): ‘Options are perceived as inexpensive because they can be granted without any cash outlay and without incurring an accounting charge.’ Murphy argues that failure to understand the fair value of options led to their over-use. Extending his perceived cost argument, Murphy argues that if firms did not understand the value of options, one way to ‘quantify the options they award is by the number of options granted.’ This was reinforced by the fact that
SEC disclosure rules in place between 1992 and 2006 required companies to report only the number of, rather than the value of, options granted in the ‘Summary Compensation Table’, the primary or most visible compensation table in the company’s annual proxy statement.
Murphy (2013, p. 340) predicts:
If boards focused only on the number of options granted, and the number of options granted stayed constant or varied positively with stock market performance, then the cost of the annual option grants would rise and fall in proportion to the changes in stock prices.
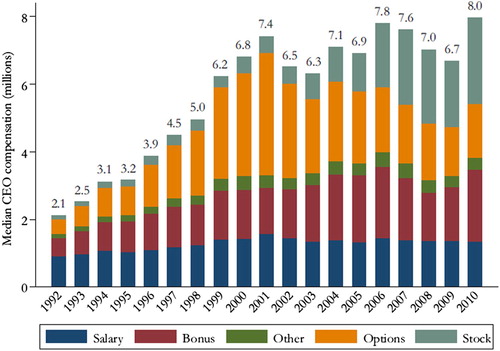
As a clever test of this hypothesis, Shue and Townsend (Citation2017) observe that while some firms used number as a proxy for option value, others did not. They use a sample of CEOs from large, presumably sophisticated US firms (S&P 500 firms) from 1992 to 2010. Their sample period spans the proxy and accounting disclosure changes in 2006. They define a ‘number rigid’ policy in which the CEO receives the same number of (split-adjusted options) two years in a row. They find sharp increases in option pay (and therefore total pay) when returns increase for ‘number rigid’ CEOs but much less for other CEOs. But because a firm’s pay levels are set by reference to average pay in its peer group, so long as one firm’s pay is high because of a ‘number rigid’ policy, over time higher pay spills over to other peer firms. Consistent with this, Shue and Townsend find that pay increases are higher for firms that have more ‘number rigid’ peers. Overall, this is an intriguing explanation for the doubling of US CEO real pay from 1992 to 2000 followed by flattening from 2001–2010, as shown in Shue and Townsend.
How costly was the overpayment? Section 3 above argues that precise weighting of earnings-based and stock price-based incentives yields the best incentives and best firm value at the lowest cost. If some heuristic results in too large option grants (and managers do not sell stock to offset the option grants), the effect is to over-weight stock price-based incentives, which results in worse incentives and higher pay due to greater incentive risk (and likely lower firm value).
One might ask why pay does not decline following mandatory option expensing in 2006. One answer is that boards at the time had no evidence that pay was too high – Shue and Townsend was not published until 2017. A second answer is that boards determine the level of CEO pay in, for example, 2007 by looking at peer pay in 2006. Not recognising a potential bubble, they do not look back in time at pay before the bubble started in, e.g. 1995. Even if boards recognised there was past overpayment, it is difficult to take over-payment back. As noted above, Carter et al. (Citation2007) find that firms are more likely to switch to restricted stock when options are expensed, but not do not find that this switch changes average pay. Finally, the higher pay for these CEOs made them wealthier, and a wealthier person requires more incentives to achieve the same level of motivation, and more dollar incentives requires higher pay (e.g. Conyon et al. Citation2011a). So the real effects of a lack of accounting for stock options appear costly in this scenario.
5.3. Opportunism
While the above assumes that both the board and CEO under-valued options, it is conceivable that some CEOs knew the fair value and opportunistically took advantage of the board to gain extra pay. Shroff (Citation2017, p. 56) argues that FAS123 required footnote disclosure of fair values starting in 1996, so some people within the firm understood the fair value of options before required expensing in 2006. This knowledge of option pricing within the firm is consistent with some CEOs knowing the fair value but opportunistically taking advantage of the board to gain extra pay.
While they do not directly test for opportunism, Shue and Townsend provide evidence consistent with it. They find that number rigidity is negatively related to the percent of independent directors on the board, the percent of directors who were on the board before the CEO was appointed, and the percent of independent directors with MBAs. The first two proxies suggest that when boards are less independent of the CEO, they adopt a grant heuristic favourable to the CEO. If an MBA is a sign of financial sophistication, the last finding suggests that the naïve heuristic is less likely for financially sophisticated boards.
Returning to pensions, the US GASB has until recently allowed the discount rate to be the assumed rate of return on plan assets. Because this discount rate understates the true pension liability, US states under-report the true economic expenses of pension obligations. Because state governments must balance their budgets, these expense understatements allow greater spending. Naughton et al. (Citation2015, p. 223) find that states with higher discount rates ‘tend to spend more on labour both in the short and long terms.’ The under-estimate of pension costs allows state governments to show that they have budget slack, which leads them to over-hire. ‘The non-discretionary portion of the funding gap understatement masks the true cost of each employee and government officials do not (or cannot) undo the understatement in their hiring decisions’ (p. 223). Here the issue of opportunism is with the standard-setter. Except for the board chair, GASB board members are not required to serve full time. At least two members are still working for state government.Footnote16 In other words, the people setting the accounting that allows government employees to spend money in excess of budget limits are themselves government employees. This lack of independence is unlike the IASB and FASB, whose board members ‘serve full time and, to foster their independence, are required to sever connections with the firms or institutions they served before joining the Board.’Footnote17
5.4. Potential unintended consequences
The foregoing discusses how changes in accounting standards such as FAS 123R can improve compensation by properly measuring the value of pay. These improvements in accounting for pay, however, can generate negative unintended consequences if managers do not understand that changes in pay can change incentives. For example, because options have a convex payout, they provide risk-taking incentives. Hayes, Lemmon, and Qiu (Citation2012) find that a post-FAS 123R reduction in the use of executive stock options reduces risk-taking incentives, and Mao and Zhang (Citation2018) suggest that these reduced risk-taking incentives reduce corporate innovation. If this reduction in risk-taking occurs, it suggests managers reduce the use of value-adding risk-taking incentives that add value just because of the accounting expense. On the other hand, Bettis et al. (Citation2018) find an increase in performance-vested plans after FAS 123R, and that the increased convexity from performance-vested plans offset the reduction in convexity from options. These conflicting findings suggest more research on whether changes in accounting standards can unintentionally weaken incentives.
6. Conclusion
This paper discusses two real effects of financial reporting on pay and incentives: (1) Better earnings leads to better incentives, and (2) If pay is mismeasured, pay can be misused.
The first real effect follows from the fact that incentives are often based on earnings, and the effectiveness of earnings-based incentive systems is negatively related to the amount of noise in earnings. Noise in earnings results from several factors, including: (1) measurement error in capturing true earnings; (2) systematic factors unrelated to the employee’s performance; (3) the accounting system may not fully reflect the value creation associated with R&D investments (and other long-term investments); and (4) manipulation. When earnings are a more noisy measure of the value created by an employee, it is more costly to use earnings as a performance measure, and firms use other measures such as stock returns. But this re-weighting towards the stock price is costly. When noise in a firm’s earnings increases, the firm has to shift to less preferred incentive weights that impose more risk on its employees. Consequently, employees bear more risk and require more pay.
The second real effect has to do with how well the accounting system measures the expense of various pay components. Complex calculations are required to value complex pay components such as options, post-employment benefits, and performance-vested equity. These calculations have historically been done incorrectly and in some cases today are still done incorrectly (such as US state government pensions). The incorrect accounting leads to these pay components being under-expensed. If managers prefer to report higher earnings, they use more of these under-expensed pay components. When boards and CEOs also under-value these components, it can result in higher total pay.
While the preceding discussion has focused on past research and past problems with the accounting for post-retirement benefits and options, I conclude by discussing how accounting and disclosure of pay and incentives may be improved. One area for improvement is the accounting and disclosure of performance-vested plans. At each point in time, these plans should have a realistic fair value, which is not what is done currently. For example, all that is disclosed about the Royal Dutch Shell CEO’s 2018 performance-vested holdings is that they can turn into between 0 shares and 1,431,182 shares (worth €0 to €37 million). Because it is important for boards and shareholders and outsiders to understand holdings-based incentives, these disclosures should be more precise. A related point is that there should be disclosure of how the value of holdings changed during the year:
Beginning value + grants + purchases – dispositions + changes in value = ending value. Clearly showing the changes in the value of holdings incentives would allow readers to combine and compare holdings incentives with pay incentives.
Although plans that vest on a single measure such as earnings can be valued with some difficulty, plans with multiple performance measures such as the Shell plan are much more difficult to value and the assumptions necessary to value them can render the valuation arbitrary. If the plan cannot be valued, then the board cannot understand the value of what it is granting. If the board does not understand the value, how can it use the plan effectively? Related, when they set targets for earnings, boards have expertise and access to a variety of internal and external information (like analyst forecasts). Where do they get the information to set targets for the variety of other performance measures used in complex, multiple-measure incentive plans and how do they know how to weight the measures? Again, if the board cannot understand the value of what it is granting, why does it use the plan? What is the value to firm shareholders in using these complex plans, given that the complexity makes pay measurement more difficult? If pay cannot be measured accurately, pay can be misused.
Acknowledgements
I thank an anonymous reviewer, Martin Conyon, Alison Dundjerovic, Wayne Guay, and Heidi Packard for helpful comments. I gratefully acknowledge the financial support of MIT Sloan.
Disclosure statement
No potential conflict of interest was reported by the author(s).
Notes
1 This hypothetical plan is similar to Royal Dutch Shell’s 2019 plan for its CEO:
2 An effective clawback that recoups bonus payments found later to be due to earnings manipulation likely has the same effect.
3 One can extend this to a multi-factor model, for example by estimating weights on the three Fama-French (Citation1992) factors. Albuquerque (Citation2009, p. 70) points out that matching along several dimensions may be infeasible: ‘Considering all such characteristics simultaneously is not practical because it could result in peer groups composed of too few firms, which would be too noisy to filter external shocks.’
4 The simple average is a simplification – in theory, one would give higher weights to peers with closer b and less volatile u (Holmstrom Citation1982).
5 A risk-averse manager prefers to hold his or her wealth in a diversified market portfolio. When the manager is required to own equity, the manager cannot invest this money as preferred in the diversified market portfolio. Because firm stock consists of firm specific risk and exposure to the market portfolio, the increase in market exposure through firm stock offsets the manager’s lost opportunity to invest directly in the market portfolio (Antle and Smith Citation1985, p. 299, Core et al. Citation2003, Core et al. Citation2005). Consistent with RPE, equity incentives therefore increase firm-specific risk with no net increase in systematic risk. In addition, the manager can adjust systematic exposure by trading market and industry portfolios (Jin Citation2002).
6 One cost of accounting-based RPE is identifying a peer group that has similar systematic risk and similar accounting properties, which is difficult because accounting earnings are only observed once a quarter. Once the peer group is set up, the RPE plan requires ongoing collection of accounting data for each peer, and requires adjusting this data for extraordinary and unusual items, accounting changes, etc. In contrast, stock return-based RPE is less costly: Stock returns are easier to compute and require less adjustment (just need beginning and ending price adjusted for any splits), and stock returns are observed daily so that one can get more precise estimates of b and u for potential peers. Likely these cost- and complexity- related reasons explain why performance-vested plans in large US firms are over twice as likely to contain stock return-based RPE than accounting based RPE (source: Incentive Lab).
7 Employee retention is also a motivation for deferred compensation.
8 While perquisites can be efficient, they can also be a means for excess pay (Yermack Citation2006, p. 212).
9 Some accounting academics use the pejorative term ‘fixation’ for this view under the efficient markets view that stockholders care about cash flows and can see through accounting choices. While a motivated shareholder likely can undo the effects of pay complexity, it requires attention and is costly. Regardless of whether shareholders see through the complexity, so long as managers think they cannot, they will be tempted to manage earnings through pay complexity.
10 Non-price performance vesting awards allow firms more discretion over expense amounts. The extra discretion arises because non-price award values are based on the firm’s own assessment of the probability of vesting as of each reporting period. In contrast, price values are based on market-determined probabilities of vesting as of grant date.
11 Awards that vest on price can be valued with existing extensions to Black-Scholes and binomial models. The inputs to these models (e.g., dividend yield and volatility) can be audited. In contrast, there are no models to value an award that vests on earnings performance. Valuing restricted stock that vests on earnings requires estimating the joint distribution of years-ahead prices and earnings, and this is inherently subjective.
12 Consequently, many finance practitioners and academics re-classify deferred tax liabilities as equities (e.g., Davis et al. Citation2000).
13 Brown and Pennacchi (Citation2016) show mathematically (using option pricing methods) that the funding requirement for pensions is the reason that the appropriate discount rate is the risk-free rate. So long as the firm is required to fund the liability, the liability becomes in essence risk-free, and a risk-free discount rate should be used. Intuition for this is that the funding requirement is like an in-substance defeasance. A bond is risky and should be valued with a risky discount rate, but if the firm defeases it by funding it with a portfolio of risk-free securities, then the appropriate discount rate is risk-free. Interestingly, this analysis suggests that SFAS 106 requirements of in essence risk-free discount for OPEB liabilities results in an over-estimate of the liability when the liability is unfunded.
14 These rules on the pension discount rate are similar to SSAP 24, which is no longer used.
15 Under new rules in effect in 2014 (GASB Statements No. 67 and No. 68), firms are allowed to discount using the rate of return on assets, unless they are severely under-funded in which case they must use a low-risk municipal bond rate.
16 Source: https://www.gasb.org/jsp/GASB/Page/GASBSectionPage&cid=1176156726930, accessed Nov. 12, 2019.
17 Source: https://www.fasb.org/facts/bd_members.shtml, accessed Nov. 12, 2019.
References
- Albuquerque, A., 2009. Peer firms in relative performance evaluation. Journal of Accounting and Economics, 48 (1), 69–89.
- Amihud, Y. and Lev, B., 1981. Risk reduction as a managerial motive for conglomerate mergers. The Bell Journal of Economics, 12, 605–617.
- Amir, E., 1993. The market valuation of accounting information: the case of postretirement benefits other than pensions. The Accounting Review, 68, 703–724.
- Antle, R., and Smith, A., 1985. Measuring executive compensation: Methods and an application. Journal of accounting Research, 296–325.
- Baber, W.R., Kang, S.H., and Kumar, K.R., 1998. Accounting earnings and executive compensation: The role of earnings persistence. Journal of Accounting and Economics, 25 (2), 169–193.
- Bebchuk, L. and Fried, J., 2004. Pay Without Performance. Cambridge, MA: Harvard University Press.
- Bettis, J.C., Bizjak, J., Coles, J.L., and Kalpathy, S., 2018. Performance-vesting provisions in executive compensation. Journal of Accounting and Economics, 66 (1), 194–221.
- Brown, J.R. and Pennacchi, G.G., 2016. Discounting pension liabilities: funding versus value. Journal of Pension Economics & Finance, 15 (3), 254–284.
- Carter, M.E., Lynch, L.J., and Tuna, I., 2007. The role of accounting in the design of CEO equity compensation. The Accounting Review, 82 (2), 327–357.
- Carter, M.E., Lynch, L.J., and Zechman, S.L., 2009. Changes in bonus contracts in the post-Sarbanes–oxley era. Review of Accounting Studies, 14 (4), 480–506.
- Conyon, M.J., Core, J.E., and Guay, W.R., 2011a. Are US CEOs paid more than UK CEOs? Inferences from risk-adjusted pay. The Review of Financial Studies, 24 (2), 402–438.
- Conyon, M.J., Fernandes, N., Ferreira, M.A., Matos, P., and Murphy, K.J., 2011b. The executive compensation controversy: a transatlantic analysis.
- Core, J. and Guay, W., 1999. The use of equity grants to manage optimal equity incentive levels. Journal of Accounting and Economics, 28 (2), 151–184.
- Core, J.E. and Packard, H., 2019. Non-price and price performance vesting provisions and executive incentives. Available at SSRN 2547590.
- Core, J.E., Guay, W.R., and Verrecchia, R.E., 2003. Price versus non-price performance measures in optimal CEO compensation contracts. The Accounting Review, 78 (4), 957–981.
- Core, J.E., Guay, W.R., and Thomas, R.S., 2005. Is US CEO compensation broken? Journal of Applied Corporate Finance, 17 (4), 97–104.
- Core, J.E., Hail, L., and Verdi, R.S., 2015. Mandatory disclosure quality, inside ownership, and cost of capital. European Accounting Review, 24 (1), 1–29.
- Davis, J.L., Fama, E.F., and French, K.R., 2000. Characteristics, covariances, and average returns: 1929 to 1997. The Journal of Finance, 55 (1), 389–406.
- Dechow, P.M., Huson, M.R., and Sloan, R.G., 1994. The effect of restructuring charges on executives’ cash compensation. Accounting Review, 69, 138–156.
- Dechow, P.M., Hutton, A.P., and Sloan, R.G., 1996. Economic consequences of accounting for stock-based compensation. Journal of Accounting Research, 34, 1–20.
- DeFond, M.L., Hu, J., Hung, M., and Li, S., 2019. The effect of fair value accounting on the performance evaluation role of earnings. Available at SSRN 3466021.
- Espahbodi, H., Strock, E., and Tehranian, H., 1991. Impact on equity prices of pronouncements related to nonpension postretirement benefits. Journal of Accounting and Economics, 14 (4), 323–346.
- Espahbodi, H., Espahbodi, P., Rezaee, Z., and Tehranian, H., 2002. Stock price reaction and value relevance of recognition versus disclosure: the case of stock-based compensation. Journal of Accounting and Economics, 33 (3), 343–373.
- Fama, E.F. and French, K.R., 1992. The cross-section of expected stock returns. The Journal of Finance, 47 (2), 427–465.
- Gipper, B., 2019. The economic effects of expanded compensation disclosure. Journal of Accounting and Economics, forthcoming.
- Guidry, F., Leone, A.J., and Rock, S., 1999. Earnings-based bonus plans and earnings management by business-unit managers. Journal of Accounting and Economics, 26 (1-3), 113–142.
- Hall, B.J., and Murphy, K.J., 2002. Stock options for undiversified executives. Journal of accounting and economics, 33 (1), 3–42.
- Hayes, R.M., Lemmon, M., and Qiu, M., 2012. Stock options and managerial incentives for risk taking: evidence from FAS 123R. Journal of Financial Economics, 105 (1), 174–190.
- Healy, P., 1985. The impact of bonus schemes on the selection of accounting principles. Journal of Accounting and Economics, 7 (1-3), 85–107.
- Holmstrom, B., 1982. Moral hazard in teams. The Bell Journal of Economics, 13, 324–340.
- Holthausen, R.W., Larcker, D.F., and Sloan, R.G., 1995. Annual bonus schemes and the manipulation of earnings. Journal of Accounting and Economics, 19 (1), 29–74.
- Jin, L., 2002. CEO compensation, diversification, and incentives. Journal of Financial Economics, 66 (1), 29–63.
- Kiosse, P.V. and Peasnell, K., 2009. Have changes in pension accounting changed pension provision? A review of the evidence. Accounting and Business Research, 39 (3), 255–267.
- Lambert, R.A., and Larcker, D.F., 1987. An analysis of the use of accounting and market measures of performance in executive compensation contracts. Journal of Accounting Research, 25, 85–125.
- La Porta, R., Lopez-de-Silanes, F., Shleifer, A., and Vishny, R.W., 1998. Law and finance. Journal of Political Economy, 106 (6), 1113–1155.
- Leuz, C., Nanda, D., and Wysocki, P.D., 2003. Earnings management and investor protection: an international comparison. Journal of Financial Economics, 69 (3), 505–527.
- Mao, C.X. and Zhang, C., 2018. Managerial risk-taking incentive and firm innovation: evidence from FAS 123R. Journal of Financial and Quantitative Analysis, 53 (2), 867–898.
- Mittelstaedt, H.F., Nichols, W.D., and Regier, P.R., 1995. SFAS no. 106 and benefit reductions in employer-sponsored retiree health care plans. Accounting Review, 70, 535–556.
- Murphy, K.J., 2002. Explaining executive compensation: Managerial power versus the perceived cost of stock options. U. Chi. l. reV., 69, 847.
- Murphy, K.J., 2013. Executive compensation: Where we are, and how we got there. In Handbook of the Economics of Finance, Vol. 2. Elsevier, pp. 211–356
- Naughton, J., Petacchi, R., and Weber, J., 2015. Public pension accounting rules and economic outcomes. Journal of Accounting and Economics, 59 (2-3), 221–241.
- Novy-Marx, R. and Rauh, J., 2011. Public pension promises: how big are they and what are they worth? The Journal of Finance, 66 (4), 1211–1249.
- Ozkan, N., Singer, Z.V.I., and You, H., 2012. Mandatory IFRS adoption and the contractual usefulness of accounting information in executive compensation. Journal of Accounting Research, 50 (4), 1077–1107.
- Shroff, N., 2017. Corporate investment and changes in GAAP. Review of Accounting Studies, 22 (1), 1–63.
- Shue, K. and Townsend, R.R., 2017. Growth through rigidity: an explanation for the rise in CEO pay. Journal of Financial Economics, 123 (1), 1–21.
- Sloan, R.G., 1993. Accounting earnings and top executive compensation. Journal of accounting and Economics, 16 (1-3), 55–100.
- Smith, C.W., Jr., and Watts, R.L., 1992. The investment opportunity set and corporate financing, dividend, and compensation policies. Journal of Financial Economics, 32 (3), 263–292.
- Watts, R.L., and Zimmerman, J.L., 1986. Positive Accounting Theory. Englewood Cliffs, NJ: Prentice Hall.
- Wu, J.S. and Zhang, I.X., 2009. The voluntary adoption of internationally recognized accounting standards and firm internal performance evaluation. The Accounting Review, 84 (4), 1281–1309.
- Wu, J.S. and Zhang, I., 2010. Accounting integration and comparability: Evidence from relative performance evaluation around IFRS adoption.
- Wu, J.S. and Zhang, I.X., 2019. Mandatory IFRS adoption and the role of accounting earnings in CEO turnover. Contemporary Accounting Research, 36 (1), 168–197.
- Yermack, D., 2006. Flights of fancy: corporate jets, CEO perquisites, and inferior shareholder returns. Journal of Financial Economics, 80 (1), 211–242.