
 ?Mathematical formulae have been encoded as MathML and are displayed in this HTML version using MathJax in order to improve their display. Uncheck the box to turn MathJax off. This feature requires Javascript. Click on a formula to zoom.
Abstract
This study examines GAAP effective tax rate (ETR) visibility as a distinct disclosure choice in firms’ financial statements. By applying a game-theory disclosure model for the voluntary disclosure strategies of firms, in a tax setting, we argue that firms face a trade-off in their ETR disclosure decisions. On the one hand, firms have an incentive to enhance their ETR disclosure when the ratio offers shareholders ‘favourable conditions’, for example, higher expected after-tax cash flows. On the other hand, the disclosure of a favourable low ETR could attract the attention of tax auditors and the public and ultimately result in disclosure costs. We empirically test disclosure behaviour by examining the relation between disclosure visibility and different ETR conditions that reflect different stakeholder-specific costs and benefits. While we find that unfavourable ETR conditions are not highlighted, we observe higher disclosure visibility for favourable ETRs (smooth, close to the industry average, and decreasing ETRs). Additional analyses reveal that this high visibility is characteristic of firm years with only moderately decreasing ETRs at usual ETR levels, while extreme ETRs are not highlighted. Interestingly and in contrast to our main results, a subsample of family firms does not seem to highlight favourable ETRs.
1. Introduction
This study examines the visibility of the GAAP effective tax rate (ETR) in firms’ financial statements, specifically in voluntary disclosures in firms’ annual reports. The intense media coverage of firms’ tax avoidance strategies has imposed tax-related reputational risks on firms and raised both firms’ and tax authorities’ sensitivity towards the provided tax information. The conduct of global firms, such as Starbucks and Google, in this area has triggered public resentment towards firms that avoid taxes and exhibit low or zero ETR, even going so far as to result in ‘tax shaming’ (Barford and Holt Citation2013). As a consequence, depending on the ETR condition, the disclosure of tax information in annual reports has become a strategic decision for firms. The anecdotal evidence from five semi-structured interviews conducted with Global Heads of Taxes of major German multinationals supports this observation:Footnote1
“There is close coordination with the Investor Relations department as part of the regular exchange with the other parts of the finance function. This also includes the tax department reporting the outcome of the ETR and explaining deviations from the previous year to the finance function. Especially, it explains any special effects to the Investor Relations department.”
Global Head of Taxes of a major German listed corporation
Despite the increased attention to corporate tax information, corporate tax disclosure habits remain under-researched. Little is known about how firms communicate their tax information. Some studies indicate that firms fail to comply with tax disclosure requirements (Gleason and Mills Citation2002) or strategically avoid disclosing unpleasant tax information (Hope, Ma, and Thomas Citation2013, Dyreng, Hoopes, and Wilde Citation2016, Akamah, Hope, and Thomas Citation2018). By contrast, to mitigate potential negative stakeholder reactions to uncertainty due to insufficient or unclear tax information, firms seem to report the respective items voluntarily (Bedard, Falsetta, Krishnamoorthy, and Omer Citation2010, Flagmeier and Müller Citation2017, Balakrishnan, Blouin, and Guay Citation2019, Chen, Chi, and Shevlin Citation2019). Bruehne and Schanz (Citation2018) provide interview-based insights into firms’ tax disclosures, indicating that firms engage in addressee-specific external tax communication to reduce tax risk in the form of external pressure. Thus, when anticipating different stakeholder responses, firms face a trade-off in their tax disclosure decisions. Inger, Meckfessel, Zhou, and Fan (Citation2018) examine this trade-off and provide evidence that consistent with the view that footnotes sometimes explain and sometimes conceal tax avoidance, the association between tax avoidance and the readability of the tax footnote depends on the level of tax avoidance. In a concurrent study, Chychyla, Falsetta, and Ramnath (Citation2017) provide evidence on the relation between the presentation format of the tax reconciliation in tax footnotes and the ETR level. Their findings indicate that depending on the ETR level, a strategic choice is made of the presentation format either as a percentage or in dollar amounts. However, these tax disclosures require a comprehensive understanding of the underlying mechanisms and a fair amount of processing time. The most basic and well-recognized measure of tax behaviour, the ETR itself, has received in the literature little attention as a tax disclosure signal.
We contribute to this emerging literature and extend Inger et al. (Citation2018) and Chychyla et al. (Citation2017) by providing a more nuanced analysis of different ETR conditions and disclosure choices, addressing in particular stakeholder specific trade-offs. Therefore, we build on Wagenhofer’s (Citation1990) game-theory disclosure model for voluntary disclosure strategies and exploit the mechanism for examining the trade-off that we expect to shape ETR disclosures. We account for stakeholder heterogeneity. On the one hand, to fuel positive capital market reactions, firms wish to disclose favourable information (i.e. a favourable ETR to investors) as visibly as possible. As tax payments represent substantial costs for a firm, certain ETRs, such as a decreasing or a low ETR, are favourable (i.e. compared to the statutory tax rate) (e.g. Lev and Thiagarajan Citation1993, Swenson Citation1999, Frischmann, Shevlin, and Wilson Citation2008, Desai and Dharmapala Citation2009, Koester Citation2011).Footnote2 The capital market orientation serves those stakeholders that are mainly interested in high after-tax cash flow. For simplicity, we denote this group of stakeholders in the following as ‘shareholders’. Any signal of low(er) tax expenses is perceived as favourable by these stakeholders.
On the other hand, the same information (e.g. the disclosure of a low or a decreasing ETR) can cause adverse actions from other stakeholders. The response of politicians, public organisations, NGOs, media, the wider public, or a group of investors that is particularly devoted to good corporate citizenship reflected in a sufficiently high ETR can give rise to costs for the firm. Disclosing low ETRs also attracts the attention of tax auditors (Bozanic, Hoopes, Thornock, and Williams Citation2017), which can ultimately result in additional tax payments after more stringent tax audits (Hanlon, Maydew, and Saavedra Citation2017, Dyreng, Hanlon, and Maydew Citation2019) or trigger reputational costs as a result of public scrutiny. While one group of stakeholders (‘shareholders’) may primarily target after-tax cash flows and thus appreciate low ETRs, another group (‘other stakeholders’) could be especially sensitive to the societal role of the firm, which makes them more inclined to side with the tax authorities and express concern about too low tax rates. For ease of readability, even though both groups capture both shareholders and external stakeholders, we use simple labels. We label the first group as ‘shareholders’ (appreciating low(er) ETRs) and the second one ‘other stakeholders’ (being critical about low(er) ETRs). When exposed to conflicting interests of these two groups, we expect the firms’ ETR condition to influence their decision on how to disclose this fundamental tax information.
Under the International Financial Reporting Standards (IFRS)Footnote3, there is no requirement to disclose the ETR itself, but the two components of the ETR, total tax expense and pre-tax income, must be disclosed, and the relation between the two has to be explained (IAS 12.81 (c)). Hence, an interested financial statement reader is always able to search and find or calculate the ETR from mandatory financial statement disclosures. By contrast, a (less knowledgeable or inattentive) reader who is not explicitly looking for ETR information may not notice the ETR if it is disclosed in a non-prominent section of the financial statements, e.g. in the tax footnotes. In a similar vein, the interview responses in Bruehne and Schanz (Citation2018, p. 27) suggest that ‘the information that is shared with the public has to be selected carefully, due to the low literacy of the general public and the polarizing effect of tax topics’. Against this background, it is likely that firms strategically manage ETR visibility. As prior studies document that over the past decade, annual reports have increased in length (Li Citation2008), creating a disclosure overload that practitioners argue makes it difficult to process the flood of information (Radin Citation2007), visibility can be increased by disclosing the information early in the annual report. Hence, we measure disclosure visibility by using two different variables hand-collected from the firms’ annual reports: first, whether the ETR is mentioned in a management report and second, the number of the page on which the ETR is first mentioned. Both measures indicate how much attention a firm wants to draw to the ETR.
To provide insights into the disclosure trade-off, we test three categories of ETR conditions for which we expect different stakeholder-specific implications. Categories 1 and 2 comprise ETR conditions that are favourable for those stakeholders that are mainly interested in high after-tax cash flows (shareholders). Category 1 generally raises no concerns of the other stakeholders and can be proxied by the conditions ‘smooth ETRs’ (McGuire, Neumann, and Omer Citation2013, Demeré, Li, Lisowsky, and Snyder Citation2019) and ‘ETRs close to the industry average’ (Bird, Edwards, and Ruchti Citation2018, Inger et al. Citation2018, Armstrong, Glaeser, and Kepler Citation2019). Shareholders as well as other stakeholders generally prefer predictable ETRs and ETRs in a ‘reasonable’ range. Our anecdotal evidence further supports the preference for smooth ETRs.
“The target rate is 25%. It is also important to us that the ETR does not fluctuate.”
Global Head of Taxes of a major German listed corporation
Hence, the benefits of such non-surprising and persistent ETRs are expected to outweigh the potential costs of signalling a tax planning strategy that dismisses further tax-saving opportunities aimed at generating low ETRs. We therefore expect firms to highlight the ETR if it is smooth or close to the peer benchmark. Category 2 includes ETR conditions that are favourable from a shareholder-oriented perspective at first glance but may elicit adverse actions from other stakeholders (public scrutiny, tax auditors). Our proxy for Category 2 is a ‘decreasing ETR’.Footnote4 A decreasing ETR results in higher after-tax income, the preferred outcome from a pure shareholder perspective (Graham, Hanlon, and Shevlin Citation2011). At the same time, a decreasing ETR raises concerns about good corporate citizenship, which can be costly for the firm. We focus on decreasing ETRs rather than ETR levels, because a change also sends out a new signal to all groups of stakeholders. In an additional analysis, we examine whether the previous ETR level or the magnitude of the decrease matters. A decreasing ETR is our main category as it best reflects the conflicting interests of different stakeholder groups and thus fully reflects the tension involved in disclosure choice. Last, in Category 3, we examine the ETR conditions that are unfavourable for shareholders and potentially also for other stakeholders. From a shareholder perspective, these conditions imply a temporary undesirable high ETR (low after-tax cash flows), and for other stakeholders, they do not provide clear signals regarding their implications for societal, reputational or other long-term goals. This category includes conditions such as ‘very volatile ETRs’ and ‘ETRs well above the industry average’. These conditions presumably involve considerable costs for shareholders and no benefits for other stakeholders. Hence, we expect a decrease in disclosure visibility under Category 3 ETR conditions.
We examine a sample of German DAX30 and MDAX firms from 2005 to 2018. Analysing the largest German firms with respect to market capitalisation and order book volumes ensures that our sample firms attract much public interest and can therefore rationally expect disclosure costs from the reactions of other stakeholders. Despite these large firms being constantly under intense scrutiny from tax authorities, the anecdotal evidence from interviews with tax managers suggests that tax auditor scepticism may increase with decreasing ETRs.
“Reputation is definitely seen as a topic. For us, it is important not to plan aggressively, otherwise you will quickly be in the focus of NGOs. This also influences CSR reporting and the climate of a tax audit.”
Global Head of Taxes of a major German listed corporation
In our multivariate tests, we find a positive and highly significant association between disclosure visibility and favourable ETR conditions (Category 1). The probability of ETR disclosure in the management report increases and the ETR is on average disclosed earlier in the report if the ETR is smooth or close to the average industry ETR. This finding is most intuitive and corroborates our assumption that the ETR is highlighted provided the condition is beneficial for shareholders and does not elicit costly reactions from other stakeholders. The results for decreasing ETRs shed light on the trade-off that firms face in the disclosure decision (Category 2). We find significantly higher disclosure visibility in the case of decreasing ETRs, indicating that shareholder benefits outweigh costs and that firms give greater visibility to decreasing ETRs. Consistent with this notion, the results for Category 3 reflect the opposite: volatile ETRs are on average less likely to be mentioned in the management report and are disclosed on a later page. We do not find significant results for ETRs that are well above the industry benchmark. While the peer ETR is an important benchmark, firms seem not to reduce disclosure visibility when their ETR (substantially) exceeds this benchmark. The results for Category 3 suggest that for volatile ETRs, the disclosure costs outweigh the benefits.
In additional cross-sectional tests, we analyse different ETR levels and degrees of ETR decrease and provide further insights into firms’ disclosure decisions. Interestingly, our results suggest that the observed disclosure behaviour seems to be partly reversed for German listed family firms, i.e. for firms controlled by a family. In other words, instead of increasing disclosure visibility in the case of favourable ETRs, family firms disclose the ETR on a later page when it is favourable from a shareholder perspective. We find evidence for these later disclosures for smooth ETR and for ETR decreases which in family firms are on average much smaller than in non-family firms. By contrast, we find disclosures on an earlier page when the ETR is volatile. This is in line with the prior literature on family firms’ specific weight on socio-emotional goals and a trusting relationship on the one hand side and loss aversion and special concerns regarding the loss of reputation (e.g. Chen, Chen, and Cheng Citation2008, Stockmans, Lybaert, and Voordeckers Citation2010, Gomez-Mejía, Cruz, and Imperatore Citation2014) on the other hand side. This rationale is also supported by our anecdotal evidence, suggesting that family firms are subject to different cost-benefit trade-offs and pay special attention to the ETR when it clearly deviates from the norm and requires additional explanation.
“Our tax planning is designed so that we cannot come into focus. … We explain tax issues that we expect could be misinterpreted by the broader public.”
Global Head of Taxes of a major German family corporation
In additional analyses of our main category of decreasing ETRs, we examine declines in different ETR levels and different magnitudes and find that only moderate decreases (between zero and five ETR percentage points) and decreases from conventional levels (an ETR level between 25 and 50 per cent) are highlighted. For very large declines (more than 20 ETR percentage points), the relation with disclosure visibility is even reversed.
Our study contributes to three streams of literature. First, we contribute to the literature on voluntary tax disclosure and its determinants. We focus on ETR disclosures as a measure to convey tax information condensed in a single ratio that is not distracted by information complexity (Plumlee Citation2003, Bratten, Gleason, Larocque, and Mills Citation2017). Consistently, our results suggest that the visibility of ETR disclosure in annual reports varies with the condition of the ETR. Our study corroborates the findings of Inger et al. (Citation2018), who examine the association of tax footnote readability and tax avoidance, and those of Chychyla et al. (Citation2017), who analyse the presentation format of the tax rate reconciliation as a strategic disclosure choice. We extend this literature in several ways: for disclosure behaviour, we document the relevance of several ETR conditions, particularly decreasing, smooth, close to industry average, and volatile ETRs. Accounting for different stakeholder incentives in firms’ disclosure choice, we link our research to Wagenhofer (Citation1990) and Armstrong, Blouin, and Jagolinzer (Citation2015). Moreover, our findings indicate a reverse relation for family firms, providing evidence of cross-sectional differences in disclosure behaviour. Specifically, we shed light on the impact of firm characteristics and multi-faceted stakeholder groups. Furthermore, our additional tests suggest that for the disclosure behaviour, not only the level of the ETR matters but also the degree of the ETR change. This is consistent with shareholders preferring non-aggressive or even socially responsible forms of tax avoidance (Hanlon and Slemrod Citation2009, Inger and Stekelberg Citation2020), and firms consider these preferences in their disclosure choices. Given that firms step up their disclosure despite the intense media interest in tax-avoiding firms and the possible resulting public pressure, our results can be interpreted as finding that firms expect considerable shareholder benefits from promoting certain ETRs, for example, decreasing yet conventional ETRs. In providing insights into firms’ disclosure incentives, we help explain variations observed in cross-company tax disclosure behaviour (e.g. Kvaal and Nobes Citation2013).
Second, we contribute to the literature on the importance that firms assign to tax-related information. Graham, Hanlon, Shelvin, and Shroff (Citation2014) show that managers care about the ETR and that it is widely used as input when deciding on new corporate investments (Graham, Hanlon, Shevlin, and Shroff Citation2017). Our results indicate that the importance of the ETR as a key performance indicator is also reflected in financial statement disclosure behaviour. Our finding that the ETR is disclosed in the management report (i.e. the section in which firms are expected to discuss the most relevant information) in 78 per cent of our observations highlights the importance that firms assign to the ETR.
Third, our research adds a tax perspective and tax evidence to the broader accounting literature on voluntary (risk) disclosures (for an overview, see Dye Citation2001, Beyer, Cohen, Lys, and Walther Citation2010 and Bischof and Daske Citation2013). Our findings corroborate interview-based evidence in Bruehne and Schanz (Citation2018) on reducing reputational tax risks via strategic tax disclosure. To sum up, our findings outline how firms assess the cost–benefit trade-off of ETR visibility in the context of diverging stakeholder preferences.
2. Hypothesis development
The analytical research on voluntary disclosure in the accounting literature suggests that favourable information is disclosed, while unfavourable information is withheld (Verrecchia Citation2001). Other streams of literature indicate that incentives such as litigation risks can motivate managers to release negative news (e.g. Skinner Citation1994, Kasznik and Lev Citation1995) and that incentives such as costs can cause managers to withhold good news (Wagenhofer Citation1990). Specifically, Wagenhofer (Citation1990) describes a setting in which a firm has private information from the firm’s information system. The information is exogenous. When this information is favourable and the firm decides to disclose it, the capital market reacts positively. We interpret ETRs as one such piece of information and reinterpret the modelled disclosure decision as a decision to highlight. We assume exogeneity of the ETR based on anecdotal evidence collected from practitioners (see Appendix A for details) that uniformly points to the ETR disclosure decision following the ETR condition in a sequential process. Hence, while the ETR is not exogenous on the firm-level, it is exogenous within the firm for the department (typically Investor Relations) responsible for the disclosure behaviour. In the model, disclosing favourable information leads to adverse actions from an opponent (here, e.g. the tax auditor, the tax legislator, or the media). For instance, disclosures of low ETRs are generally perceived as favourable by shareholders. The opponent’s adverse action results in costs for the firm, e.g. harsher tax audits, negative tax audit climate, increased regulation, or negative publicity, all of which affect the assessment of shareholders (Kubick, Lynch, Mayberry, and Omer Citation2016, Bozanic et al. Citation2017). If the condition of the ETR is generally perceived as unfavourable, it could elicit negative capital market reactions. Wagenhofer (Citation1990) identifies different equilibrium strategies. In particular, he identifies partial-disclosure equilibria in which neither very favourable nor very unfavourable information is disclosed, deterring the opponent from taking adverse action. Hence, when costs are sufficiently high, a firm may decide to forgo potential capital market benefits and to not disclose or highlight the favourable information.
To provide insights on the cost–benefit trade-off that firms face when making the disclosure decision, we introduce three categories of ETR conditions for which we expect different stakeholder-specific implications. provides an overview of the categories.
First, we consider ‘shareholders’ that primarily target after-tax cash flows and thus appreciate low (decreasing) ETRs (e.g. many shareholders, creditors). Any signal of low(er) tax expenses is perceived as favourable by these stakeholders. Second and opposed to that, we acknowledge that some shareholders and many external stakeholders (‘other stakeholders’) who primarily care about the societal role of the firm might put more weight on whether firms pay their fair share of taxes and the respective reputational considerations. These other stakeholders might be critical about low (decreasing) ETRs and see them potentially in conflict with good corporate citizenship.
According to Wagenhofer’s model, the threshold between the decision to disclose vs. not to disclose – translated to our research question, namely, the decision to highlight vs. not to highlight – is framed by the expected market response and costs. Whether the information on the ETR is highlighted and if so, how is the outcome of the sequential equilibrium in the underlying disclosure game. Hence, firms balance the benefits and costs of disclosing the ETR in a highly visible manner. Absent costs, there is no reason why firms should not highlight conditions that are favourable for shareholders. In Category 1, we identify two conditions that we assume to be favourable for shareholders but that would not elicit adverse actions from other stakeholders: smooth ETRs and ETRs close to the average industry ETR. A recent stream of literature indicates that sustainable tax strategies, i.e. smooth ETRs, provide useful information about future tax payments and earnings persistence (McGuire et al. Citation2013, Demeré et al. Citation2019). Further, shareholders tend to compare the ETRs of different firms, and firms adjust their tax behaviour to changes in the tax avoidance of peer firms in the same industry (Kubick et al., Citation2016, Bird et al., Citation2018, Armstrong et al., Citation2019). Thus, both a smooth (i.e. low volatility) ETR and an ETR close to the industry average could convey a positive signal to shareholders. Both ETR conditions signal reduced uncertainty about future tax payments and low risks of negative tax audits, as the firm does not seem to take extreme tax positions. Moreover, they may also facilitate more reliable after-tax cash flow forecasts via cross-industry comparisons. At the same time, they do not raise concerns about aggressive tax avoidance or other socially irresponsible behaviour. This is further supported by our anecdotal evidence.
“A stable ETR as a perspective is important to us.”
Global Head of Taxes of a major German listed corporation
Nevertheless, there may still be direct opportunity costs from highlighting particular information in an annual report, and these costs could thus diminish the incentive to increase the ETR visibility. Given the readers’ limited attention span and the increasing length of annual reports, the various pieces of information need to be prioritised in the sense that managers need to decide what to present in the more prominent sections (e.g. the first pages or the management report). Although an ETR may have a favourable condition, the expected benefits of increasing the visibility of this information may not be sufficient to push other information further back. The recent trend in corporate reporting to shorten annual reports (e.g. Siemens AG) support this argument.
We hypothesise that the disclosure benefits of these conditions outweigh their costs and that firms increase ETR visibility to highlight smooth or close-to-average industry ETRs.
H1a. ETR visibility is positively associated with smooth ETRs.
H1b. ETR visibility is positively associated with ETRs close to the industry average.
With H1a and H1b, we intend to corroborate our basic assumption that the ETR is a relevant ratio that firms actively communicate. The next step is to introduce tension into the disclosure decision (Category 2). Therefore, we choose an ETR condition that is favourable for shareholders and unfavourable from the perspective of other stakeholders (e.g. tax authorities, public). We posit that a decrease in the ETR represents an important condition that can be directly linked to the theoretical model developed by Wagenhofer (Citation1990). As shareholders are primarily interested in a firm’s current and future after-tax cash flows, they generally react positively when firms reduce tax payments (e.g. Desai and Dharmapala Citation2009, Koester Citation2011). With respect to the ETR, a lower ETR is usually interpreted as a small tax burden for a firm (Graham et al. Citation2011). Therefore, we expect decreasing ETRs to send a favourable signal to shareholders. However, decreasing ETRs may trigger the attention of the tax authorities as well as increased public scrutiny (Dyreng et al. Citation2016, Kubick et al. Citation2016, Bozanic et al. Citation2017). Even firms that are subject to continuous tax audits may still not want to highlight tax aggressive behaviour because this can negatively affect the tax audit climate (see Appendix A for details from the interviews). Category 2 reflects the disclosure decision tension due to the opposing interests of shareholders and other stakeholders. Thus, we hypothesise the following.
H2. ETR visibility is associated with decreasing ETR.
In Category 3, we examine ETR conditions that are unfavourable for shareholders and potentially also for other stakeholders. These hypotheses focus on the inverse conditions of our previous analyses to supplement the evidence. We identify two unfavourable conditions: volatile ETRs and ETRs well above the industry average. However, they do not reflect exact opposites of our Category 1 variables but capture slightly different dimensions. While our variable for smooth ETRs (the ETRs’ distance to the industry average) captures all possible ranges of the measure, we focus on a very pronounced variation (distance) in this category.Footnote5 A very volatile ETR or an ETR well above the ETR of an important benchmark group is likely to catch attention and create negative reactions. If there is only slightly more volatility or distance, this might not have the same effect. Jacob and Schütt (Citation2020) find that the earnings of firms with poor tax planning or volatile ETRs are discounted by capital market participants. Very volatile ETRs could indicate the absence of efficient tax planning and may suggest the occurrence of high tax payments that are moreover difficult to predict, a negative signal to which a firm does not want to draw attention (Demeré et al. Citation2019). Similarly, an ETR that is well above the industry average may indicate inefficient tax management and result in negative shareholder reactions. We expect that firms tend to disclose an unfavourable ETR fairly late in the report so that it does not attract a lot of attention and hence causes no adverse actions.
H3a. ETR visibility is negatively associated with volatile ETRs.
H3b. ETR visibility is negatively associated with ETRs well above the industry average.
3. Empirical strategy
3.1. ETR visibility
IAS 12 defines the GAAP effective tax rate (ETR) as total income tax expenses divided by pre-tax accounting income. While other ETRs, for example, the Cash ETR or the Current ETR, are applied to address a variety of research questions (e.g. Dyreng, Hanlon, and Maydew Citation2008; Dyreng and Lindsey Citation2009), the GAAP ETR is most appropriate for our research question. The GAAP ETR is strongly monitored by top executives, serves as a benchmark for cross-company tax comparisons, is a performance measure of tax departments, is used in executive compensation contracts, and is employed to evaluate important corporate decisions (Robinson, Sikes, and Weaver Citation2010, Armstrong, Blouin, and Larcker Citation2012, Graham et al. Citation2014, Graham et al. Citation2017). Based on this literature, we argue that the disclosure visibility of the GAAP ETR is the most suitable measure for capturing firms’ tax disclosure behaviour.
Our disclosure proxy should capture whether firms wish to draw attention to the ETR. Given that despite an increasing use of alternative disclosure media (e.g. Atwood and Reynolds Citation2008, De Franco, Wong, and Zhou Citation2011), the annual report is still one of the most important communication channels, we analyse firms’ disclosure in annual reports. Our first indicator of visibility reflects whether the ETR is mentioned in the management report. While management reports are not required under IFRS, German companies are required to submit a management report under German GAAP (§ 264 I HGB, § 290 I HGB) even if they prepare their statements in accordance with IFRS (similar to the Management’s Discussion & Analysis (MD&A) section included in US firms’ 10-K files). The report should only include the most important financial and non-financial business indicators (§ 289 I, III HGB). In line with this notion, Li (Citation2019) finds that disclosures in the MD&A section are informative for shareholders even when the information is repeated in other parts of the annual report. Based on survey evidence in Lee and Tweedie (Citation1975), 51.5 per cent of shareholders read the chairman’s statement thoroughly, while 34.2 per cent do not read the notes at all (Lee and Tweedie Citation1975, p. 281).Footnote6 In particular, nonprofessional shareholders seem to rely more on management discussion than on financial statements (Hodge and Pronk Citation2006). Hence, a reference to the ETR in this section indicates that the corresponding firm considers the ETR to be highly relevant information that should be communicated to the financial statement reader. We collect data on whether the ETR appears in firms’ management reports. Using a German sample and financial statements written in German, we search for the following German terms: ‘Effektivsteuer’, ‘Steuerquote’, and ‘Konzernsteuer’.Footnote7 We check not only the mention of these expressions in the management report but also, to verify that the terms indeed refer to the ETR and not to something else, for example, to the average corporate statutory tax rateFootnote8, the context in which they are used. We create an indicator variable, M_REPORT, that takes a value of one when the ETR is mentioned in the management report and takes a value of zero otherwise.
The second proxy measures the first page on which the ETR appears in an annual report. Due to the limited attention span of financial statement users and the increasing length of annual reports (Li Citation2008), firms place the most important information at the beginning of their reports.Footnote9 We therefore expect firms that wish to draw the attention to the ETR to mention it early on in their annual reports. Analogously to our first proxy, we search for equivalent German terms for the ETR in the annual reports and record the number of the page on which the ETR is first mentioned.Footnote10 We control for the length of each annual report by scaling our variable by the total number of report pages (similar to other studies, e.g. Li, Lundholm, and Minnis Citation2013).Footnote11 For ease of interpretation, we multiply our variable by minus one. A higher value for the second disclosure measure PAGE indicates that the ETR is mentioned on an earlier page, indicating greater visibility. For 71 observations of our final sample (ten per cent), PAGE is missing because the ETR is not mentioned in the respective annual report. IAS 12.81c alternatively allows to either disclose the ETR or the absolute numbers, i.e. the reconciliation of expected tax payments based on accounting income and tax expenses. In our sample, the firms that do not mention the ETR make use of this option and report only absolute numbers for tax reconciliation. To preserve the sample size, we replace missing values for PAGE with a negative 1. This is the minimum possible value for PAGE, indicating that the ETR is mentioned on the final page of the annual report. We posit that a failure to mention the ETR is equivalent to mentioning it on the final page, indicating that the firm has no intention to highlight the ETR at all.Footnote12
3.2. ETR conditions
We identify two conditions that fit our Category 1 (ETR favourable from the perspective of our group shareholders and potentially other stakeholders): a smooth ETR and an ETR close to the average ETR industry benchmark. The first variable SMOOTH builds on measures of tax strategy sustainability in prior research (e.g. Guenther, Matsunaga, and Williams Citation2017, McGuire et al. Citation2013, Neuman, Omer, and Shelly Citation2013). It captures the firm-specific ETR standard deviation for a period of up to five years, namely, the current year plus the four previous years (e.g. Guenther et al. Citation2017).Footnote13 The standard deviation is scaled by the absolute value of the mean ETR over the five-year period, resulting in the coefficient of variation (e.g. McGuire et al. Citation2013):
(1)
(1)
where i identifies the firm, t the year from one to five, and N is five. The coefficient of variation is a unitless measure of ETR volatility. We multiply it by negative one to have the same direction for all ETR condition variables: a higher SMOOTH value denotes less ETR volatility and is more favourable. We expect to find a positive relation between SMOOTH and the disclosure variables M_REPORT and PAGE.
The other ETR condition in Category 1 is an ETR close to the industry average. BENCHM measures the absolute deviation of the firm-level ETR from the lagged average industry ETR within our sample. Industry is defined by the one-digit SIC level.Footnote14 After again multiplying BENCHM by a negative one, a higher value denotes less distance to the benchmark ETR. We expect to find a positive association with M_REPORT and PAGE.
Category 2 addresses ETR conditions that are favourable from a shareholder perspective but potentially associated with disclosure costs due to the reactions of other stakeholders. Our measure in Category 2 comprises decreasing ETRs, which we capture with two variables: DECR1 and DECR2. DECR1 is an indicator variable equal to one when the firm’s current year’s ETR is lower than the previous year’s ETR and is equal to zero otherwise. Extending the period, the indicator variable DECR2 is valued at one when the ETR decreased in the current and previous year and equals zero otherwise.Footnote15 Testing H2, we do not make predictions about the association between DECR1 and DECR2 and the disclosure visibility variables M_REPORT and PAGE.
In ETR Category 3, we examine conditions that are unfavourable from a shareholder perspective. We use the following two measures: VOLETR and ABOVE_BENCHM. To create VOLETR, we take the rolling five-year ETR standard deviation (from the calculation of SMOOTH) over all firms in one year and cut it into deciles. VOLETR is an indicator variable equal to one if the firm’s ETR lies within the two highest of these deciles and equals zero otherwise. Hence, a value of one indicates a very volatile ETR. As we are not aware of such thing as a generally accepted range of volatility, we focus on the upper end of volatility to identify ranges that catch attention and are likely to yield negative reactions. This measure is different from simply reversing SMOOTH because we compare the extreme cases with the remaining eight deciles. While prior literature and anecdotal evidence suggest that generally low ETR variation is desirable for shareholders, we expect firms to particularly reduce disclosure visibility in these scenarios. The second variable, ABOVE_BENCHM, is an indicator variable equal to one when the ETR exceeds the lagged industry mean ETR by more than ten per cent. Again, this measure is not simply the opposite of BENCHM. While BENCHM reflects the absolute deviation from the lagged industry mean ETR and hence treats deviation in both directions as equal, this measure focuses on ETRs that are (substantially) higher than the benchmark. We assume that it is generally beneficial for a firm to stay close to the industry benchmark but that it is particularly disadvantageous to have a much higher ETR.
3.3. Regression model
To analyse the relation between ETR visibility and the ETR condition, we estimate the following regression model:
(2)
(2)
where ϵ is the error term, i indicates the firm, and t the year. The variables are defined in . We estimate the model with two alternative variables for ETRDISCL, namely, the above-defined disclosure measures M_REPORT and PAGE. Further, for each dependent variable, we estimate six different models in which ETRCOND represents the ETR measures SMOOTH, BENCHM, DECR1, DECR2, VOLETR, and ABOVE_BENCHM. While we estimate OLS regressions for the dependent variable PAGE, we use logit models for the dichotomous dependent variable M_REPORT.Footnote16 All models are estimated with standard errors clustered by firm and include year – and industry-fixed effects.Footnote17
To control for the level of the current ETR, we include ETR in our regressions. It is measured as the total income tax expense divided by pre-tax income. Further control variables are derived from the disclosure and tax literature (e.g. Li Citation2008, Hope et al. Citation2013, Bova, Dou, and Hope Citation2015): SIZE is the firm size and is measured by the natural logarithm of sales; ROA is the return on assets calculated as pre-tax income divided by lagged total assets; AUD is an indicator variable indicating whether a firm is audited by one of the Big4 auditors; PPE measures gross property, plant, and equipment divided by lagged total assets; R&D denotes research and development expenses divided by lagged total assets; and LEV is the ratio of long-term debt to total assets, measuring how strongly a firm is leveraged.
Our additional control variable, ARSCORE, is a disclosure score of the overall level of annual report content quality. This is an important variable, as it is a proxy for the general (ETR-unrelated) disclosure behaviour of a firm. The score is based on the German yearly annual report contest ‘Der beste Geschäftsbericht’ (Baetge Citation1997). For this competition, every year, the annual reports of large German listed companies are analysed with respect to content, design, and language by a research group. We use the results of the ‘annual report content’ category for which the scores range from zero to 100 (100 denotes the highest level of content quality). However, this data is only available for part of our sample period. Scores for the periods 2005–2012 and 2014–2016 are obtained from Manager Magazin, a German business periodical, or are provided directly by the Baetge research group. For the remaining sample years, the annual report contest was not carried out; therefore, we use data from an alternative contest, ‘Investors’ Darling’, which is organised by the Chair of Accounting and Auditing at the Leipzig Graduate School of Management (HHL). The data is available online (ID Citation2020) and starts with the scores for 2013. We use the scores of the ‘reporting annual report’ category, and these scores also range from zero to 100. To ensure the two rankings are comparable, we examine the yearly correlation of the scores for the overlapping years 2014–2016.Footnote18 We find a positive and significant (at least at the five per cent level) Spearman correlation of between 0.38 and 0.40. For our final variable ARSCORE, we use the yearly score from the Baetge research group ranking for the periods 2005–2012 and 2014–2016 and from the ‘Investors' Darling' ranking for 2013 and the period 2017–2018. The score is divided by 100, resulting in a score of between zero and one, with a higher score indicating higher quality disclosure.
4. Data
4.1. Sample
Our sample covers firm-year observations for German DAX30 and MDAX firms for the period 2005–2018.Footnote19 We examine the largest and most visible German firms because they attract considerable public attention and the managers of these firms can reasonably expect their tax disclosures to be scrutinised by a broad audience. While this characteristic of our sample attenuates the threat of increased tax auditor attention because firms of this size are subject to continuous tax audits, anecdotal evidence indicates that large firms still do not want to highlight tax aggressive behaviour because this can negatively affect the tax audit climate (see Appendix A for details).
The sample period starts in 2005 because we include only IFRS-adopting firms in our sample to eliminate any impact of standard-specific disclosure requirements.Footnote20 We obtain financial and accounting data from Thomson Reuters’ Worldscope database. The disclosure information is individually collected from firms’ annual reports. The sample selection is described in .
Because not all of our 80 sample firms were listed on a German stock exchange throughout the whole sample period and due to the limited availability of annual reports, our initial sample is an unbalanced panel with 1,070 firm-year observations. We exclude 21 observations for which financial statements were prepared under non-IFRS reporting standards.Footnote21 Further, we drop observations with negative pre-tax income or negative tax expenses and cases in which the tax expense exceeds the pre-tax income. These cases are potentially interesting, and the disclosure may differ from the average disclosure behaviour. Therefore, we implement additional tests in the online Appendix to examine these unusual ETRs yet exclude the observations from our main tests because they can indicate unusual circumstances that affect generalisability and may bias our main results. By eliminating these outliers, we lose 95 observations. Our sample is further reduced by 255 observations with missing data. The final sample contains 699 observations of 70 firms.
4.2. Descriptive statistics
presents the yearly development of the mean for the disclosure visibility variables M_REPORT in Panel A and PAGE (before multiplying by negative one) in Panel B. Panel B additionally shows the development for the unscaled variable PAGE. Some minor yearly changes in the mean are observable in all three graphs but without a clear trend. The t-tests of the differences in the means of consecutive years show no statistical significance.
Summary statistics for the regression variables are presented in Panel A of . The variables for page number and the smoothing and benchmark variables are per construction negative. We find that 78 per cent of our observations disclose the ETR in the management report (M_REPORT). The ETR is disclosed on average on page 88 of the annual report, with the earliest reference on page 2 (PAGE unscaled). For 56 per cent of all observations, the ETR decreases from the prior to the current year (DECR1), and 26 per cent of cases show two subsequent decreases (DECR2). The average distance from the mean lagged industry ETR is 0.08 (BENCHM),Footnote22 and 25 per cent of all observations have an ETR of more than ten per cent above the mean lagged industry ETR (ABOVE_BENCHM). The average ETR is 0.29, which is very close to the current German corporate statutory tax rate.
A sample split into firm-years with decreasing and increasing ETRs is available in the online Appendix, and when the ETR is decreasing, it provides initial evidence of a higher likelihood that firms disclose the ETR in the management report and on average on an earlier page. This result is supported by a Spearman correlation matrix that is presented in Panel B of Table 4. It indicates a positive (negative) and significant correlation between the disclosure visibility variables M_REPORT and PAGE and our Category 1 (Category 3) variables SMOOTH and BENCHM (VOLETR). In three out of four cases, the disclosure visibility variables are significantly positively correlated with the Category 2 variables (DECR1, DECR2). The correlations for ABOVE_BENCHM are insignificant.
5. Regression results
, Panel A presents the regression results for the dependent variable M_REPORT. Given the dichotomous nature of the dependent variable, we estimate a logit model instead of applying OLS. The standard errors clustered by firm are presented below the coefficients in parentheses. Industry- and year-fixed effects are included in all models but not reported. The first two columns present the results for our tests of Category 1 ETRs. The two ETR condition variables SMOOTH and BENCHM have positive coefficients, which are significant at least on the five per cent level. These results corroborate our prediction that the ETR is highlighted, i.e. disclosed in the management report, when the ETR condition is favourable for shareholders and not associated with costs. The results for Category 2 are in columns three and four. Both DECR variables have positive and significant coefficients, suggesting that the likelihood of a firm reporting the ETR in its management report increases when the ETR is decreasing. This finding indicates that the expected benefits of highlighting the ETR outweigh the expected costs. The regression results for Category 3 ETRs (unfavourable conditions) are presented in the last two columns. The coefficient for volatile (VOLETR) ETRs is negative and significant and insignificant for ETRs well above the industry average (ABOVE_BENCHM). A reverse relation with M_REPORT relative to that of the other categories suggests that disclosure costs prevent firms from highlighting the ETR when it is unfavourable for shareholders.
Regarding the control variables, the ETR level (ETR) is not significantly related to M_REPORT in most models, indicating that the disclosure decision is not based on the level alone but rather on the specific ETR condition (additional tests in Section 6 provide further insights on the relation between the ETR level and disclosure behaviour). We find a positive and significant coefficient for ARSCORE, suggesting that the decision whether to report the ETR in the management report is related to overall disclosure behaviour. This provides support for the choice of our disclosure variable, which captures a specific disclosure decision but at the same time contributes to the general annual report quality. In line with prior literature that found a positive association between disclosure and profitability (e.g. Lang and Lundholm Citation1993), the positive and (mainly) significant coefficient for ROA indicates that more profitable firms are more likely to disclose the ETR in the management report. Further, the results show a significantly positive (negative) coefficient for R&D (PPE), suggesting a higher (lower) likelihood of ETR disclosure in the management report for more research-active (long-term asset intensive) firms. Presumably due to the nature of the disclosure variable, which is tailored to reflect ETR-specific disclosure behaviour, the remaining control variables are not significantly related to disclosure visibility.
Panel B of presents the results of the OLS estimations with our second disclosure visibility variable PAGE. All ETR condition variables have the same sign in Panel B as in Panel A and are significant at least on the five per cent level, except for ABOVE_BENCHM, which again has an insignificant coefficient. The findings of Panel B indicate that the ETR is disclosed on an earlier (later) page in the annual report if the condition is (un-)favourable for shareholders. This finding also holds for decreasing ETRs (Category 2), which we assume to be associated with disclosure costs due to adverse actions from other stakeholders. The control variables ARSCORE and PPE have the same sign in Panel B as in Panel A and have significance values in Panel B similar to those in Panel A, again indicating a positive association with overall annual report quality and a negative association with long-term asset intensity. All other control variables have insignificant coefficients.
In sum, the findings in provide support for our hypotheses. The results for both disclosure measures consistently indicate a higher (lower) visibility for ETR conditions that are favourable (unfavourable) from a shareholder perspective. This inference holds for ETR conditions not associated with disclosure costs (Category 1) and, more importantly, also for decreasing ETRs associated with disclosure costs (Category 2). This suggests that firms estimate the benefits of drawing attention to shareholder favourable ETRs to outweigh the potential costs of the disclosure. Interestingly, we do not find significant results for ETRs well above the industry average (ABOVE_BENCHM). While the fact that the peer firms’ ETR is a benchmark for firms’ own tax behaviour that is well-established in the literature (e.g. Kubick et al. Citation2016, Bird et al. Citation2018, Bruehne and Schanz, Citation2018, Armstrong et al. Citation2019), the costs for disclosing an ETR above this benchmark seem not to have a negative effect on disclosure visibility. This differs from the results for very volatile ETRs and could be an interesting avenue for future research.
6. Additional tests
6.1. Family firms
To address cross-sectional differences in the ETR disclosure behaviour, we identify a group of firms for which we expect a different cost-benefit trade off: family firms. Family firms are subject to different agency conflicts than non-family firms, resulting in family firm-specific financial disclosure decisions (Ali, Chen, and Radhakrishnan Citation2007, Chen, Chen, Cheng, and Shevlin Citation2010, Sue, Chin, and Chan Citation2013, Gomez-Mejia et al., Citation2014). Chen et al. (Citation2008) find that consistent with higher reputational concerns, family firms issue fewer earnings forecasts and conference calls but more earnings warnings. Further support for reputational concerns in family firms comes from Chen et al. (Citation2010), Badertscher, Katz, and Rego (Citation2013), and Landry, Deslandes, and Fortin (Citation2013), who document that family firms are less tax aggressive than non-family firms. For this group of firms, a positive image and trustworthiness are of considerable importance. As taxes typically are not considered as a field that particularly contributes to the firm’s positive image, we do not assume overall favourable ETR conditions such as smooth ETR (Category 1) being prominently disclosed by family firms. Therefore, we expect that Category 1 conditions (even though considered favourable conditions) are not highlighted. Further, we suppose more weight on fostering a trusting relationship with stakeholders. In line with Chen et al. (Citation2008) and our anecdotal evidence, we therefore predict family firms to proactively report and explain the ETR when it could raise potential concerns. Such concerns might be created by our Category 2 (decreasing) ETRs, indicating overly aggressive tax planning strategies. Further, Category 3 ETRs (volatile, above benchmark) might also negatively raise stakeholder awareness. We hypothesise family firms to pre-empt these concerns and increase disclosure for these conditions – not with the aim to highlight the ETR but rather to explain it.
Also, family firms responding differently than non-family firms can be attributed to differences in capital market sensitivity. Family firms typically are less dependent on the capital markets; i.e. they may have different management compensation models or be less reliant on capital market financing and long-term oriented shareholders (Miller and Le Breton-Miller Citation2005; Huybrechts, Voordeckers, Lybaert, and Vandemaele Citation2011).Footnote23 Hence, we assume that ETR conditions are only highlighted if this is considered necessary to take precautions of possible severe stakeholder concerns.
To test these propositions, we create an indicator variable representing family firms. We identify family firms based on whether a firm is listed on the DAXplus family 30 index.Footnote24 If listed, the indicator variable FAMILY is one and equals zero otherwise. Nine firms in our sample with overall 97 firm-years are classified as a family firm. We repeat our main tests including the indicator variable and the interactions between the indicator and the ETR condition variables.
The results for family firms are presented in CitationTable 6, Panel A, for M_REPORT and in Panel B for PAGE. Coefficients for the ETR condition variables have the same sign and similar significance levels and magnitudes as in CitationTable 5 for both dependent variables M_REPORT and PAGE (the coefficient for SMOOTH is insignificant in the M_REPORT model). This indicates that the relation between ETR condition and disclosure visibility in our main tests is corroborated for non-family firms. The FAMILY variable has a significantly positive coefficient in Panel A yet is mainly insignificant in Panel B, suggesting that family firms are on average more likely to disclose the ETR in the management report. However, this does not hold for the specific ETR conditions, as all interactions in Panel A have insignificant coefficients, suggesting that the likelihood of disclosing the ETR in the management report if it has a favourable or unfavourable condition is no different for family firms.
Interestingly, most of the interaction coefficients in Panel B are significant and have the opposite signs of the main variables. In particular, the interactions between FAMILY and the ETR condition variables from Categories 1 and 2 have negative coefficients, implying that if the ETR is smooth or decreasing, family firms disclose it on a later page than do non-family firms. The interaction with BENCHM is insignificant.
The finding for SMOOTH is consistent with our expectations that family firms do not highlight tax-related information (although favourable) unless they see the need to explain it to pre-empt concerns. Following this notion, the result for decreasing ETRs is not in line with our expectation. To further examine this issue, we compare the magnitude of decreases between family and non-family firms. Untabulated tests indicate that family firms have on average less pronounced ETR decreases (mean: −0.02) than non-family firms (mean: −0.19). We conjecture from the relatively small magnitude of ETR decreases in family firms that this ETR condition is unlikely to give rise to severe concerns and violate trust building relationships. This might reflect that family firms expect no special interest of other stakeholders in this information and hence do not highlight these slight decreases on an early page. Further, the decreases being of moderate magnitude reflects the socio-emotional attitude, i.e. on average less tax aggressiveness in family firms as compared to non-family firms. This is consistent with prior literature Chen et al. (Citation2010), Badertscher, Katz, and Rego (Citation2013), and Landry, Deslandes, and Fortin (Citation2013).
The results for Category 3 provide further support for the different disclosure behaviour of family firms, again showing interaction coefficients with reverse signs. When the ETR is volatile, family firms report the ETR on average on an earlier page than non-family firms. This result reflects that ETR conditions that are expected to raise severe concerns lead to disclosures on an early page. Volatile ETRs are very likely to raise such severe concerns and call for explanations of their irregular nature and the underlying one-time tax issues. This finding is consistent with family firms making decisions to also achieve socio-emotional goals, such as the projection of a positive image of the firm’s and the family’s reputations (e.g. Deephouse and Jaskiewicz Citation2013) and the fostering of a trusting relationship with stakeholders by reflecting high accounting quality (Tong Citation2007).
Altogether, these findings suggest that the ETR disclosure behaviour of family firms differs significantly from that of non-family firms. The results are consistent with prior literature in that family firms increase disclosure of unfavourable information to avoid reputational damage (Chen et al. Citation2008). Further, this evidence provides support for our assumption that ETR disclosure visibility is an outcome of trading off the costs and benefits of disclosure. However, this finding has to be interpreted with caution as it is only observable for one of our dependent variables and due to the relatively small number of family firms. Hence, it might for example be sensitive to alternative family firm definitions or sample compositions.
6.2. ETR level and degree of decrease
The two decrease variables used in our Category 2 tests capture every form of decreaseFootnote25 – as soon as ETRt is lower than ETRt-1 (or ETRt < ETRt-1 < ETRt-2 for DECR2), the indicator variable is one. However, not every ETR decrease has the same implications. For example, a decrease from an ETR level of 10 per cent to an ETR level of 5 per cent is probably associated with different disclosure costs and benefits than a decrease from 35 to 30 per cent. Similarly, we expect a decrease by 20 percentage points to have different implications than a decrease by 2 percentage points. The evidence for nuanced investor preferences regarding the ETR level comes from the extant research, for example, Hanlon and Slemrod (Citation2009), who find that while investors generally appreciate tax avoidance, they react negatively to overly aggressive tax avoidance. In a similar vein, Inger and Stekelberg (Citation2020) document that investors prefer socially responsible forms of tax avoidance.
To address the heterogeneity in ETR decreases, we perform a number of supplemental tests in which we address a) the level from which the ETR decreases and b) the degree of the decrease. Therefore, we redefine our DECR1 variable. To examine the level from which the ETR decreases, we split the ETR distribution into quartiles and separately examine decreases from ETR levels in the following percentage ranges: 75–100, 50–75, 25–50, and 0–25. We expect the disclosure costs to be higher in the top and bottom ranges, as very low ETRs are likely to attract public attention and very high ETRs are disliked by investors. To analyse the degree of the decrease, we define four ranges of percentage point decreases that we believe to be reasonable thresholds: 0–5, 5–10, 10–20, and more than 20 percentage points.Footnote26 We expect disclosure costs to be particularly high for large decreases, as they provoke considerable attention. We create an indicator variable that has the value of one if the ETR decreases from the respective level or the ETR decreases by the percentage points in the respective range.
The results for ETR level tests are presented in Panel A, and those for ETR degree tests are presented in Panel B of . The findings in Panel A indicate significant coefficients for the DECR variable only in the range of 25–50. In this range, we find consistently positive and significant coefficients for models with either M_REPORT or PAGE as the dependent variable. ETR decreases from levels above or below this range show mainly negative coefficients and are not significantly associated with disclosure visibility. Consistent with the view that there are high disclosure costs at the margins, the results suggest that the ETR is not highlighted despite a decrease if the ETR is not at conventional levels. The results in Panel B follow a similar line: we find a positive and significant relation with disclosure visibility (for both dependent variables) for decreasing ETRs only if the decrease is in the lowest range between 0 and 5 percentage points. For large decreases (>20), the sign flips, and we find a significantly negative coefficient. This suggests that only moderate decreases are highlighted, while visibility is reduced for extreme decreases.
In sum, both sets of additional tests indicate that ETR decreases are only highlighted if they are moderate and within a reasonable ETR range, as attention is drawn away from cases that are abnormal or extreme. This finding is particularly interesting because it supports our theoretical expectation of disclosure benefits in the case of a favourable ETR. An alternative explanation is given by the following reasoning. A firm does not highlight favourable conditions but rather discloses the ETR early and visibly if it has a condition that requires additional explanations. The purpose of this early disclosure is to anticipate concerns and provide clarifying information early to shield against first sight and uninformed prejudices or negative conclusions. However, the additional tests in document that this alternative reasoning does not explain the disclosure behaviour of the average firm in our sample.
Following the same notion as that in the ETR level and degree tests, we further explore disclosure behaviour for decreasing but unusual ETRs by extending our sample in additional tests. We include observations that were previously dropped from the sample (see ) because they have unusual values for either the numerator (total tax expense) or the denominator (pre-tax income) of the ETR. The results support our inferences that firms only highlight decreasing ETRs if the ETR is in a reasonable range and reduce visibility when the ETR is unusual. Details on the tests are provided in the online Appendix.
7. Sensitivity tests
7.1. Robustness tests
We examine the robustness of our main findings in several additional sensitivity analyses. First, we control for concerns related to Germany’s 2008 corporate tax reform. Among the most noteworthy changes of the tax reform is a cut in the corporate income tax rate from 25 to 15 per cent. However, other changes, such as the interest-capping rule or the reduction of certain tax deductions, could also affect the ETR. Hence, a lower ETR after the reform does not necessarily indicate an intentional reduction in the ETR but likely results from the tax rate cut. To control for the effect of the tax reform, we re-estimate our main regressions while excluding 174 observations for the period before 2009. The results (untabulated) show weaker significance levels for single variables but are qualitatively unchanged relative to our main findings.
Prior studies often exclude observations from utilities and financial institutions because such firms are subject to different regulations and reporting requirements (see, e.g. Hanlon Citation2005). Hence, we repeat our main tests after excluding 18 observations from these industries (SIC 4900–4999 and SIC 6000-6099). The results (untabulated) are very close to our main findings and do not affect our inferences.
Finally, we add two additional variables to our baseline models to control for corporate governance. The prior literature indicates a relation between corporate governance and the firms’ tax avoidance and also a relation with accounting quality (Armstrong et al. Citation2015, Larcker, Richardson, and Tuna Citation2007). Hence, corporate governance may affect the ETR disclosure behaviour. In line with prior literature (e.g. Shleifer and Vishny Citation1997, Larcker et al. Citation2007), we include the number of block holders and the fraction of shares owned by block holders as corporate governance measures. We do not include these variables in our main tests because we only have the most recent block holder information but no historic data for this variable. Including the corporate governance variables does not affect our inferences and results in insignificant coefficients for both control variables.
7.2. Endogeneity
Our analysis might be subject to potential endogeneity concerns, in particular simultaneity, which arises because firms have influence on both the disclosure visibility and the ETR condition. Hence, it is not obvious which comes first, and firms may even decide on both at the same time. This concern is mitigated by anecdotal evidence from our interviews that indicates that the ETR is usually determined first and the disclosure is adjusted to the ETR level in the second step. Often, different departments are responsible for making decisions for managing the ETR level (tax manager) and for disclosing the ETR (investor relations):
On the basis of the outcome of the ETR, the Head of Taxes provides all necessary explanations to the Investor Relations department.
Global Head of Taxes of a major German listed corporation
Based on our anecdotal evidence, we assume that while the ETR is not exogenous on the firm-level, it is exogenous within the firm for the department responsible for the disclosure behaviour (typically Investor Relations). More examples and details on the interviews are provided in Appendix A. To address the remaining concerns, we empirically tackle the endogeneity of the ETR condition variables by applying an instrumental variable approach in a two-stage least squares estimation (2SLS) in the online Appendix. Our findings are qualitatively similar to those in our baseline regressions. We also provide a firm-fixed effects estimation in the online Appendix to address concerns of correlated omitted variables. However, due to the unbalanced panel structure of our sample, this analysis mostly does not yield conclusive results.
8. Conclusion
We examine the visibility of ETR information in financial statements. To examine the effect of different stakeholder-specific preferences on firms’ disclosure behaviour, we analyse several ETR conditions classified into three categories. We find increased ETR visibility when the ETR has a favourable condition from a shareholder-oriented perspective. This finding holds for our ETR Category 1 (smooth or close to the average industry ETR) and Category 2 (decreasing ETR), indicating that visibility is higher even if considerable disclosure costs can be expected. The Category 3 results suggest a tendency towards reduced visibility for unfavourable ETR conditions (very volatile ETR). In additional tests, we find that the ETR disclosure of family firms differs from that of non-family firms, suggesting cross-sectional differences in the cost–benefit trade-off. Further, we document that the ETR visibility varies with the level of the ETR and the degree of the decrease. While ETR decreases from usual levels and of moderate degree are highlighted, visibility does not increase or even decreases for extreme cases. Our findings suggest that the expected benefits of highlighting favourable ETRs seem to outweigh the predicted costs resulting from other stakeholder concerns but only if the ETR level and decrease is not unusual. Our findings are robust to a number of sensitivity tests, and endogeneity concerns are mitigated by anecdotal evidence from our interviews with tax directors.
In providing evidence of firms’ disclosure incentives, we contribute to the tax disclosure literature and help explain prior evidence of cross-sectional differences in firms’ disclosure behaviours (e.g. Kvaal and Nobes Citation2013). Moreover, our results suggest that the way ETRs are disclosed is a powerful signal. Our evidence may encourage investors to consider ETR information in their assessment of a firm’s tax status, tax risks and ultimately in their decision-making. Specifically, low ETR disclosure visibility can be an indicator of an unfavourable or extreme ETR and could hence encourage investors and other financial statement readers to scrutinise tax information more closely. Current initiatives to increase mandatory tax transparency may affect firms’ cost–benefit trade-offs. Thus, our findings also suggest that increased mandatory tax disclosure may have an (unintended) impact on voluntary disclosure behaviour by dampening or crowding out the signal from voluntarily highlighted ETR information.
Supplemental Material
Download MS Word (86.8 KB)Acknowledgements
We thank Martin Jacob (Associate Editor) and two anonymous reviewers for their very insightful suggestions, which have significantly improved the paper. We also thank the participants of the 2013 arqus Doctoral Workshop and participants at the 2018 European Accounting Association conference for their valuable comments on an earlier version of this paper. We are grateful to the Baetge research team for sharing the annual report quality data and thank Fabian Peitz and Isis Swoboda for excellent research assistance. We gratefully acknowledge funding provided by the Deutsche Forschungsgemeinschaft (DFG, German Research Foundation) – Project-ID 403041268 – TRR 266.
Disclosure statement
No potential conflict of interest was reported by the author(s).
Additional information
Funding
Notes
1 See Appendix A for details on the interviews.
2 Positive capital market reactions mainly apply to non-aggressive tax avoidance. Hanlon and Slemrod (Citation2009) observe negative stock price reactions to news about a company’s involvement in a tax shelter. However, Gallemore, Maydew, and Thornock (Citation2014) find that negative capital market reactions to news of aggressive tax avoidance reverse soon after.
3 We use the acronym ‘IFRS’ to refer to all standards issued by the International Accounting Standards Board (IASB) and the predecessor International Accounting Standards Committee (IASC), including IFRS and International Accounting Standards (IAS).
4 Our definition of a ‘decreasing ETR’ (Category 2) focusses on the positive outcomes of the ETRs below 100% only. For our main empirical analysis, we abstract from observations with negative pre-tax income or negative tax expenses and cases in which the tax expense exceeds pre-tax income. Given the more complex nature of the underlying economic reasoning of these unusual ETRs, it is not upfront clear how other stakeholders would interpret them. However, as their disclosure is interesting but may differ from the average disclosure behaviour, we conduct additional tests in the online Appendix. For further details on our ETR operationalization, see Section 4.
5 For details on the differences, please see the variable construction in Section 3.
6 More recent evidence in Bartlett and Chandler (Citation1997) corroborates these findings.
7 ‘Effektivsteuer’ = effective tax, ‘Steuerquote’ = tax rate, and ‘Konzernsteuer’ = corporate tax.
8 In examining the annual reports in more detail, we find other expressions for the ETR, e.g., ‘Ertragsteueraufwand in Prozent’ (income tax expense percentage), which we also count. As no equivalent abbreviation for ‘ETR’ exists in German, we find no relevant abbreviations.
9 For further evidence of the information recipients’ limited attention spans, see Simon (Citation1971), who first identified the concept of the Attention Economy.
10 We do not record the page number printed in the annual reports but instead the page number counted from page one (the cover page of each annual report).
11 When we use the unscaled variable PAGE instead of scaling by the total number of pages, the results remain essentially unchanged.
12 If we instead drop 71 observations with missing references to the ETR, the results for BENCHM, DECR1, and VOLETR are similar to our main findings, while the coefficients for SMOOTH and DECR2 are insignificant.
13 We use a rolling five-year window.
14 As a robustness test, we apply a more refined industry classification by using the two-digit SIC code for an extended sample. We calculate the industry average of an international sample with 520,075 observations available from the Worldscope database (after dropping firms that are smaller than the smallest firm in our sample), because the sample firms are multinational corporations which compete in worldwide markets. The coefficients of the estimations for the extended sample have the same sign, significance level and increase in magnitude as the those in the findings for BENCHM in our main tests.
15 ETRt < ETRt-1 < ETRt-2.
16 If we instead estimate OLS models for M_REPORT or a Tobit model for PAGE (which is censored at -1 and 0), the results are qualitatively unchanged.
17 If we replace year-fixed effects with a trend variable to capture whether a linear trend exists in the development of the dependent variable, our inferences are not affected. Due to the unbalanced sample and short sample period, the firm-fixed effects are only included in robustness tests.
18 If we drop all years for which the Baetge research group ranking is not available (169 observations), the results are very similar to our main results except for SMOOTH, which is no longer significant in M_REPORT models.
19 We include those firms in our sample that were part of the DAX30 or MDAX on an arbitrary date, which in this case, was November 28, 2013.
20 Firms listed on an EU-regulated market have to adopt IFRS for their consolidated statements for fiscal years beginning January 1, 2005 (EC Regulation No. 1606/2002).
21 Firms already applying international standards (e.g., US-GAAP) were allowed to defer IFRS adoption to 2007.
22 The value of 0.08 must be interpreted as follows: for example, when the lagged industry ETR has a mean of 0.30, the firm ETR deviates by 0.08 on average. As the value is expressed in absolute terms, it could indicate an ETR of 0.22 or 0.38. The negative sign results from multiplying the value by -1 to align the direction with the other ETRCOND variables.
23 This is consistent with evidence on higher tax aggressiveness in non-family firms (Chen et al. Citation2010) and, relatedly, with public family firms avoiding taxes significantly more than private family firms (Brune, Thomsen, and Watrin Citation2019).
24 A firm qualifies for this index if the founding families hold at least a 25 per cent share of the voting rights or sit on the management or supervisory board and hold at least a 5 per cent share of the voting rights. See Deutsche Börse (Citation2009) for details. We consider the index composition as of May 11, 2020. Using the same date as for the sample composition of our main sample (November 28, 2013), does not qualitatively affect our inferences.
25 Please note that these tests are conducted for positive ETRs only. Observations with negative pre-tax income or negative tax expenses and cases in which the tax expense exceeds the pre-tax income are excluded from the sample. We conduct additional tests for such unusual ETRs in the online Appendix.
26 We have only a few observations (25) in the highest decrease range of more than 20 percentage points; therefore, a more granular split above 20 does not make sense for our sample.
27 Page 32 in terms of the page number printed in the document and page 39 in terms of the total counted pages (which we record for our data). The reference in the management report reads (translated): ‘The ETR decreased to 29.1 per cent.’
28 Bayer does not report the ETR in its 2007 management report. The only reference to the ratio is in the notes.
References
- Akamah, H., Hope, O.-K., and Thomas, W.B., 2018. Tax havens and disclosure aggregation. Journal of International Business Studies, 49 (1), 49–69.
- Ali, A., Chen, T.-Y., and Radhakrishnan, S., 2007. Corporate disclosures by family firms. Journal of Accounting and Economics, 44 (1–2), 238–286.
- Armstrong, C.S., Blouin, J.L., and Jagolinzer, A.D., 2015. Corporate governance, incentives, and tax avoidance. Journal of Accounting and Economics, 60, 1–17.
- Armstrong, C.S., Blouin, J.L., and Larcker, D. F., 2012. The incentives for tax planning. Journal of Accounting and Economics, 53 (1–2), 391–411.
- Armstrong, C.S., Glaeser, S., and Kepler, J.D., 2019. Strategic reactions in corporate tax planning. Journal of Accounting and Economics, 68 (1), 1–26.
- Atwood, T.J., and Reynolds, J.K., 2008. The pricing of realized tax benefits from NOL carryforwards: Effect of income statement presentation. The Journal of the American Taxation Association, 30 (1), 1–27.
- Badertscher, B.A., Katz, S.P., and Rego, S.O., 2013. The separation of ownership and control and corporate tax avoidance. Journal of Accounting and Economics, 56 (2–3), 228–250.
- Baetge, J., 1997. Anforderungen an die Geschäftsberichterstattung aus betriebswirtschaftlicher und handelsrechtlicher Sicht. Deutsches Steuerrecht, 35, 176–180.
- Balakrishnan, K., Blouin, J., and Guay, W., 2019. Does tax aggressiveness reduce corporate transparency. The Accounting Review, 94 (1), 45–69.
- Barford, V., and Holt, G., 2013. Google, Amazon, Starbucks: The rise of ‘tax shaming’. BBC News Magazine. Available online: http://www.bbc.com/news/magazine-20560359 (last access 2019/09/10).
- Bartlett, S.A., and Chandler, R.A., 1997. The corporate report and the private shareholder: Lee and Tweedie twenty years on. British Accounting Review, 29, 245–261.
- Bedard, J. C., Falsetta, D., Krishnamoorthy, G., and Omer, T. C., 2010. Voluntary disclosure of auditor-provided tax service fees. Journal of the American Taxation Association, 32 (1), 59–77.
- Beyer, A., Cohen, D.A., Lys, T.Z., and Walther, B.R., 2010. The financial reporting environment: Review of the recent literature. Journal of Accounting and Economics, 50 (2–3), 296–343.
- Bird, A., Edwards, A., and Ruchti, T.G., 2018. Taxes and peer effects. The Accounting Review, 93 (5), 97–117.
- Bischof, J., and Daske, H., 2013. Mandatory disclosure, voluntary disclosure, and stock market liquidity: Evidence from the EU bank stress tests. Journal of Accounting Research, 51 (5), 997–1029.
- Bova, F., Dou, Y., and Hope, O.-K., 2015. Employee ownership and firm disclosure. Contemporary Accounting Research, 32 (2), 639–673.
- Bozanic, Z., Hoopes, J.L., Thornock, J.R., and Williams, B.M., 2017. IRS attention. Journal of Accounting Research, 55 (1), 79–114.
- Bratten, B., Gleason, C.A., Larocque, S.A., and Mills, L.F., 2017. Forecasting taxes: New evidence from analysts. The Accounting Review, 92 (3), 1–29.
- Bruehne, A., and Schanz, D., 2018. Building up a protective shield: The role of tax communication for corporate tax risk management. Working Paper. Available at SSRN: https://ssrn.com/abstract=3254915 (last access 2020/07/23).
- Brune, A., Thomsen, M., and Watrin, C., 2019. Family firm heterogeneity and tax avoidance: The role of the founder. Family Business Review, 32 (3), 296–317.
- Chen, S., Chen, X., and Cheng, Q., 2008. Do family firms provide more or less voluntary disclosure? Journal of Accounting Research, 46 (3), 499–536.
- Chen, S., Chen, X., Cheng, Q., and Shevlin, T., 2010. Are family firms more tax aggressive than non-family firms? Journal of Financial Economics, 95, 41–61.
- Chen, N., Chi, S., and Shevlin, T.J., 2019. A Tale of two forecasts: An analysis of mandatory and voluntary effective tax rate forecasts. Working Paper. Available at SSRN: https://ssrn.com/abstract=3271837 (last access 2020/07/25).
- Chychyla, R., Falsetta, D., and Ramnath, S., 2017. Determinants and consequences of presentation format: The case of ETR reconciliations. University of Miami Working Paper. Available at: https://pages.business.illinois.edu/accountancy/wp-content/uploads/sites/12/2017/09/Tax-Symposium-2017-Session-III-b.pdf (last access 2021/02/26).
- De Franco, G., Wong, M.H.F., and Zhou, Y., 2011. Accounting adjustments and the Valuation of financial statement note information in 10-K filings. The Accounting Review, 86 (5), 1577–1604.
- Deephouse, D. L., and Jaskiewicz, P., 2013. Do family firms have better reputations than non-family firms? An integration of socioemotional wealth and social identity theories. Journal of Management Studies, 50 (3), 337–360.
- Demeré, P., Li, L.Y., Lisowsky, P., and Snyder, R.W., 2019. Do smoothing activities indicate higher or lower financial reporting quality? Evidence from effective tax rates. Working Paper. Available at SSRN: https://ssrn.com/abstract=2757786 (last access 2019/08/31).
- Desai, M.A., and Dharmapala, D., 2009. Corporate tax avoidance and firm value. The Review of Economics and Statistics, 91 (3), 537–546.
- Deutsche Börse, 2009. Deutsche Börse launches index for the family business segment. Available online: https://www.deutsche-boerse.com/dbg-en/media/press-releases/Deutsche-B-rse-Launches-Index-for-the-Family-Business-Segment-584400 (last access 2020/07/16).
- Dye, R.A., 2001. An evaluation of “essays on disclosure” and the disclosure literature in accounting. Journal of Accounting and Economics, 32 (1–3), 181–235.
- Dyreng, S.D., Hanlon, M., and Maydew, E.L., 2008. Long-run corporate tax avoidance. The Accounting Review, 83 (1), 61–82.
- Dyreng, S.D., Hanlon, M., and Maydew, E.L., 2019. When does tax avoidance result in tax uncertainty. The Accounting Review, 94 (2), 179–203.
- Dyreng, S.D., Hoopes, S.J., and Wilde, J., 2016. Public pressure and corporate tax behavior. Journal of Accounting Research, 54 (1), 147–186.
- Dyreng, S.D., and Lindsey, B.P., 2009. Using financial accounting data to examine the effect of foreign operations located in tax havens and other countries on U.S. multinational firms' tax rates. Journal of Accounting Research, 47 (5), 1283–1316.
- Flagmeier, V., and Müller, J., 2017. Tax Loss carryforward disclosure and uncertainty. Arqus Discussion Paper No. 208. Available online: http://www.arqus.info/mobile/paper/arqus_208.pdf (last access 2020/07/27).
- Frischmann, P.J., Shevlin, T., and Wilson, R., 2008. Economic consequences of increasing the conformity in accounting for uncertain tax benefits. Journal of Accounting and Economics, 46 (2–3), 261–278.
- Gallemore, J., Maydew, E.L., and Thornock, J.R., 2014. The reputational costs of tax avoidance. Contemporary Accounting Research, 31 (4), 1103–1133.
- Gleason, C.A., and Mills, L.F., 2002. Materiality and contingent tax liability reporting. The Accounting Review, 77 (2), 317–342.
- Gomez-Mejia, L., Cruz, C., and Imperatore, C., 2014. Financial reporting and the protection of socioemotional wealth in family-controlled firms. European Accounting Review, 23 (3), 387–402.
- Graham, J. R., Hanlon, M., and Shevlin, T., 2011. Real effects of accounting rules: Evidence from multinational firms’ investment location and profit repatriation decisions. Journal of Accounting Research, 49 (1), 137–185.
- Graham, J.R., Hanlon, M., Shevlin, T., and Shroff, N., 2014. Incentives for tax planning and avoidance: Evidence from the field. The Accounting Review, 89 (3), 991–1023.
- Graham, J.R., Hanlon, M., Shevlin, T., and Shroff, N., 2017. Tax rates and corporate decision making. The Review of Financial Studies, 30 (9), 3128–3175.
- Guenther, D.A., Matsunaga, S.R., and Williams, B.M., 2017. Is tax avoidance related to firm risk? The Accounting Review, 92 (1), 115–136.
- Hanlon, M., 2005. The persistence and pricing of earnings, accruals, and cash flows when firms have large book-tax differences. The Accounting Review, 80 (1), 137–166.
- Hanlon, M., Maydew, E.L., and Saavedra, D., 2017. The taxman cometh: Does tax uncertainty affect corporate cash holdings? Review of Accounting Studies, 22 (3), 1198–1228.
- Hanlon, M., and Slemrod, J., 2009. What does tax aggressiveness signal? Evidence from stock price reactions to news about tax shelter involvement. Journal of Public Economics, 93 (1–2), 126–141.
- Hodge, F., and Pronk, M., 2006. The impact of expertise and investment familiarity on investors’ use of online financial report information. Journal of Accounting, Auditing, and Finance, 21 (3), 267–292.
- Hope, O.-K, Ma, M., and Thomas, W.B., 2013. Tax avoidance and geographic earnings disclosure. Journal of Accounting and Economics, 56 (2–3), 170–189.
- Huybrechts, J., Voordeckers, W., Lybaert, N., and Vandemaele, S., 2011. The distinctiveness of family-firm intangibles: A review and suggestions for future research. Journal of Management and Organization, 17 (2), 268–287.
- Inger, K.K., Meckfessel, M.D., Zhou, M., and Fan, W., 2018. An examination of the impact of tax avoidance on the readability of tax footnotes. The Journal of the American Taxation Association, 40 (1), 1–29.
- Inger, K.K., and Stekelberg, J., 2020. Valuation implications of socially responsible tax avoidance: Evidence from the electricity industry. Working Paper, Available at SSRN: https://ssrn.com/abstract=3619486 (last access 2020/07/23).
- Investors’ Darling (ID), 2020. Investors’ darling – Ergebnisse der vergangenen jahre. Available online: https://kapitalmarkt-forschung.info/investors-darling-ergebnisse-der-vergangenen-jahre/ (last access 2020/07/13).
- Jacob, M., and Schütt, H., 2020. Firm valuation and the uncertainty of future tax avoidance. European Accounting Review, 29 (3), 409–435.
- Kasznik, R., and Lev, B., 1995. To warn or not to warn: Management disclosures in the face of an earnings surprise. The Accounting Review, 70 (1), 113–134.
- Koester, A., 2011. Investor valuation of tax avoidance through uncertain tax positions. Working Paper, Available at SSRN: https://ssrn.com/abstract=1905210 (last access 2019/09/10).
- Kubick, T.R., Lynch, D.P., Mayberry, M.A., and Omer, T.C., 2016. The effects of regulatory scrutiny on tax avoidance: An examination of SEC comment letters. The Accounting Review, 91 (6), 1751–1780.
- Kvaal, E., and Nobes, C., 2013. International variations in tax disclosures. Accounting in Europe, 10 (2), 241–273.
- Landry, S., Deslandes, M., and Fortin, A., 2013. Tax aggressiveness, corporate social responsibility, and ownership structure. Journal of Accounting, Ethics and Public Policy, 14 (3), 611–645.
- Lang, M., and Lundholm, R., 1993. Cross-sectional determinants of analyst ratings of corporate disclosures. Journal of Accounting Research, 31 (2), 246–271.
- Larcker, D.F., Richardson, S.A., and Tuna, Î., 2007. Corporate governance, accounting outcomes, and organizational performance. The Accounting Review, 82 (4), 963–1008.
- Lee, T.A., and Tweedie, D.P., 1975. Accounting information: An investigation of private shareholder usage. Accounting and Business Research, 5 (20), 280–291.
- Lev, B., and Thiagarajan, S.R., 1993. Fundamental information analysis. Journal of Accounting Research, 31 (2), 190–215.
- Li, F., 2008. Annual report readability, current earnings, and earnings persistence. Journal of Accounting and Economics, 45 (2–3), 221–247.
- Li, F., Lundholm, R., and Minnis, M., 2013. A measure of competition based on 10-K filings. Journal of Accounting Research, 51 (2), 399–436.
- Li, H., 2019. Repetitive disclosures in the MD&A. Journal of Business Finance and Accounting, 46 (9–10), 1063–1096.
- McGuire, S.T., Neuman, S.S., and Omer, T.C., 2013. Sustainable tax strategies and earnings persistence. Working Paper, Available at SSRN: https://ssrn.com/abstract=1950378 (last access 2020/07/27).
- Miller, D., and Le Breton-Miller, I., 2005. Management insights from great and struggling family business. Long Range Planning, 38 (6), 517–530.
- Neuman, S.S., Omer, T.C., and Shelley, M.J., 2013. Corporate transparency, sustainable tax strategies, and uncertain tax activities. Working Paper. Available at SSRN: https://ssrn.com/abstract=2184892 (last access 2020/07/27).
- Plumlee, M.A., 2003. The effect of information complexity on analysts’ use of that information. The Accounting Review, 78 (1), 275–296.
- Radin, A.J., 2007. Have we created financial statement overload? Available online: http://archives.cpajournal.com/2007/1107/perspectives/p6.htm (last access 2020/07/28).
- Robinson, J.R., Sikes, S.A., and Weaver, C.D., 2010. Performance measurement of corporate tax departments. The Accounting Review, 85 (3), 1035–1064.
- Shleifer, A., and Vishny, R., 1997. A survey of corporate governance. Journal of Finance, 52 (2), 737–783.
- Simon, H.A., 1971. Designing organizations for an information-rich world. In M. Greenberger (Ed.), Computers, communications, and the public interest (pp. 37–72). Baltimore, MD: The Johns Hopkins Press.
- Skinner, D., 1994. Why firms voluntarily disclose bad news. Journal of Accounting Research, 32 (1), 38–60.
- Stockmans, A., Lybaert, N., and Voordeckers, W., 2010. Socioemotional wealth and earnings management in private family firms. Family Business Review, 23 (3), 280–294.
- Sue, S.H., Chin, C.L., and Chan, A.L., 2013. Exploring the causes of accounting restatements by family firms. Journal of Business Finance and Accounting, 40 (9–10), 1068–1094.
- Swenson, C.W., 1999. Increasing stock market value by reducing effective tax rates. Tax Notes, (June 7) 1503–1505.
- Tong, Y. H., 2007. Financial reporting practices of family firms. Advances in Accounting, 23 (3), 231–261.
- Verrecchia, R.E., 2001. Essays on disclosure. Journal of Accounting and Economics, 32 (1–3), 97–180.
- Wagenhofer, A., 1990. Voluntary disclosure with a strategic opponent. Journal of Accounting and Economics, 12 (4), 341–363.
Appendices
Appendix A
1. Anecdotal evidence from interviews
Given our interest in managers’ disclosure strategies, we chose to conduct a few semi-structured interviews to accompany our findings from archival data analyses with anecdotal evidence. We prepared specific questions but were free to deviate from these to pursue any interesting ideas that may come up during the interview, returning to the planned interview questions after a while. This semi-structured approach allowed us to obtain a comprehensive overview. We found that this approach encouraged the interviewees to further contextualise their responses. This open form generated some differences in topics across the interviews, including a variety of follow-up questions from the interviewer. As the purpose of these interviews was to collect some anecdotal evidence we anticipated and indeed found that this was a very fruitful way to obtain a deeper insight into experienced tax managers’ reasoning on this topic.
We asked the tax managers to agree to an interview on ETRs so we could obtain some practitioners’ views on the topic in terms of tax planning and tax reporting. The interviewees were asked to commit to a 30-minute time slot, yet most interviews were approximately 45 min in length. All were conducted by the same author by telephone. We did not share the prepared questions upfront. The interviewees were told that their responses would be confidential and that neither their name, nor their company’s name, nor any identifying information would be published. Given the specificity of the responses we received, we believe the interviewees were very candid.
We conducted five interviews. All interviewees are Global Heads of Taxes of major German multinationals (mostly DAX30-listed) and have occupied their positions for many years. Their companies are all headquartered in Germany and ranged from manufacturing and service-oriented firms, firms with consumer- and business-oriented business models, firms with different shares of institutional, private equity and retail investors, and family firms.
The following table summarises the respective quotes and displays them by topic.
2. Anecdotal evidence from annual reports
The following two examples provide anecdotal evidence on disclosure changes within firms. The first example is the ETR disclosure of Bayer AG from 2004 to 2008. In 2004, Bayer (already reporting under IFRS) has an ETR of 39.1 per cent and mentions the ETR once in the notes (M_REPORT: 0, PAGE: 0.62). In 2005, the ETR decreases to 29.1 per cent. The ETR is now mentioned in the management report (Bayer 2005 annual report, p. 32).Footnote27 Hence, our variable PAGE decreases to 0.17 and M_REPORT changes from zero to one. In 2006, the ETR decreases again to 22.9 per cent and reappears in the management report (Bayer 2006 annual report, p. 54). PAGE has a value of 0.29. 2007 is special because Bayer has a negative ETR of −3.2 per cent and is excluded from our main sample.Footnote28 However, in 2008 the ETR increases (compared to 2007 but also compared to 2006) to 26.9 per cent. Bayer does not mention the ETR in the 2008 management report. The disclosure is, as in 2004, limited to one reference in the notes. PAGE has a value of 0.70.
Another example is Leoni AG. In 2006, Leoni has an ETR of 32 per cent and discloses the ETR twice: once in the notes and once in the management report (Leoni AG 2006 annual report, p. 38). The disclosure in the management report explains the reasons for the decrease from 36.9 per cent in the previous year to 32 per cent in 2006. PAGE is 0.38. In 2007, the ETR decreases to 26 per cent and is mentioned three times. In addition to the reference in the notes and the explanation of the ETR decrease in the management report, the ETR is mentioned a second time in the management report, referring to the favourable effect of the ETR on after-tax income (Leoni AG 2007 annual report, p. 37). PAGE now has a value of 0.32. In 2008, the ETR increases to 67 per cent and appears only (once) in the notes, with a PAGE value of 0.71. Interestingly, the firm mentions the high tax burden relative to pre-tax income in the management report but does not state the ETR directly (Leoni AG 2008 annual report, p. 58).
Figure 1: Development of M_REPORT and PAGE (Unscaled and Scaled)
Notes: Development of the yearly average disclosure visibility measures M_REPORT and PAGE over the sample period 2005–2018. PAGE (unscaled) is the variable PAGE before dividing by the total number of annual report pages. Both PAGE variables are presented before multiplying by −1.
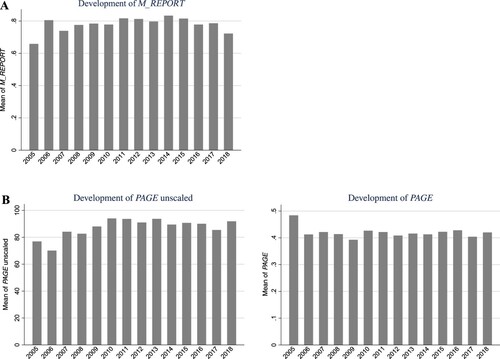
Table 1: ETR Conditions and Stakeholder Specific Assessments
Table 2: Variable Definitions
Table 3: Sample Selection (Sample Period 2005–2018)
Table 4: Summary Statistics
Table 5: ETR Conditions and Disclosure Visibility
Table 6: Family Firms
Table 7: ETR Decrease Level and Degree