

 ?Mathematical formulae have been encoded as MathML and are displayed in this HTML version using MathJax in order to improve their display. Uncheck the box to turn MathJax off. This feature requires Javascript. Click on a formula to zoom.
Abstract
Background: The peak oxygen uptake (VO2peak) test is the gold standard for cardiorespiratory fitness. However, the test is demanding, requiring sophisticated apparatus for measuring the oxygen uptake. Peak work rate (WRpeak) testing is a promising substitute for peak VO2peak testing. However, there is a paucity of research conducted to determine reference values (RVs) for WRpeak.
Methods: The database from the LowLands fitness registry was used, containing data from health checks from apparently healthy subjects among various professions. Exercise tests were performed using a cycle ergometer and a calibrated metabolic cart. Analysis was executed on 3463 subjects, 2868 male and 595 female. Reference values with corresponding centiles were developed using the LMS method.
Results: VO2peak and WRpeak where highly associated with Pearson’s correlation of 0.9 (p = .001). Weight, height, maximum heart rate, and the respiratory exchange ratio had a positive significant effect (p < .001) on WRpeak, and age a negative significant effect, in both males and females. The following formulas were computed for RVs:
Conclusions: WRpeak can be used as a substitute for VO2peak when a respiratory gas-analysis system is not available. This study provides RVs for WRpeak and WRpeak/kg in a healthy Dutch/Flemish adult population using cycle ergometry. Further research is needed to obtain RVs for elderly subjects, specific diseases, ethnicities and ergometers.
Introduction
Recently, there has been growing interest in the determination of cardiorespiratory fitness for health purposes. With the current sedentary lifestyle of many people, the relevance of cardiorespiratory fitness is important because it has a predictive role in the prevention of illnesses, such as cardiovascular diseases [Citation1,Citation2]. In a recent American Heart Association statement, cardiorespiratory fitness has been proposed as a new vital sign [Citation3].
The gold standard for measuring the cardiorespiratory fitness is cardiopulmonary exercise testing (CPET) with incremental exercise and the measurement of the peak oxygen uptake (VO2peak). This test gives in-depth insight in the function of the cardiorespiratory system, and can also be used to monitor the cardiorespiratory fitness over time. Several reference values (RVs) for VO2peak for specific age groups, weight, height, gender and ethnicity have been developed, in order to assist in the decision-making process [Citation4].
For screening purposes, however, VO2peak testing has its drawbacks. VO2peak testing is demanding, because the use of a sophisticated and expensive respiratory gas-analysis system is required. Therefore, for regular screening other tests, methods are considered. An often used test procedure is the exercise stress test in which only the peak workload (WRpeak) is used as a metric for exercise performance [Citation5]. Although research has been devoted to the testing of both WRpeak and VO2peak with RV for VO2peak, rather less attention has been paid to the correlation and RV for WRpeak as a substitute for the VO2peak RV. Brudin et al. [Citation6] provided normal values for WRpeak, but fails to provide RVs, due to the study design, where it includes exercise tests from unhealthy participants, considered to be normal by a trained examiner. Bovens et al. [Citation7] also provide Dutch normal values, but these are only applicable for an active middle-aged population.
Hakola et al. [Citation8] published RV, but these are only applicable for the elderly. Farazdaghi and Wohlfart [Citation9] also provided RVs for WRpeak, but with a relatively high estimation error, as a result of containing data from just 87 females. The study of Wohlfart and Farazdaghi [Citation10] has the same shortcoming with males. Arstila et al. [Citation11] provided RV for maximum workload using 4 minute stages, but did not compute RV for the exact WRpeak. Itoh et al. [Citation12], finally, published RV for WRpeak, amongst other metrics. However, these RVs are computed in a Japanese study group, and are likely to have discrepancy with western RVs. RVs have to be updated regularly, in order to remain relevant for clinical decision making.
The purpose of this paper [Citation1] is to analyse the association between WRpeak and VO2peak and [Citation2] to develop RV for WRpeak and WRpeak/kg in a large cohort of apparently health Dutch/Flemish adult subjects.
Methods
Study design
This study was conducted using data from the LowLands Fitness Registry. This database contains currently ‘open source’ exercise testing data from 11 centres, in the Netherlands and Belgium (Isala Hospital Zwolle, Diving Medical Center Den Helder, In2Motion Sports Bureau, Erasmus Medical Center Rotterdam, Ministry of Defense Testing Center, Soesterberg, University of Applied Science Utrecht, St Anna Hospital Geldrop, InspanningLoont Center Utrecht, Maxima Medical Center Veldhoven, Hospital Jan Portaels Vilvoorde, Radboud UMC Nijmegen). All centres provided de-identified exercise testing data to the LowLands Fitness Registry. The study was approved by the Medical Ethics Committee of the UMC Utrecht, the Netherlands (protocol 16/167).
Subjects
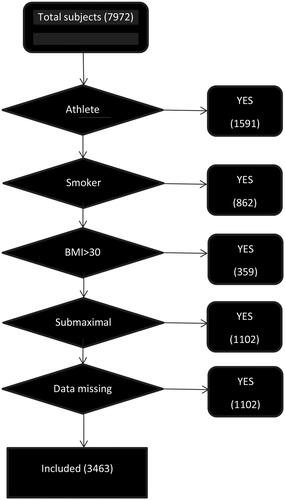
Apparently, healthy Dutch/Flemish subjects aged 20–60 were included in this study. To be included, subjects [Citation1] had no known physically impairing disease. Excluded were (1) known elite athletes, (2) smokers, (3) participants with BMI exceeding 30 and (4) participants who did not perform a maximum effort (computed as a minimum of 85% of the predicted maximum heart rate (208 − (0.7 × age)) [Citation13] and a respiratory exchange ratio (RERpeak) of >1.0) [Citation14]. A summary of the subject characteristics is given in and data inclusion in .
Table 1. Characteristics of the study group.
Table 2. Summary of peak exercise data in men and woman.
Testing protocol
Only tests performed on an electromagnetically braked cycle ergometer were used for this analysis. Cycle ergometers were from different manufacturers (Lode BV, Groningen, Netherlands, and Ergoline, Bitz, Germany). Treadmill tests were excluded, since they give no valid estimate of WRpeak [Citation15,Citation16].
Individually adjusted incremental ramp protocols were used to achieve the maximum WRpeak and corresponding VO2peak as measured with a calibrated respiratory gas-analysis system. Respiratory gas-analysis systems were from different manufacturers (Cortex Metalyzer, Leipzig, Germany; Carefusion, Hoghberg, Germany; Geratherm, Bad Kissingen, Germany; Cosmed, Rome, Italy; Medisoft, Sorrines, Belgium). All centres calibrated their equipment before every test.
Comparison with other RV studies
Although study characteristics and subject groups differ, a comparison with other studies is useful to put our data in international context. A comparison was made using optimum height–weight values as provided by Wasserman et al. [Citation17].
Statistical analysis
Statistical analysis was performed using SPSS version 24 (IBM Corp., Released 2016, IBM SPSS Statistics for Windows, Version 24.0, Armonk, NY). The correlation between WRpeak and VO2peak was analysed using univariate linear regression analysis. Determinants of WRpeak were identified using a univariate regression analysis. p Values below .05 were considered to be significant. Significant values were used in a multivariate regression analysis.
Reference values were generated using the LMS method (LMS Chartmaker Pro program™). This method summarises the distribution of the data as it changes via three curves representing the Box–Cox power (L), median (M), and coefficient of variation (S). The curves were fitted as cubic splines by non-linear regression using the penalised likelihood method. Each percentile graph was represented in function of Wpeak. Curves representing the percentiles of P3, P10, P25, P50, P75, P90 and P97 are used to show the mean and the upper and lower bounds normal range of the RVs.
Results
Subject characteristics
Data from 2868 apparently healthy males and 595 apparently healthy females were included (). As expected, men had a significantly higher body weight, height and BMI. A summary of peak data recorded from the exercise tests is given in .
Figure 1. Flowchart of included subjects.
Rpeak and VO2peak
VO2peak and WRpeak were highly associated. For males, Pearson’s correlation was 0.9 (p = .001), and the adjusted R2 obtained through simple linear regression analysis was 0.82, with a standard error of the estimate (SEE) of 23.4, and a F value of 13,167. For females, Pearson’s correlation was also 0.9 (p = .001), and the adjusted R2 0.83, SEE 17.3, F-value 2787. WRpeak/kg and VO2peak/kg were identically associated.
Effect of age, weight, height, HRmax, RER on WRpeak and WRpeak/kg
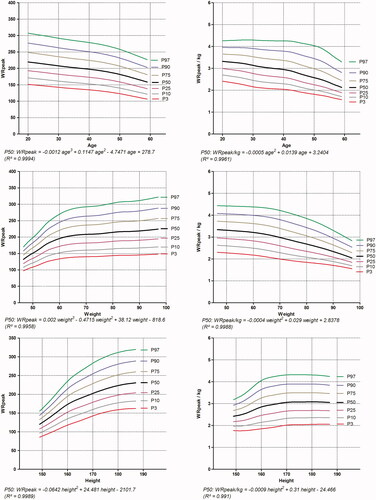
Univariate linear regression analysis showed a positive significant effect (p = .001) of weight, height, HRpeak, RERpeak and a negative significant effect of age, in both males and females. The effect of age, weight, height on WRpeak and WRpeak/kg with corresponding centiles are depicted in and .
Figure 2. Reference values for WRpeak and WRpeak/kg for male subjects.
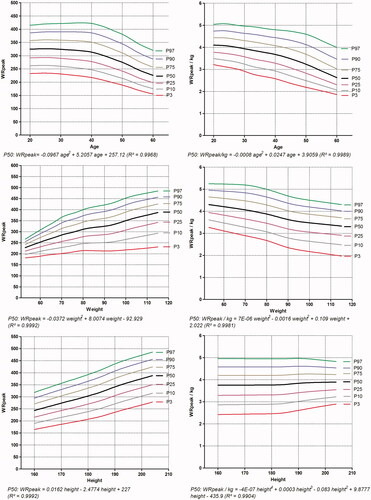
Figure 3. Reference values for WRpeak and WRpeak/kg for female subject.
Reference values
Gender, age, weight and height were highly predictive for WRpeak. These biometrical data are easy to obtain in clinical practice, and therefore very useful for RV. Multiple regression analysis gives for WRpeak an adjusted R2 of 0.57 (SEE 44.2, F value 1121.7). For WRpeak/kg, an adjusted R2 of 0.40 (SEE 0.54, F value 583.2) was observed.
The following formulas were developed:
(WRpeak: W, weight: kg, height: cm, age: years, sex: female: 1, male: 0).
Intern validation
A Bland–Altman plot [Citation18] was made to validate the formula for predicted WRpeak. The result of the one sample t-test of the difference and the logarithmic difference is significant, which points out the lower predictive values at the extremes of WRpeak.
Cross validation
Additional data not included in the primary analysis from National Diving Center in the Netherlands were used to perform a cross validation. The sample consisted of 3323 test in 3218 males and 105 females. Paired samples t-test of the predicted WRpeak and the measured WRpeak shows a mean difference of 28.2 W and a correlation of 0.65 (p < .001).
Comparison with other RV studies
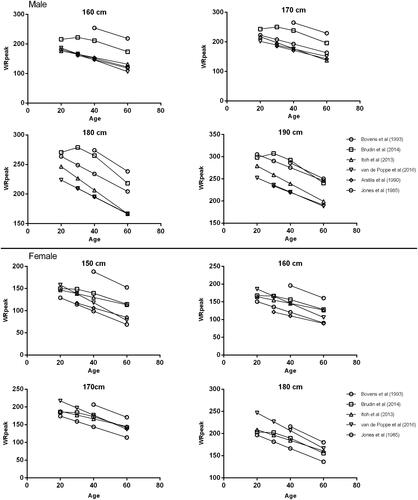
gives an overview of RV studies containing >100 participants each gender [Citation6,Citation7,Citation11,Citation12,Citation19].
Figure 4. Comparison of current reference values with other RV studies.
Discussion
The aim of this study was to investigate the potential of measuring WRpeak as substitute for VO2peak in determining cardiorespiratory fitness in apparently healthy Dutch/Flemish subjects. The second aim was to provide RV for WRpeak and WRpeak/kg in an apparently health Dutch/Flemish working population.
Data from a large cohort apparently healthy individuals aged 20–60, separated by gender were included. VO2peak and WRpeak were highly associated (adjusted R2>0.82). This indicates that WRpeak is an attractive alternative for VO2peak in this population, since WRpeak needs less sophisticated equipment as needed for the measurement of VO2peak. However, one should be careful to apply this method in clinical populations, since the relationship between WR and VO2 might be altered in for example patients with heart failure [Citation20]. In these clinical populations, cardiorespiratory fitness might then be overestimated from WRpeak.
In the multiple regression analysis, height, weight and age contributed roughly equally to the final model. However, this may vary between different ethnicities and study populations. Cross-validation of the model in a separate population gave a correlation of 0.65, and the mean predicted WRpeak was 28 W beyond the measured WRpeak, which is less than 10% difference. This equation can be used in the clinic to predict the WRpeak of a subject before the start of a test. As a rule of the thumb, we recommend to divide the number by 10, giving the increments per minute.
Our results are comparable with the results of Itoh et al. and Arstila et al. [Citation11,Citation12]. As expected, the RV of Bovens et al. [Citation7] exceed our RV, since they included athletes in their study. The values of Brudin et al. [Citation6] are also higher, likely due to the study design, where tests from unhealthy participants with data considered normal by a trained physiologist are included. Furthermore, it is known that Scandinavians are one of the most highly fit populations in the world. Therefore, it is reasonable to assume that there is a selection bias in their group towards more fit subjects.
To our knowledge, the current study is the largest study to generate RVs for cycle ergometry. The large population makes it possible to provide robust RV for WRpeak values in a Dutch healthy adult population. Data collected from mandatory health checks among different professions are used, which gives a good representation of the Dutch population, without the selection bias where healthier participants are more likely to take part in health checks. Furthermore, cross-validation confirmed the reliability of the reverence values in the Dutch population.
This study has some limitations. At first, data are used from people of different professions which presumably may have a different cardiorespiratory fitness than the general Dutch population (e.g. police officers, divers, military persons). This may have influenced the results. Furthermore, data from only 595 women are used to compute RV for females, which may give less accurate RV. Finally, the participating centres have used different incremental protocols, which may have altered the WRpeak.
However, the developed formulas and charts with corresponding centiles provide RV values for clinical decision making. Predicted WRpeak values are useful to adjust the increment rates of watts, to optimise the test to the preferable length of 10 minutes. Our RV can be used to interpret the result of a maximum ergometer test.
Conclusions
WRpeak can be used as a substitute for VO2peak when a respiratory gas-analysis system is not available. The current RV for WRpeak provides the necessary standard for clinical interpretation of the WRpeak results in the Dutch/Flemish working-age population. Further research is needed to obtain RV values for different ethnicities and elderly subjects.
Acknowledgements
We would like to thank the collaborating centres for providing the anonymous exercise testing data. Also the help of Evi Blezer BSc and Marc Doornbos BSc is kindly acknowledged.
The Low-Lands Fitness Registry Study Group consists of: Harriet Wittink PhD, Marcel Schmitz MSc, Pieter-Jan van Ooi MD, Geert van Beek MSc, Leendert van Galen MSc, Jeroen Molinger MSc, Robert Rozenberg MD, Marieke van den Oord PhD, Yvonne Hartman PhD, Nicolle Verbaarschot MSc, Aernout Snoek MD, Jaap Stomphorst MD, Joep van Kesteren MSc.
Disclosure statement
No potential conflict of interest was reported by the authors.
Related Research Data
References
- Al Rifai M, Patel J, Hung RK, et al. Higher fitness is strongly protective in patients with family history of heart disease: the FIT project. Am J Med. 2017;130:367?371.
- Sung J, Cho SJ, Choe YH, et al. Relationship between aerobic fitness and progression of coronary atherosclerosis. Heart Vessels. 2016;31:1418–1423.
- Ross R, Blair SN, Arena R, et al. Importance of assessing cardiorespiratory fitness in clinical practice: a case for fitness as a clinical vital sign: a scientific statement from the American Heart Association. Circulation. 2016;134:e653?e699.
- Paap D, Takken T. Reference values for cardiopulmonary exercise testing in healthy adults: a systematic review. Expert Rev Cardiovasc Ther. 2014;12:1439–1453.
- Ascoop CA, van Zeijl LG, Pool J, et al. Cardiac exercise testing. Indications, staff, equipment, conduct and procedures. Neth J Cardiol. 1989;2:63–72.
- Brudin L, Jorfeldt L, Pahlm O. Comparison of two commonly used reference materials for exercise bicycle tests with a Swedish clinical database of patients with normal outcome. Clin Physiol Funct Imaging. 2014;34:297–307.
- Bovens AM, van Baak MA, Vrencken JG, et al. Maximal aerobic power in cycle ergometry in middle-aged men and women, active in sports, in relation to age and physical activity. Int J Sports Med. 1993;14:66–71.
- Hakola L, Komulainen P, Hassinen M, et al. Cardiorespiratory fitness in aging men and women: the DR's EXTRA study. Scand J Med Sci Sports. 2011;21:679–687.
- Farazdaghi GR, Wohlfart B. Reference values for the physical work capacity on a bicycle ergometer for women between 20 and 80 years of age. Clin Physiol. 2001;21:682–687.
- Wohlfart B, Farazdaghi GR. Reference values for the physical work capacity on a bicycle ergometer for men – a comparison with a previous study on women. Clin Physiol Funct Imaging. 2003;23:166–170.
- Arstila M, Impivaara O, Mäki J. New ergometric reference values for clinical exercise tests. Scand J Clin Lab Invest. 1990;50:747–755.
- Itoh H, Ajisaka R, Koike A, et al. Heart rate and blood pressure response to ramp exercise and exercise capacity in relation to age, gender, and mode of exercise in a healthy population. J Cardiol. 2013;61:71–78.
- Tanaka H, Monahan KD, Seals DR. Age-predicted maximal heart rate revisited. J Am Coll Cardiol. 2001;37:153–156.
- Guazzi M, Adams V, Conraads V, et al. EACPR/AHA Joint Scientific Statement. Clinical recommendations for cardiopulmonary exercise testing data assessment in specific patient populations. Eur Heart J. 2012;33:2917–2927.
- Miyamura M, Honda Y. Oxygen intake and cardiac output during treadmill and bicycle exercise. J Appl Physiol. 1972;32:185–188.
- Miles DS, Critz JB, Knowlton RG. Cardiovascular, metabolic, and ventilatory responses of women to equivalent cycle ergometer and treadmill exercise. Med Sci Sports Exerc. 1980;12:14–19.
- Wasserman K, Hansen JE, Sue DY, et al. Principles of exercise testing and interpretation: including pathophysiology and clinical applications. 5th ed. Philadelphia (PA): Wolters Kluwer Health/Lippincott Williams & Wilkins; 2012.
- Bland JM, Altman DG. Measuring agreement in method comparison studies. Stat Methods Med Res. 1999;8:135–160.
- Jones NL, Makrides L, Hitchcock C, et al. Normal standards for an incremental progressive cycle ergometer test. Am Rev Respir Dis. 1985;131:700–708.
- Liu WH, Luo Q, Liu ZH, et al. Differences in exercise capacity in patients with chronic left heart failure and chronic right heart failure. Heart Lung Circ. 2014;23:1036–1040.

