

Abstract
Background
The objective of this evaluation was to determine the analytical and clinical performance of the AFIAS point-of-care (POC) Tn-I Plus assay (Boditech Med Inc).
Design and methods
Limit of detection (LOD), limit of quantification (LOQ), repeatability, reproducibility, inter- and intra-individual CV were evaluated using the CLSI guidelines. The study was also designed to estimate the 99th percentile upper reference limit (URL) and to assess the diagnostic sensitivity and specificity.
Results
The precision repeatability CVs were 6.7–8.5% and reproducibility was 7.5–7.6%. The LOD and LOQ were consistent with the manufacturer’s specified values of 0.010 ng/mL and 0.030 ng/mL, respectively. The 99th percentile URLs for males (aged 18–75 years) and females (aged 17–65 years) in serum were 0.0300 ng/mL (7.8% CV) and 0.0239 ng/mL (9.4% CV) respectively. Overall 99th percentile URL was 0.0296 ng/mL (8.2% CV). For the overall apparently healthy population, the percentage of measurable cardiac troponin I (cTn-I) values below the 99th percentile (i.e. 0.0296 ng/mL) and above the assay’s LOD (= 0.010 ng/mL) was 47,68% (391/820 samples). The diagnostic sensitivity and specificity were 100% with 95% CI (97% − 100%) and 95.2% with 95% CI (93.6% − 96.5%), respectively. No significant differences were observed for the diagnosis of acute myocardial infarction (AMI) between AFIAS Tn-I plus and Abbott ARCHITECT High Sensitive Troponin-I.
Conclusion
The clinical performance of AFIAS Tn-I Plus assay for AMI is comparable to the established Abbott ALINITY STAT High Sensitive Troponin-I. This assay is suitable for routine use in clinical laboratories.
1. Introduction
Cardiac troponin I (cTn-I) is a protein released during cardiac muscle damage who plays a critical role as a key marker for identifying heart-related issues, especially acute myocardial infarction (AMI) [Citation1,Citation2]. In the field of in vitro diagnostics, troponin measurement enables timely and accurate diagnosis, risk stratification, and monitoring of patients with suspected or confirmed heart conditions such as AMI. This biomarker’s detection and quantification contribute to effective patient management and treatment decisions, ultimately improving patient outcomes and overall cardiovascular care [Citation3].
Recently, different high sensitivity cTn-I assays presenting lower detection limits have been introduced and adopted in clinical settings. Enhanced assay sensitivity now enables the precise quantification of extremely low troponin concentrations, facilitating the use of more lenient diagnostic thresholds. This plays a key role in quickly determining whether to include or exclude patients, a critical issue in clinical practice [Citation4]. For the diagnosis of AMI, rapid cTn-I testing and timely reporting of results are essential. In emergency situations, there are instances where troponin results need to be confirmed in a shorter timeframe than the turnaround time (TAT) of central laboratory cTn-I assays [Citation5]. In such cases, cTn-I can be tested using point-of-care (POC) devices. POC testing offers the advantage of being performed at the patient’s bedside, allowing users to directly assess the results. This can significantly reduce the time required for medical decision-making compared to results obtained from central laboratory testing [Citation6,Citation7].
In the present study, we evaluated a small, automated POC troponin I assay (AFIAS Tn-I Plus, Boditech Med, South Korea.), which is compact size as well as swift turnaround time in producing results. Particularly, the goal of this study was to evaluate the clinical performance of the AFIAS Tn-I Plus assay and demonstrate that its performance was comparable to the existing large, automated device used in our central laboratory (ALINITY High Sensitive Troponin-I, Abbott), fulfilling the criteria for clinical applicability.
2. Materials and methods
2.1. Study design and population
This study is an observational study to determine the performance of the AFIAS TN I plus assay. It was performed on patient residual serum samples collected between November 2022 and June 2023 at the Department of Clinical Chemistry, CHU de Liège in Belgium.
For the reference range study, following residual serum samples from apparently healthy men and women were tested: 410 samples from women (aged 17-65 years) and 410 samples from men (aged 18–75 years). All samples were collected from a European population without kidney disease (as defined by normal serum creatinine concentrations). All experimental procedures and protocols used in this investigation, were reviewed and approved by the Ethics Committee of the University of Liège (Belgium) (number B70720095522).
To evaluate the performance of the AFIAS Tn-I Plus assay, 517 clinical samples were tested with the AFIAS Tn-I Plus assay. Samples were selected based on the patient’s cTn-I value and the patient’s medical condition. Abbott ALINITY STAT High Sensitive Troponin-I reference test results for all samples were available.
The following samples were tested: 20 baseline (= day 0) samples from patients suggestive of AMI and diagnosed STEMI/non-STEMI, 104 follow-up (= not day 0) samples from patients suggestive for AMI diagnosed STEMI/non-STEMI, 75 baseline (= day 0) samples from patients for whom a troponin has been requested non-diagnosed AMI but diagnosed with other cardiovascular pathologies, 277 follow up (= not day 0) samples from patients for whom a troponin has been requested non-diagnosed AMI but diagnosed with other cardiovascular pathologies, 13 baseline (= day 0) samples collected from non-cardiac patients, 28 follow up (= not day 0) samples from non-cardiac patients.
Samples were stored at 2-8 °C for a maximum of 24 h or at ≤ −20 °C for a maximum of 3 months after collection and were only subjected to one frozen/thawed cycle before testing. The assay systems used were Abbott ALINITY STAT High Sensitive Troponin-I and Boditech AFIAS Tn-I Plus.
2.2. AFIAS Tn-I plus assay
AFIAS Tn-I Plus is an automated fluorescence immunoassay (FIA) with an all-in-one cartridge system. It is used for the quantitative determination of cTn-I levels in human whole blood/serum/plasma on the AFIAS-6 instrument. It presents a fast turnaround time (12 min) thanks to an integrated (sample-to-answer) system with 6 parallel tests for different parameters. The manufacturer’s stated working range is 0.010 ng/mL to 15.00 ng/mL. They evaluated the upper reference limit (URL) (99th percentile) for cTn-I in 70 Korean patients and found a value of 0.04 ng/mL. At 0.3 ng/mL, the sensitivity is 91% and the specificity is 92.1%.
2.3. Abbott ALINITY STAT high sensitive troponin-I
The Abbott ALINITY STAT High Sensitive Troponin-I assay is a microparticle chemiluminescence immunoassay (CMIA) used for the quantitative determination of cTn-I in human plasma and serum on the ALINITY i analyser. The measuring range for the Abbott ALINITY STAT High Sensitive Troponin I Assay is 0.01 to 50 ng/mL. The reported limit of blank (LOB), limit of detection (LOD) and limit of quantification (LOQ) are 0.000 to 0.001, 0.001 to 0.002 and 0.004 to 0.005, respectively. The analysis was performed using 3 lots of the ALINITY i STAT High Sensitive Troponin-I Reagent Kit on 2 analysers each for a minimum of 3 days. The reported URL (99th percentile) for cTn-I in 764 women and 766 men was 15.6 ng/L and 34.2 ng/L, respectively. For the initial test at admission, the calculated sensitivity is 87.3% and specificity is 85.5%. The analysing time is around 15 min.
2.4. Assessment of the analytical performance
2.4.1. Precision
Precision testing was performed based on the CLSI EP05-A3. The precision of the method was evaluated using the low, medium and high levels of cTn-I controls. The concentrations were 0.23 ng/mL, 0.94 ng/mL, and 7.50 ng/mL respectively. For repeatability, each concentration level was measured two times per day for twenty days. For each test, each material was duplicated. For the reproductibility, the AFIAS Tn-I Plus was tested for five days in three different sites. Each standard material was tested once per day and five replicates per day.
2.4.2. LOD and LOQ
The LOD assessment was conducted according to CLSI EP17-A2 using three lots of reagents to measure four low-concentration samples, five times per day over a period of three days. A total of fifteen measurements per each sample was taken from each lot to carry out the LOD test, and the LOD was calculated using the formula, LOD = LOB (0.004 ng/mL) + cp*SDL. The largest calculated LOD value among each lot was selected for the LOD.
The LOQ was also assessed based on CLSI EP17-A2 using three lots of reagents to measure five samples, four times per day over a period of three days. A total of twelve measurements per sample were taken, and the total error (TE, %) was calculated. TE (%) = (|Bias|+2SD)/Concentration (ng/mL) ×100. The concentration that meets the criteria is established as the LOQ.
2.4.3. Reference range study
The determination of the reference range was performed according to CLSI EP28-A3c and the recommendations of Sandoval et al. [Citation8]. Data analysis was performed using Analyse-it software version 6.15. Data were visualised using histograms for the total apparently healthy population and for both subgroups (i.e. male/female). Outliers were identified using the Tukey method. The 99th percentile URL was calculated using both the non-parametric bootstrap method (i.e. Harrell-Davis method) and the robust method for both the total population and the two subgroups.
In addition, the percentage of measurable cTn-I values above the LoD (set as 0.010 ng/mL) in the reference population tested was determined.
2.4.4. Method comparison
A total of 460 serum samples (cTn-I from 0.010 ng/mL to 15.00 ng/mL) were analysed on the AFIAS Tn-I Plus and Abbott ALINITY analysers. The cTn-I results obtained with the AFIAS Tn-I Plus were compared with the Abbott ALINITY. Passing-Bablok regression and Pearson’s correlation coefficient test were used to further analyse the results.
2.4.5. Diagnostic accuracy
Diagnostic sensitivity and specificity have been assessed using the previously determined 99th percentile as the cut-off.
The diagnostic performance of the AFIAS Tn-I Plus assay using the overall 99th percentile as cut-off was calculated. In addition, the percent agreement compared with the reference assay was determined. Results at or below the 99th percentile of the respective assays, were scored as negative while results above the 99th percentile cut-off were scored as positive.
2.5. Statistical analysis
The Analyse-it v06.15 software was used for statistical analysis.
3. Results
3.1. Precision
Repeatability and reproducibility CVs for low, medium, and high concentration cTn-I standards in the AFIAS Tn-I Plus precision study were calculated and are summarised in .
Table 1. Precision study of the AFIAS Tn-I plus assay.
3.2. LOD and LOQ
The determined values for LOD and LOQ were consistent with those specified by the manufacturer: 0.010 ng/mL for LOD and 0.030 ng/mL for LOQ.
3.3. 99th percentile
The 99th percentile was determined to be 0.0296 ng/mL, 0.0300 ng/mL and 0.0239 ng/mL for the total, male and female population respectively. All calculated URLs at the 99th percentile are summarised in .
Table 2. 99th percentile upper reference limit (URL) and confidence interval – overall apparently healthy population and subgroups.
The precision (%CV) at the 99th percentile is reported in .
Table 3. Precision at the 99th percentile upper reference limit (URL).
For the overall apparently healthy population, the percentage of measurable cTn-I values below the 99th percentile (i.e. 0.0296 ng/mL) and above the assay’s LOD (= 0.010 ng/mL) was 47,68% (391/820 samples).
3.4. Method comparison
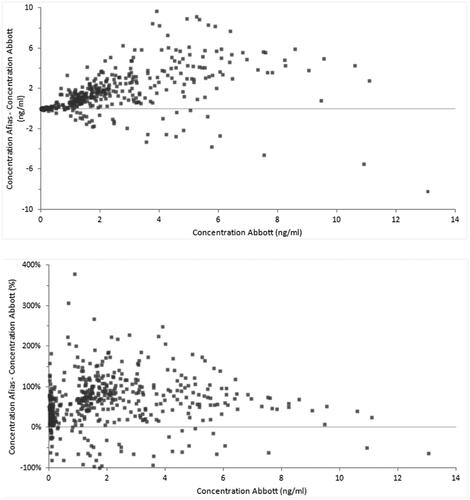
A method comparison study according to CLSI EP09 A3 guidelines was performed on a total of n = 460 samples, covering the common measuring interval of both assays (i.e. 0.010 ng/mL to 15.00 ng/mL). The Bland Altman absolute and relative difference plots are provided in .
Figure 1. Absolute (A) and relative (B) difference plots when comparing the Abbott ALINITIY high Sensitive Troponin-I assay and the AFIAS Tn-I plus assay.
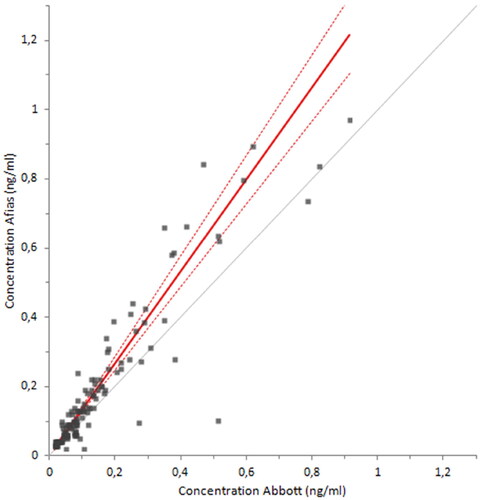
A Passing-Bablok regression analysis was performed and the results are shown in . The Passing-Bablok regression (y = −0.05325 (95% CI (−0.08672 to −0.03542)) + 1.836 (95% CI (1.763 to 1.909))x) and Pearson’s r2 (0.741) show a poor agreement between the assays when considering the measuring range of 0.010 ng/mL to 15 ng/mL (). When performing the Passing-Bablok regression (y = 0.001529 (95% CI (−0.007322 to 0.0007467)) + 1.327 (95% CI (1.200 to 1.455))x) analysis on a reduced set of samples i.e. 0.010 ng/mL to 0.1 ng/mL (n = 129) (), the agreement between the assay’s improved with a Pearson’s r2 of 0.844 ().
Figure 2. Passing Bablok regression analysis to compare AFIAS Tn-I Plus and Abbott ALINITY High Sensitive Troponin-I on 460 clinical samples with values ranging from 0.010 ng/ml to 15 ng/ml.
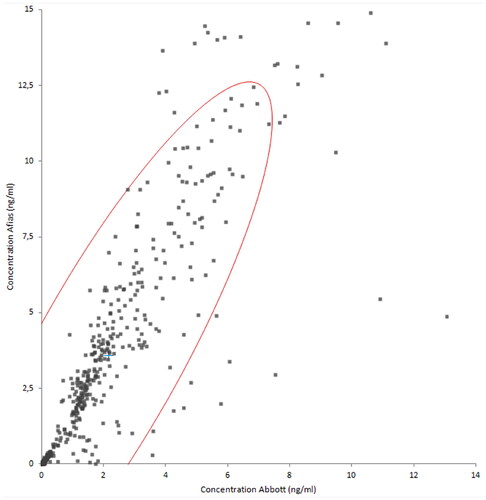
Figure 3. Pearson’s r correlation coefficient to compare AFIAS Tn-I Plus and Abbott ALINITY High Sensitive Troponin-I on 460 clinical samples with values ranging from 0.010 ng/ml to 15 ng/ml.
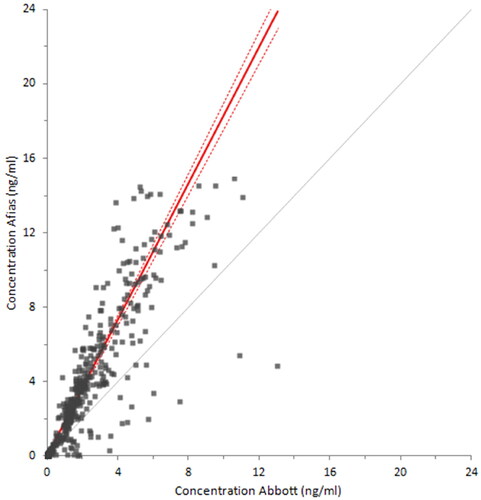
Figure 4. Passing Bablok regression analysis to compare AFIAS Tn-I Plus and Abbott ALINITY High Sensitive Troponin-I on 129 clinical samples with values ranging from 0.010 ng/ml to 0.1 ng/ml.
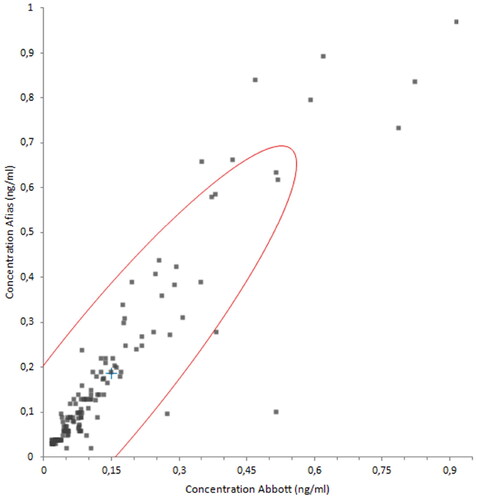
Figure 5. Pearson’s r correlation coefficient to compare AFIAS Tn-I Plus and Abbott ALINITY High Sensitive Troponin-I on 129 clinical samples with values ranging from 0.010 ng/ml to 0.1 ng/ml.
The percentage of agreement between the AFIAS Tn-I Plus assay and the Abbott ALINITY STAT High Sensitive Troponin-I assay was determined for all collected and tested samples.
Considering all suspected AMI samples diagnosed as STEMI/non-STEMI (n = 124), 100% agreement (124/124) was observed with a 95% CI 97.0%–100%. For all non-diagnosed AMI samples (n = 352), 96.9% (341/352) agreement with the reference assay was observed with a 95% CI 94.5%–98.2%. Although these were undiagnosed AMI samples, only eight samples had a result below the ALINITY URL cut-off (= 0.027 ng/mL). When evaluating the 41 samples tested from patients without cardiovascular pathology, the overall agreement between the two assays was 85.4% (35/41) with a 95% CI (71.6%-93.1%).
3.5. Diagnostic performance
The diagnostic sensitivity was determined on the total of 124 AMI diagnosed (STEMI/non-STEMI) samples. All samples were scored positive on the AFIAS Tn-I Plus assay resulting in a diagnostic sensitivity of 100% (124/124) with a 95% CI 97.0%–100.0%. When calculating the diagnostic sensitivity of the Abbott ALINITY assay on the same set of samples the diagnostic sensitivity was also determined to be 100% with a 95% CI 97.0%-100.0%.
The diagnostic specificity was determined on the healthy population (n = 820) and the non cardiac patients (n = 41). The calculated diagnostic specificity of the AFIAS Tn-I Plus assay assay for the tested samples is 95.2% with a 95% CI 93.6%-96.5%.
4. Discussion
In this study the AFIAS Tn-I Plus assay was compared to the Abbott ALINITY STAT High Sensitive Troponin-I assay, which is our routine method for cTn-I measurement. The AFIAS Tn-I Plus assay has good repeatability and reproducibility according to the results of this study.
The 99th percentile URLs and confidence intervals were calculated based on the 820 apparently healthy subjects. The 99th percentile was determined to be significantly different between men (0.0300 ng/mL − 95% CI 0.0253–0.0412 ng/mL) and women (0.0239 ng/mL − 95% CI 0.0208-0.0312 ng/mL) as shown in several studies [Citation9–12]. The percentage of measurable cTn-I values below the 99th percentile (i.e. 0.0296 ng/mL) and above the assay’s LOD (= 0.010 ng/mL) was 47.68% (391/820 samples) and the CV% at the 99th percentile are all <10% as required by international guidelines [Citation13–15]. According to Apple’s proposed scorecard [Citation16], the AFIAS Tn-I Plus assay can be considered as a contemporary guideline acceptable assay. It should be noted that our assay method is on the verge of being considered highly sensitive. Indeed, according to the Apple et al. scorecard [Citation16], the percentage of measurable cTn-I values below the 99th percentile and above the assay’s LOD must be > 50% to be considered a high-sensitivity method for cTn-I measurement.
When we compared our results between the two methods, we observed systematic differences, as reported in many studies [Citation17–20]. This is in part explained by the current lack of standardisation of the different cTn-I measurement methods by using different monoclonal antibodies, specific for different epitopes of cTn-I [Citation21]. However, from a clinical point of view, the results of our two methods show a high degree of agreement. This was particularly the case for patients with AMI and patients without AMI but with other heart disease.
This study may have some limitations. In contrast to most studies about troponin assay methods, our selection of patients was based on those with troponin values above the 99th percentile after an assay performed on Abbott ALINITY analysers, regardless of whether they had chest pain or not. This explains the high number of patients without AMI but with elevated cTn-I. Our study could be complemented by a study in an emergency department (ED) about patients with chest pain to avoid the selection bias present in this study, which would allow the sensitivity and specificity of this test to be more accurately assessed. These limitations must be balanced against the great analytical and clinical performance of this instrument, which is also very easy to use. Thanks to its specifications, the AFIAS Tn-I Plus assay will reduce the turnaround time for cTn-I results, but it will also enable triage to safely rule out and accurately rule in AMI in the majority of patients presenting to the ED with chest pain.
In conclusion, our results indicate that the analytical and clinical performance of the AFIAS Tn-I Plus assay for AMI is comparable to the established Abbott ALINITY STAT High Sensitive Troponin-I assay, in accordance with international guidelines. This assay is suitable for routine use in clinical laboratories or emergency departments.
Acknowledgments
The authors thank Boditech for providing the instrument and reagents for the evaluation of the AFIAS Tn-I Plus assay.
Disclosure statement
No potential conflict of interest was reported by the author(s).
Correction Statement
This article has been corrected with minor changes. These changes do not impact the academic content of the article.
Additional information
Funding
References
- Chapman AR, Adamson PD, Shah ASV, et al. High-sensitivity cardiac troponin and the universal definition of myocardial infarction. Circulation. 2020;141(3):161–171. doi: 10.1161/CIRCULATIONAHA.119.042960.
- Sandoval Y, Apple FS, Mahler SAet al. High-sensitivity cardiac troponin and the 2021 AHA/ACC/ASE/CHEST/SAEM/SCCT/SCMR guidelines for the evaluation and diagnosis of acute chest pain. Circulation. 2022;146(7):569–581. doi: 10.1161/CIRCULATIONAHA.122.059678.
- Collet JP, Thiele H, Barbato E, et al. Management of acute coronary syndromes in patients presenting without persistent ST-segment elevation. Eur Heart J. 2021;42(14):1289–1367. doi: 10.1093/eurheartj/ehaa575.
- Byrne RA, Rossello X, Coughlan JJ, et al. 2023 ESC guidelines for the management of acute coronary syndromes. Eur Heart J. 2023;44(38):3720–3826.
- Hight M, Conklin K, Archer B, et al. Implementing point-of-care troponin testing in the emergency department: impact on time to result. J Emerg Nurs. 2021;47(2):299–304. doi: 10.1016/j.jen.2020.06.014.
- Boeddinghaus J, Nestelberger T, Koechlin L, et al. Early diagnosis of myocardial infarction with point-of-care high-sensitivity cardiac troponin I. J Am Coll Cardiol. 2020;75(10):1111–1124. doi: 10.1016/j.jacc.2019.12.065.
- Cullen L, Collinson PO, Giannitsis E. Point-of-care testing with high-sensitivity cardiac troponin assays: the challenges and opportunities. Emerg Med J. 2022;39(11):861–866. doi: 10.1136/emermed-2021-211907.
- Sandoval Y, Apple FS. The global need to define normality: the 99th percentile value of cardiac troponin. Clin Chem. 2014;60(3):455–462. doi: 10.1373/clinchem.2013.211706.
- Collinson P, Aakre KM, Saenger A, et al. Cardiac troponin measurement at the point of care: educational recommendations on analytical and clinical aspects by the IFCC committee on clinical applications of cardiac Bio-Markers (IFCC C-CB). Clin Chem Lab Med. 2023;61(6):989–998. doi: 10.1515/cclm-2022-1270.
- Apple FS, Wu AHB, Sandoval Y, et al. Sex-specific 99th percentile upper reference limits for high sensitivity cardiac troponin assays derived using a universal sample bank. Clin Chem. 2020;66(3):434–444. doi: 10.1093/clinchem/hvz029.
- Apple FS, Schulz K, Schmidt CW, et al. Determination of sex-specific 99th percentile upper reference limits for a point of care high sensitivity cardiac troponin I assay. Clin Chem Lab Med. 2021;59(9):1574–1578. doi: 10.1515/cclm-2021-0262.
- McEvoy JW, Tang O, Wang D, et al. Myocardial injury thresholds for 4 High-Sensitivity troponin assays in U.S. Adults. J Am Coll Cardiol. 2023;81(20):2028–2039. doi: 10.1016/j.jacc.2023.03.403.
- Thygesen K, Alpert JS, Jaffe AS et al. Fourth universal definition of myocardial infarction (2018). Circulation. 2018;138(20):e618–e651. doi: 10.1161/CIR.0000000000000617.
- Wu AHB, Christenson RH, Greene DN, et al. Clinical laboratory practice recommendations for the use of cardiac troponin in acute coronary syndrome: expert opinion from the academy of the American association for clinical chemistry and the task force on clinical applications of cardiac bio-markers of the international federation of clinical chemistry and laboratory medicine. Clin Chem. 2018;64(4):645–655. doi: 10.1373/clinchem.2017.277186.
- Aakre KM, Saenger AK, Body R, et al. Analytical considerations in deriving 99th percentile upper reference limits for high-sensitivity cardiac troponin assays: educational recommendations from the IFCC committee on clinical application of cardiac Bio-Markers. Clin Chem. 2022;68(8):1022–1030. doi: 10.1093/clinchem/hvac092.
- Apple FS. A new season for cardiac troponin assays: it’s time to keep a scorecard. Clin Chem. 2009;55(7):1303–1306. doi: 10.1373/clinchem.2009.128363.
- IFCC Committee on Clinical Applications of Cardiac Bio-Markers (C-CB). High Sensitivity Cardiac Troponin I and T Assay Analytical Characteristics Designated by Manufacturer. https://www.ifcc.org/media/479435/high-sensitivity-cardiac-troponin-i-and-t-assay-analyticalcharacteristics-designated-by-manufacturer-v052022.pdf. (accessed August 24, 2023).
- IFCC Committee on Clinical Applications of Cardiac Bio-Markers (C-CB). High Sensitivity Cardiac Troponin I and T Assay Analytical Characteristics Designated by Manufacturer. https://ifcc.web.insd.dk/media/479438/point-of-care-cardiac-troponin-i-and-t-assay-analytical-characteristics-designated-by-manufacturer-v052022.pdf. (accessed August 24, 2023).
- Hasselbalch RB, Kristensen JH, Jørgensen N, et al. High incidence of discrepancies in new siemens assay - a comparison of cardiac troponin I assays. Clin Chem Lab Med. 2022;60(6):921–929. doi: 10.1515/cclm-2022-0034.
- Masotti S, Musetti V, Prontera C, et al. Evaluation and comparison with other high-sensitivity methods of analytical performance and measured values of a new laboratory test for cardiac troponin I assay. J Appl Lab Med. 2021;6(5):1237–1250. doi: 10.1093/jalm/jfab017.
- Tate JR, Bunk DM, Christenson RH, et al. Evaluation of standardization capability of current cardiac troponin I assays by a correlation study: results of an IFCC pilot project. Clin Chem Lab Med. 2015;53(5):677–690. doi: 10.1515/cclm-2014-1197.

