
Abstract
Objective: To experimentally investigate the effects of increased masticatory muscle function on the transverse cranial dimensions on adult rats with an earlier reduced masticatory muscle function.
Material and method: Sixty young male rats were used. The experimental group received soft diet for a prolonged period, so that the animals developed weak masticatory muscles. A control group received ordinary hard food during the whole experimental period (27 weeks). After 21 weeks when the animals had nearly ceased their body growth the rats in the experimental group were divided into two groups. One group continued with soft diet until the end of the experiment (hypofunctional group). The other group received ordinary hard food to get the possibility to retrain their masticatory muscles (rehabilitation group). At week 21 and at the end of the experimental period (week 27), axial cephalograms were taken. Fourteen landmarks were defined to measure seven transverse distances of the skull.
Results: The increase of the anterior zygomatic arch width and interzygomatic width during the experimental period were larger in the rehabilitation group compared to both the normal and the hypofunctional group.
Conclusion: Retraining of masticatory muscles in adult rats leads to increase of some transverse cranial dimensions.
Introduction
Clinical and experimental studies indicate that masticatory muscles influence the craniofacial growth in young individuals. Pepicelli et al. [Citation1] concluded in their review that persons with strong or thick mandibular muscles have wider transverse craniofacial dimensions and a tendency toward parallelism between the jaw bases and between the occlusal and mandibular planes. Similarly, animal experimental studies demonstrated that growing rats fed a soft diet developed weak masticatory muscles and had a more orthocranial position of the viscerocranium with reduced growth of the gonial angle than a control group with normal masticatory muscle function [Citation2]. Furthermore, it was found by Katsaros et al. [Citation3] that changes in masticatory muscle function also affects the transversal growth of the skull especially in areas under direct masticatory muscle influence, as the sites of the masseter muscle attachments.
Edentulism in adults leads to a reduction of the masticatory muscle function and changes in the morphology [Citation4]. And vice versa, after rehabilitation, edentulous adults with implant retained bridges improve their masticatory muscle strength and their chewing ability after treatment [Citation5,Citation6]. Furthermore, severe malocclusion leads to a reduced capacity of the masticatory muscle function [Citation7] and often after orthognathic surgical treatment the masticatory muscle force and performance improves gradually towards the same level as for individuals without severe malocclusion [Citation8–10]. Animal experimental studies have shown that functional improvement of masticatory muscles in adult animals may influence the morphology of the mandible on the sagittal and vertical plane as well as the internal structure of the mandibular alveolar bone [Citation11,Citation12]. However, it is not yet known if this improvement of the masticatory function at adult age also influences the transverse dimension of the skull.
Our hypothesis is that retraining of masticatory muscles in adulthood may influence the transverse skull dimensions in rats that were exposed to reduced masticatory functional demands during growth.
The aim of this study was to experimentally investigate the effects of increased masticatory muscle function on the transverse cranial dimensions on adult rats with an earlier reduced masticatory muscle function.
Our null hypothesis is that there is no difference in the transverse dimensions between the animals with detrained or retrained masticatory muscles and their controls.
Material and methods
Material
Sixty male rats of the Sprague-Dawley strain (average age 21 days) from Charles River, Uppsala, Sweden were used. The experimental protocol was approved by the Ethical Committee of the University of Gothenburg.
Experimental design
The control group (16 rats) was fed with the ordinary food consisting of hard pellets (R34, Lactamin, Södertälje, Sweden) during the whole experimental period ().
Figure 1. Experimental design.
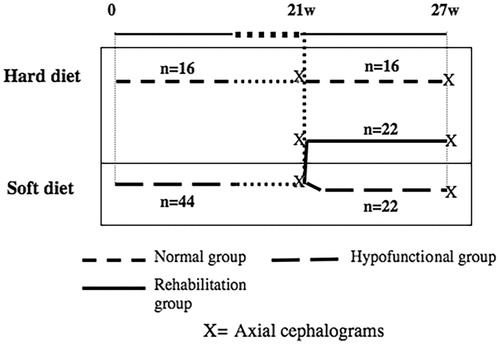
The experimental group was composed by forty-four rats that received soft diet, that is ordinary pellets mixed with water in standardized proportions (2:5, R34: water) so that the rats should develop weak masticatory muscles [Citation13].
The duration of the experimental period was 27 weeks and the rats were fed and watered ad libitum. During this time, the rats were weighed every second week. After 21 weeks, the rats in the experimental group were divided into two groups (22 rats in each), matched after weight. One group continued for 6 weeks with soft diet until the end of the experiment (denoted hypofunctional group until the end), while the other group received ordinary hard food and got a possibility to retrain their masticatory muscles (rehabilitation group).
At week 21 and at the end of the experimental period (week 27), axial cephalograms were taken with the skull fixed in a specially constructed cephalostat. At week 21, the rats were sedated by a mixture of Ketalar® (50 mg/ml. Warner Lambert Nordic AB, Solna, Sweden) and Rompun vet® (20 mg/ml. Bayer, Leverkusen, Germany). At week 27, the axial radiographs were taken after the rats were sacrificed. A standard dental X-ray machine was used at 50 kV and 10 mA; the time of exposure was 0.5 s for Kodak occlusal Ultra-speed film DF-50® (Eastman Kodak Co, Rochester, NY, USA). The focus to film distance was kept constant at 50 cm (a magnification of 5.4%). An identification number was attached to the film and reproduced at the radiograph. A standard length wire (10 mm) was also attached to and reproduced on the radiograph, and was later on used to calibrate the images. The radiographs were digitalized with a flatbed scanner (Agfa Arcus II; Agfa-Gevaert, Leverkusen, Germany) and stored as 8-bit grey scale image files.
Measurements on the axial cephalogram
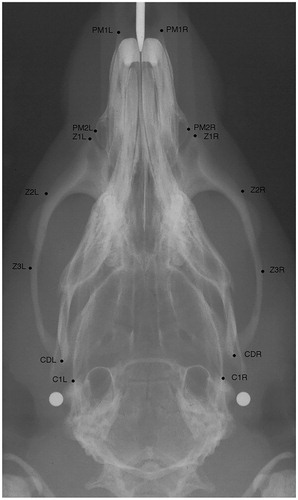
In order to measure the transverse dimensions of the skull, 14 points were identified to assess anatomic regions with different functional demands (). The points were then used to measure the anterior premaxillary width (PM1L-PM1R), the posterior premaxillary width (PM2L-PM2R), the anterior zygomatic width (Z1L-Z1R), the anterior zygomatic arch width (Z2L-Z2R), the interzygomatic width (Z3L-Z3R), the intercondylar width (CDL-CDR), and the posterior skull width (C1L-C1R).
Figure 2. Axial radiograph of the rat skull with the points used in this study.ViscerocraniumPM1L: most anterior and lateral point of left premaxillaPM1R: most anterior and lateral point of right premaxillaPM2L: most lateral point of left premaxillaPM2R: most lateral point of right premaxillaZ1L: most anterior point of the zygomatic process of the left maxillaZ1R: most anterior point of the zygomatic process of the right maxillaZ2L: anterior and lateral point of the zygomatic process of the left maxillaZ2R: anterior and lateral point of the zygomatic process of the right maxillaZ3L: most lateral point of the left Zygomatic arch.Z3R: most lateral point of the right Zygomatic arch.MandibleCDL: most lateral point of the left condyleCDR: most lateral point of the right condyleNeurocraniumC1L: point on the intersection between left squamosal bone and anterior edge of tympanic bulla.C1R: point on the intersection between right squamosal bone and anterior edge of tympanic bulla.
The cephalometric points were identified by one of the authors (A.Ö.). The cephalograms were blinded, i.e. it was not known to which group the cephalogram belonged to. The registrations were performed with the image analysis program NIH-Image version 1.61 PPC. (The updated version of NIH image is Image J. https://imagej.nih.gov/ij/)
During the study, we excluded cephalograms from three rats in the hypofunctional group due to wrong positioning of the rat in the cephalostat.
Statistical analysis
All data from week 21 and week 27 are represented as mean and standard deviation (mean ± SD). The cranial transverse dimensions of the control group and the experimental group were compared at week 21 and the control group, the hypofunctional group and the rehabilitation group were compared at week 27. The changes in transverse cranial dimensions between week 21 and week 27 in between the three groups were tested using the Analysis of Variance (ANOVA)
All statistical analyses were performed using the SPSS statistical package (SPSS 13 and 21); SPSS, Chicago, IL, USA). A result was considered statistically significant at p < 0.05.
Method error
Double measurements were performed on twelve radiographs 14 days later to evaluate the method error.
The magnitude of the combined method error was calculated according to Dahlberg´s formula Se=√∑d2/2n, where d is the difference between two registrations of a pair and n the number of the double registrations [Citation14]. The average random error was found to be between 0.02 and 0.05 mm. Paired t-tests were used between the two series of measurements to test for any systematic error; no statistically significant differences were found in this test.
Results
Bodyweight
No statistical significant differences in bodyweight were found at week 21 between the hypofunctional group (556 ± 63 g), the rehabilitation group (566 ± 78 g) and the control group (580 ± 63 g). Nor were any statistical significant differences found at the end of the experimental period, the mean body weight (±SD) for the hypofunctional group was 577 g (± 77 g), the rehabilitation group 584 g (± 87 g) and for the control group 619 g (± 70 g).
Cranial transverse dimensions at week 21
The posterior premaxillary width (PM2L–PM2R), the anterior zygomatic width (Z1L–Z1R) and the anterior zygomatic arch width (Z2L–Z2R) were narrower in the experimental group compared to the control group. ()
Table 1. Mean values and standard deviation (in brackets) of transversal dimensions of the rats’ skull at week 21 for the control and experimental group.
Cranial transverse dimensions at week 27
The differences that were detected between the control group and the hypofunctional group at week 21 were also detected at the end of the experimental period.
There were significant differences in three of the cranial transverse dimensions; the posterior premaxillary width (PM2L–PM2R), the anterior zygomatic width (Z1L–Z1R), and the anterior zygomatic arch width (Z2L–Z2R) between the three groups ().
Table 2. Mean values and standard deviation (in brackets) of the variables under study of transversal dimensions at week 27 for each of the control and experimental groups.
When comparing the hypofunctional group with the control group the premaxillary width (PM2L–PM2R), the anterior zygomatic width (Z1L–Z1R), and the anterior zygomatic arch width (Z2L–Z2R) were narrower.
In the hypofunctional group compared to the rehabilitation group, the anterior zygomatic arch width (Z2L–Z2R) was narrower. There were trends for similar differences for the interzygomatic width (Z3L–Z3R) and the intercondylar width (CDL–CDR) but they did not reach a statistical significant level. The anterior zygomatic arch width (Z2L–Z2R), the premaxillary width (PM2L–PM2R) and the anterior zygomatic width (Z1L–Z1R) were narrower in the rehabilitation group compared to the control group.
There were no statistically significant differences between the three groups concerning the posterior skull width (C1L–C1R).
Changes in transverse cranial dimensions
The increase of the anterior zygomatic arch width (Z2L–Z2R) and the interzygomatic width (Z3L–Z3R) during the experimental period were larger in the rehabilitation group compared to both the normal and the hypofunctional group ().
Table 3. Mean values and standard deviation (in brackets) of longitudinal changes of transversal dimensions in the period weeks 21–27 of what for each group
Discussion
In this investigation, the null hypothesis was that there was no difference in the transverse dimensions between the animals with detrained or retrained masticatory muscles and their controls under study. This null hypothesis was rejected for the posterior premaxillary width, the anterior zygomatic width, the anterior zygomatic arch width, and the interzygomatic width as differences were found between the three groups at those transverse cranial dimensions. Thus it was found that rehabilitation by retraining of the masticatory muscle function for 6 weeks in adult rats after a period of reduced function had a significant effect on some of the transverse cranial dimensions.
The differences in dimensions that were detected between the control group and the experimental group at week 21, when the rats had reached early adulthood, were also found at the end of the experimental period. This was expected since the experimental conditions in these two groups remained the same, because no changes in the diet of these two groups had occurred. Although no statistical significant differences were found in the anterior part of the premaxilla between the three groups, the posterior part of premaxilla was narrower in the hypofunctional and the rehabilitation groups. In the rehabilitation group the anterior zygomatic arch width was wider than in the hypofunctional group. It is possible that the 6 weeks of retraining were not enough to catch up to the same width as the control group. Still, during the retraining period the increases in the zygomatic arch width were larger in the rehabilitation group compared with the control group.
The alterations observed in the rehabilitation group at the end of the experiment were only at sites where mechanical load had been induced by the masseter muscle on the zygomatic arch. The later is formed by the zygomatic process of the maxilla anteriorly to the zygomatic bone centrally and then the zygomatic process of the squamosal posteriorly [Citation15]. This is the site of the origin of the deep masseter muscle, which inserts to the lateral surfaces of the body and ramus of the mandible. It was previously found that our rehabilitation model caused an increase of the slow contractile gene expression isoform (MYH 7) levels due to an adaptation to the augmented mechanical load [Citation16].
Our findings in this transverse dimension are in line with the catch up effect observed on the sagittal plane of the mandible in the same group of rats [Citation11], possibly the corresponding effect of the direct load of the masseter muscle on this mandibular area.
Similar effects that have been shown on other bones of the rat’s body support our observations. Iwamoto et al. [Citation17] concluded in their review article, that exercise in form of treadmill running increase the cortical thickness of the tibia and lumbar bone in adult female rats.
The effect of retraining has been measured also in human adults showing that exercise can influence bone adaptation for example when adults who start with a racquet sport get a thicker cortical wall of the humeral shaft after long time of loading [Citation18]. Similarly it was found that in female collegiate soccer players, there was a transverse bone size increase during the period pre-to post season [Citation19].
Our experimental model changing the consistency of the diet during a prolonged period gave similar findings as those observed by Katsaros et al. [Citation3] and Abed et al. [Citation20]. However, the rehabilitation changes detected between weeks 21 and 27 at adult age are relatively small in comparison to the modelling changes that had occurred during the growth period.
As no body weight differences and no differences in posterior cranial width where there were no functional loads existed between the groups we considered that our findings are linked only to the induced functional alterations.
The advantages of animal studies are that they lend themselves to be performed under controlled circumstances in comparison with clinical studies. However our findings on this animal study may include methodological errors due to incorrect identification of cephalometric landmarks, as well as wrong positioning of the individual in the cephalostat. Another disadvantage with our method that is based on the axial cephalograms is that it shows three-dimensional structures in 2D, which may obscure the detection of other changes that may have occurred.
Although the findings cannot be directly extrapolated to humans they suggest that an improvement of the masticatory muscle function for example after surgical correction of severe malocclusions or extensive prosthetic rehabilitation could affect certain craniofacial sites. These functional changes may influence the adults though at a slower pace, since it is known that “renewed modeling” in the adult skeleton can occur in cases where the mechanical loading has been altered significantly [Citation21]. We can further speculate that the skeletal response in the facial region due to improved masticatory muscle function may help to improve the stability of the result of orthognathic surgery in adult individuals. To answer this question, clinical trials need to be performed.
Conclusion
Retraining of masticatory muscles in adult rats leads to increase of some transverse craniofacial dimensions, a possible result of bone remodeling to resist induced functional changes.
Disclosure statement
No potential conflict of interest was reported by the authors.
References
- Pepicelli A, Woods M, Briggs C. The mandibular muscles and their importance in orthodontics: a contemporary review. Am J Orthod Dentofacial Orthop. 2005;128:774–780.
- Kiliaridis S, Engström C, Thilander B. The relationship between masticatory function and craniofacial morphology I. A cephalometric longitudinal analysis in the growing rat fed a soft diet. Eur J Orthod. 1985;7:273–283.
- Katsaros C, Berg R, Kiliaridis S. Influence of masticatory muscle function on transverse skull dimensions in the growing rat. J Orofac Orthop. 2002;63:5–13.
- Tallgren A, Tryde G, Mizutani H. Changes in jaw relations and activity of masticatory muscles in patients with immediate complete upper dentures. J Oral Rehabil. 1986;13:311–324.
- Jemt T, Book K, Karlsson S. Occlusal force and mandibular movements in patients with removable overdentures and fixed prostheses supported by implants in the maxilla. Int J Oral Maxillofac Implants 1993;8:301–308.
- Müller F, Hernandez M, Grütter L, et al. Masseter muscle thickness, chewing efficiency and bite force in edentulous patients with fixed and removable implant-supported prostheses: a cross-sectional multicenter study. Clin Oral Implants Res. 2012;23:144–150.
- English JD, Buschang PH, Throckmorton GS. Does malocclusion affect masticatory performance? Angle Orthod. 2002;72:21–27.
- Ellis E, 3rd, Throckmorton GS, Sinn DP. Bite forces before and after surgical correction of mandibular prognathism. J Oral Maxillofac Surg. 1996;54:176–181.
- Throckmorton GS, Buschang PH, Ellis E 3rd. Improvement of maximum occlusal forces after orthognathic surgery. J Oral Maxillofac Surg. 1996;54:1080–1086.
- Proffit WR, Turvey TA, Fields HW, et al. The effect of orthognathic surgery on occlusal force. J Oral Maxillofac Surg. 1989;47:457–463.
- Ödman A, Mavropoulos A, Kiliaridis S. Do masticatory functional changes influence the mandibular morphology in adult rats. Arch Oral Biol. 2008;53:1149–1154.
- Mavropoulos A, Ödman A, Ammann P, et al. Rehabilitation of masticatory function improves the alveolar bone architecture of the mandible in adult rats. Bone. 2010;47:687–692.
- Kiliaridis S, Shyu BC. Isometric muscle tension generated by masseter stimulation after prolonged alteration of the consistency of the diet fed to growing rats. Arch Oral Biol. 1988;33:467–472.
- Dahlberg G. Statistical methods for medical and biological students. New York: Interscience Publications; 1940.
- Hiiemae K, Houston WJB. The structure and function of the jaw muscles in the rat (Ruffus norvegicus L.). Zool J Linn Soc. 1971;50:75–99.
- Ödman AM, Hunt NP, Matloub Moawad HA, et al. Molecular changes in detrained & retrained adult jaw muscle. Eur J Orthod. 2013;35:659–663.
- Iwamoto J, Takeda T, Sato Y. Effect of treadmill exercise on bone mass in female rats. Exp Anim. 2005;54:1–6.
- Kontulainen S, Sievanen H, Kannus P, et al. Effect of long-termimpact-loading on mass, size, and estimated strength of humerus and radius of female racquet-sports players: a peripheral quantitative computed tomography study between young and old starters and controls. J Bone Miner Res. 2003;18:352–359.
- Minett MM, Binkley TB, Weidauer LA, et al. Changes in body composition and bone of female collegiate soccer players through the competive season and off-season. J Muscculoskelet Neuronal Interact 2017;17:386–398.
- Abed GS, Buschang PH, Taylor R, et al. Maturational and functional related differences in rat craniofacial growth. Arch Oral Biol. 2007;52:1018–1025.
- Robling AG, Castillo AB, Turner CH. Biomechanical and molecular regulation of bone remodeling. Annu Rev Biomed Eng. 2006;8:455–498.