
Abstract
Objectives
The purpose of this study was to compare magnetic resonance imaging (MRI) maximum tumor diameter and depth of invasion with histopathology in oral tongue squamous cell carcinoma (OTSCC) patients in our Institute. Another objective was to compare recorded nodal status between MRI and histology.
Material and methods
MRI and pathological records of 45 patients diagnosed with T1–T3 OTSCC were reviewed retrospectively. Maximum tumor diameter and depth of invasion were measured and rechecked by oral radiologist and pathologist. Nodal status was recorded from both MRI and histopathology. Correlation analyses were performed using Pearson’s correlation.
Results
Both maximum tumor diameter and depth of invasion correlated significantly between MRI and histology (ρ = 0.874, p < .001; ρ = 0.898, p < .001). Significant correlation was found between MRI and pathological dimensions in the MRI-based T-staged subgroups of T2 and T3 but not in T1. MRI sensitivity for detecting pathologically positive nodes was 60%. MRI specificity for detecting pathologically negative nodes was 83%. Moderate correlation was found between MRI and histological nodal status (ρ = 0.44, p = .003).
Conclusions
MRI tumor dimensions correlate with histopathological data in OTSCC. Based on our Finnish patient material and results, MRI serves as an accurate tool in supporting OTSCC patient treatment in our Institute.
Introduction
Oral tongue squamous cell carcinoma (OTSCC) is a malignant neoplasm arising from the anterior 2/3 of the tongue. The lateral aspect of the tongue is most often affected. OTSCC is strongly associated with smoking, alcohol consumption, tobacco chewing and betel nut chewing [Citation1]. The incidence of oral tongue cancer varies globally [Citation2]. In the Nordic countries, incidence is slightly higher in males than in females, and the cancer is commonly seen in the elderly population [Citation3,Citation4]. In Finland in 2016, the incidence of oral tongue cancer was 1.58 per 100,000 men (76 cases) and 0.86 per 100,000 women (52 cases) [Citation4].
The Union for International Cancer Control’s (UICC) TNM classification is the internationally accepted standard for cancer staging. T describes the size of the tumor, N the regional lymph node status and M the presence of distant metastasis. In the latest, 8th edition of UICC TNM classification, tumor invasion depth is used along with greatest dimension to categorize the tumor [Citation5].
Magnetic resonance imaging (MRI) is the preferred imaging modality compared to computed tomography (CT) as it provides better soft-tissue visualization in oral tongue cancer [Citation6–10]. There are several studies in which tumor thickness has been compared between MRI and histology [Citation7,Citation11–13]. Lam et al. [Citation7] concluded that MRI can be satisfactorily used to measure tumor thickness, assisting in treatment planning. Preda et al. [Citation12] report similar results. Several studies have analyzed MRI accuracy by assessing the tumor invasion depth in MRI and histopathology [Citation14–18].
In previous studies, ‘tumor thickness’ and ‘depth of invasion’ have been used comparably to describe the size of tumors. Tumor thickness is used to measure the entire tumor mass, while depth of invasion describes the growth beneath the epithelial surface [Citation19]. The aim of our study was to analyze diagnostic accuracy of MRI in the assessment of tumor maximum diameter and depth of invasion in oral tongue SCC patients in our Institute. Although similar results have been reported in several earlier studies, as far as we know no similar studies have been performed in Finland or in Scandinavian countries. Additionally, we evaluated the accuracy of MRI in estimating nodal metastasis in this material.
Materials and methods
Patient material
The patients (n = 200) were primarily selected from the Q-pati database, Department of Pathology, Huslab, Helsinki University Hospital, having been diagnosed with OTSCC between January 2002 and September 2018. Of these, patients with non-surgical treatment, unavailable MR images, only CT imaging or previous head and neck radiotherapy or chemoradiotherapy were considered ineligible for our analysis. After exclusions, our final study sample consisted of 45 OTSCC patients. The preoperative MR images were retrospectively viewed and the histopathologic data from the Q-pati database recorded. Vast majority of the patients (93%) were biopsied prior to imaging. Based on MR image review we classified tumors as T1 (n = 7), T2 (n = 21) or T3 (n = 17). TNM classification was obtained using the 8th edition of the UICC TNM classification [Citation5]. We followed the strict research protocol of our Institute with research permit. As our study was based on patient records, no approval was demanded by the ethical board.
MRI
MRI was performed using either a 1.5 T unit (Magnetom Vision; Siemens, Erlangen, Germany) or a 3 T unit (Magnetom Vision; Siemens, Erlangen, Germany or Philips Medical Systems). The MR images were retrospectively viewed by an experienced oral radiologist (SA) two separate times at one-month intervals to ensure reliability. We used axial and coronal T1-weighted images (slice thickness 3 mm) with fat-suppression and Gadolinium (Magnevist, 0.5 mmol/Ml; Schering, Germany) in analyzing tumor dimensions (). Both maximum tumor diameter and invasion depth were assessed. In case of exophytic tumor growth, invasion depth was measured from the presumed original tongue surface to the deepest tumor invasion level (). At the time that the MRI dimensions were measured, the oral radiologist was blind to the histological data.
Figure 1. Tumor dimensions were measured from axial (A) and coronal (B) T1-weighted fat-suppressed contrast-enhanced MR images. MR: magnetic resonance; cm: centimetre.
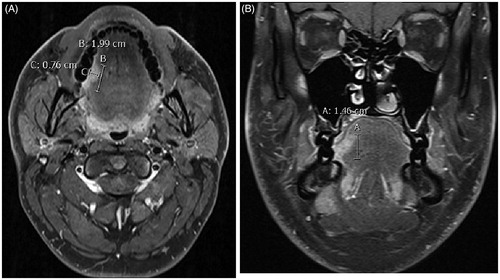
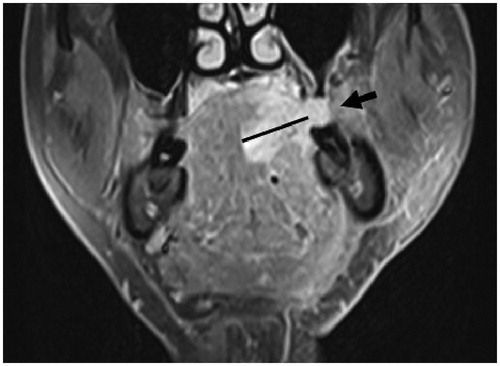
Figure 2. Coronal T1-weighted fat-suppressed contrast-enhanced MR image shows exophytic tumor growth (arrow). The exophytic part of the tumor was excluded when measuring the invasion depth. MR: magnetic resonance.
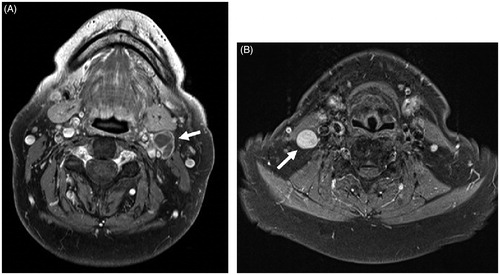
We additionally evaluated the patients’ nodal status on MRI. We used the minimum axial diameter of the node, with normal nodes not exceeding 11 mm in the jugulodigastric region and 10 mm elsewhere in the head and neck [Citation20]. Additionally, a node was considered pathologic when nodal necrosis or nodal nonhomogeneity was present (). MRI nodal metastasis was diagnosed as ‘yes’, ‘suspicious’ and ‘no’. In the analysis we combined the categories ‘yes’ and ‘suspicious’ as radiologically positive nodal status (rN+) compared to negative nodal status (rN0).
Figure 3. Axial T1-weighted, fat-suppressed contrast-enhanced MR images. (A) The presence of central necrosis in level II lymph node (arrow in A) was considered a definitive sign of malignancy. (B) A markedly enlarged and rounded level III lymph node (arrow in B). By size criteria, this node was considered malignant in OTSCC patient. MR: magnetic resonance; OTSCC: oral tongue squamous cell carcinoma.
Histological measurements
We used formalin-fixed, paraffin-embedded tissue samples taken during routine diagnostic procedures. Maximum tumor diameter and depth of invasion were recorded from the Q-pati database and were rechecked. Tumor dimensions were measured in the same way as in MRI. The pathologist was blinded to the MRI details when measuring histological dimensions. We recorded the pathologically positive (pN+) and negative nodal statuses (pN0) and compared those to the MRI analysis. In our routine surgical procedure, the neck dissection preparate is usually marked with different colours to make it possible for pathologists to separate the regions. In histology minimum to 12 nodes is limitation but usually the amount is among 20–40.
Statistical analysis
Statistical analyses were calculated using IBM SPSS statistics 25 software, Armonk, NY. We used Pearson’s correlation coefficient (ρ) to analyze correlation between the MRI and histopathological tumor dimensions. All reported p values were two-sided and p value <.05 was considered statistically significant. Intraobserver agreement was analyzed using intraclass correlation coefficient (ICC) with a single-measurement, absolute-agreement, 2-way mixed-effects model [Citation21,Citation22].
Results
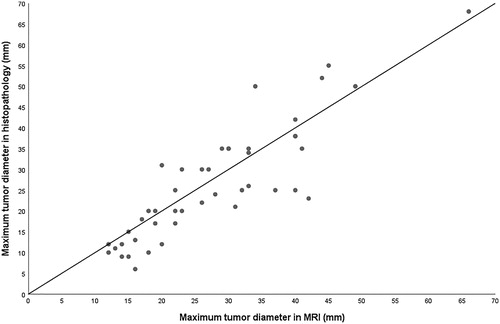
Maximum tumor diameters in MRI and in pathology correlated significantly (ρ = 0.874, p < .001). When the radiological maximum diameter was compared to pathology, slightly more than 50% of the values fell below the 1:1 line in scatter plot. Radiological maximum diameter assessed in MRI was greater than in pathologic samples in 24/45 cases (53.3%), equal value in 2/45 cases (4.5%) and less in 19/45 cases (42.2%) ().
Figure 4. Maximum tumor (n = 45) diameter in MRI vs. histopathology. In two cases, the dimensions compared were the same, thus only 43 dots can be seen in the scatter plot. MRI: magnetic resonance imaging; mm: millimetre.
Invasion depth in MRI and histological samples correlated significantly (ρ = 0.898, p < .001). When comparing the invasion depth in MRI to pathologic specimens, slightly more than 50% of the values fell below the 1:1 line in the scatter plot. Invasion depth in MRI was greater than in pathologic specimens in 25/45 cases (55.6%), equal depth in 4/45 cases (8.9%) and less in 16/45 cases (35.5%) ().
Figure 5. Tumor (n = 45) invasion depth in MRI vs. histopathology. In five cases, the dimensions compared were the same, thus only 40 dots can be seen in the scatter plot. MRI: magnetic resonance imaging; mm: millimetre.

When comparing the subgroups of MRI-based tumor T-staging, we found significant correlation between MRI and pathologic dimensions in T2 and T3 categories but not in T1. In the T2 group, correlation was significant in maximum diameter (ρ = 0.765, p < .001) and in invasion depth (ρ = 0.502, p = .020), as well as in the T3 group, respectively (ρ = 0.720, p = .001; ρ = 0.735, p = .001). T1 stage tumors did not correlate significantly either in maximum diameter (ρ = 0.555, p = .201) or in invasion depth (ρ = −0.260, p = .573).
MRI suspicious nodes were found in 10 patients and six patients were diagnosed as having nodal metastasis (rN+), thus 16 cases were considered rN+. In histopathology, 20 cases had metastasis (pN+) after neck dissection (n = 41). Twice sentinel lymph node biopsy was performed without neck dissection and these cases were considered negative (pN0). In two cases neither sentinel lymph node biopsy nor neck dissection was performed and thus we analyzed solely 43 cases in total. Comparison between MRI and histopathological nodal status is shown in . MRI sensitivity for detecting pathologically positive nodes was 60%. MRI specificity for detecting pathologically negative nodes was 83%. Positive predictive value (PPV) for MRI nodal status was 75%. Negative predictive value (NPV) for MRI nodal status was 70%. We found moderate correlation between MRI and histopathological nodal status (ρ = 0.44, p = .003).
Table 1. Comparison of rN and pN status (n = 43).
The intraclass correlation between the two MRI measurement times of maximum tumor diameter was 0.998 with 95% C.I. 0.997–0.999, p < .001. For the MRI depth of invasion, the ICC was 0.993 with 95% C.I. 0.985–0.996, p < .001. The reliability of MRI measurements is excellent in both dimensions.
Discussion
We detected significant correlation in maximum tumor diameter between MRI and histology, which is in line with earlier studies [Citation7,Citation12]. Furthermore, our results are in concordance with those of Lwin et al. [Citation11] as their Pearson’s correlation coefficient was almost the same as ours. Yesuratnam et al. [Citation13] compared tumor thickness assessed by MRI and ultrasound with pathologic tumor thickness and found MRI useful in late-stage (T3/T4) tumors. Our results concerning T3 tumors are similar.
We found significant correlation in depth of invasion between MRI and histopathology. In line with our results, Park et al. [Citation14] and Vidiri et al. [Citation18] found preoperative MRI to be accurate in measuring tumor invasion depth as they got significant correlation between MRI and pathology. Furthermore, Alsaffar et al. [Citation17] compared clinical and radiological depth of invasions to histopathology and found strong correlations in deep tumors (>5 mm). Similarly, we found correlation in T3 tumors. According to Jung et al. [Citation15], invasion depth can predict nodal metastasis and survival rate even in small tumors (T1 and T2), and they found significant correlation between MRI and histological depth of invasion. Contradictorily, in our results the correlation was significant only in large T2 and T3 tumors.
In the present study, vast majority of the patients (93%) were unfortunately biopsied prior to imaging. According to our treatment protocol malignant tumors should be processed to tumor board within two weeks. Furthermore, imaging is less accessible than biopsy, which is easily taken, and histologic diagnosis is preferred beforehand in order to avoid unnecessary MRI and expenses. Biopsy may lead to edoema or haemorrhage and subsequent overestimation of tumor size and invasion depth in MRI. Especially in small tumors, if they are biopsied prior to imaging, the inflammation may affect the MRI interpretation. In our material, we did not reach correlation in small tumors and the inflammation caused by biopsy probably explains this result. In larger tumors the biopsy may not have such an effect, because the inflammation due to biopsy is proportionally minor compared to tumor size. This may in part explain our better correlation between MRI and pathological dimensions in larger tumors. In addition, imaging artefacts may have a greater effect on measuring the dimensions in small tumors.
Diffusion weighted imaging (DWI) is commonly used in head and neck tumor imaging. The advantage of DWI is its greater ability to distinguish between tumor and peritumoral inflammation including the inflammation due to biopsy [Citation23]. In previous years, DWI was not incorporated in our routine tongue tumor MRI protocol. DWI was performed only in 17 patients in our research material and therefore we could not take it into account in our cohort.
Another factor that may have affected the variation in tumor dimensions is the variable time interval between MRI and resection, especially in aggressive tumors. However, in our Institute we aim to perform the surgery within two weeks following MRI. Therefore, in this study, time gap should not be the reason behind the variation in tumor dimensions. In pathology, tumors may shrink due to formalin fixation [Citation24], which may also generate errors, although the effect should be the same for all the samples that we analyzed. Usually, the scale in microscopes is adjusted according to supposed shrinkage effect. Additionally, histological samples may have been cut primarily by tumor width instead of length resulting in too small tumor diameters.
Compared to Lwin et al. [Citation11] we found similar results in the nodal status comparison between MRI and pathology in PPV and NPV. Our PPV and NPV were a bit lower than theirs (75% vs. 88% and 70% vs. 72%). Lwin et al. [Citation11] summarized that neither MRI staging of the neck nor tumor thickness can be entirely trusted in determining the need for neck dissection. Similarly, based on our results, MRI may capture the nodal metastasis, but it cannot be trusted as the only indication when deciding the need for neck dissection. Generally, in practice, elective neck dissection is recommended in cN0 situations if the risk of occult regional metastasis is considered to be more than 20% [Citation25].
Limitations of our study include the relatively small number of patients analyzed and the lack of DWI. Despite these limitations, the number of cases (n = 45) studied is sufficient for statistical analyses. Our study findings are in line with the previous studies [Citation7,Citation11–14,Citation17,Citation18]. To our knowledge, this is the first study to evaluate the correlation between histopathological and MRI assessment of depth of invasion in OTSCC in Scandinavia. Our future aim is to analyze the reliability between standard MRI and DWI in our Institute in larger sample material when available.
Conclusions
According to our study, MRI tumor dimensions correlate to histopathological data in OTSCC. Nodal status can be recorded in MRI, but it should not be used as the only criterion when deciding the need for neck dissection. Based on our Finnish patient material and results, MRI serves as an accurate tool in supporting OTSCC patient treatment in our Institute.
Disclosure statement
Lauri Jouhi is an employee at Orion Pharma.No potential conflict of interest was reported by the author(s).
References
- Shah G, Wesolowski J, Choi J, et al. Head and neck imaging. 1st ed. New York: Thieme; 2016.
- Ferlay J, Ervik M, Lam F, et al. 2018. Global Cancer Observatory: Cancer Today. Lyon, France: International Agency for Research on Cancer. [updated 2018; cited 2019 Aug 19]. Available from: https://gco.iarc.fr/today
- Danckert B, Ferlay J, Engholm G, et al. 2019. NORDCAN. Cancer incidence, mortality, prevalence and survival in the Nordic countries, version 8.2. [updated 2019 Mar 26; cited 2019 August 19]. Available from: http://www-dep.iarc.fr/nordcan.htm
- Finnish cancer register. 2019. Cancer 2016 [report on the internet]. [updated 2019 Feb 08; cited 2019 Aug 19]. Available from: https://syoparekisteri.fi/assets/files/2019/02/vuosiraportti_2016.pdf
- Brierley JD, Gospodarowicz MK, Wittekind C, editors. TNM classification of malignant tumors. 8th ed. UICC: Wiley-Blackwell; 2016.
- Arya S, Rane P, Deshmukh A. Oral cavity squamous cell carcinoma: role of pretreatment imaging and its influence on management. Clin Radiol. 2014;69(9):916–930.
- Lam P, Au-Yeung KM, Cheng PW, et al. Correlating MRI and histologic tumor thickness in the assessment of oral tongue cancer. Am J Roentgenol. 2004;182(3):803–808.
- Hermans R, De Keyzer F, Vandecaveye V, et al. Imaging techniques. In: Hermans R, editor. Head and neck cancer imaging. Berlin, Heidelberg: Springer Berlin Heidelberg; 2012. p. 33–54.
- Singh A, Thukral CL, Gupta K, et al. Role of MRI in evaluation of malignant lesions of tongue and oral cavity. Pol J Radiol. 2017;82:92–99.
- Ong CK, Chong V. Imaging of tongue carcinoma. Cancer Imaging. 2006;6(1):186–193.
- Lwin CT, Hanlon R, Lowe D, et al. Accuracy of MRI in prediction of tumor thickness and nodal stage in oral squamous cell carcinoma. Oral Oncol. 2012;48(2):149–154.
- Preda L, Chiesa F, Calabrese L, et al. Relationship between histologic thickness of tongue carcinoma and thickness estimated from preoperative MRI. Eur Radiol. 2006;16(10):2242–2248.
- Yesuratnam A, Wiesenfeld D, Tsui A, et al. Preoperative evaluation of oral tongue squamous cell carcinoma with intraoral ultrasound and magnetic resonance imaging – comparison with histopathological tumor thickness and accuracy in guiding patient management. Int J Oral Maxillofac Surg. 2014;43(7):787–794.
- Park JO, Jung SL, Joo YH, et al. Diagnostic accuracy of magnetic resonance imaging (MRI) in the assessment of tumor invasion depth in oral/oropharyngeal cancer. Oral Oncol. 2011;47(5):381–386.
- Jung J, Cho NH, Kim J, et al. Significant invasion depth of early oral tongue cancer originated from the lateral border to predict regional metastases and prognosis. Int J Oral Maxillofac Surg. 2009;38(6):653–660.
- Goel V, Parihar PS, Parihar A, et al. Accuracy of MRI in prediction of tumor thickness and nodal stage in oral tongue and gingivobuccal cancer with clinical correlation and staging. J Clin Diagn Res. 2016; 10(6):TC01–TC05.
- Alsaffar HA, Goldstein DP, King EV, et al. Correlation between clinical and MRI assessment of depth of invasion in oral tongue squamous cell carcinoma. J Otolaryngol Head Neck Surg. 2016;45(1):61.
- Vidiri A, Panfili M, Boellis A, et al. The role of MRI-derived depth of invasion in staging oral tongue squamous cell carcinoma: inter-reader and radiological-pathological agreement. Acta Radiol. 2020;61(3):344–352.
- Pentenero M, Gandolfo S, Carrozzo M. Importance of tumor thickness and depth of invasion in nodal involvement and prognosis of oral squamous cell carcinoma: a review of the literature. Head Neck. 2005;27(12):1080–1091.
- van den Brekel MW, Stel HV, Castelijns JA, et al. Cervical lymph node metastasis: assessment of radiologic criteria. Radiology. 1990;177(2):379–384.
- Mcgraw K, Wong SP. Forming inferences about some intraclass correlation coefficients. Psychol Methods. 1996;1(1):30–46.
- Koo TK, Li MY. A guideline of selecting and reporting intraclass correlation coefficients for reliability research. J Chiropr Med. 2016;15(2):155–163.
- Thoeny HC, De Keyzer F, King AD. Diffusion-weighted MR imaging in the head and neck. Radiology. 2012;263(1):19–32.
- Umstattd LA, Mills JC, Critchlow WA, et al. Shrinkage in oral squamous cell carcinoma: an analysis of tumor and margin measurements in vivo, post-resection, and post-formalin fixation. Am J Otolaryngol. 2017;38(6):660–662.
- Wei WI, Ferlito A, Rinaldo A, et al. Management of the N0 neck – reference or preference. Oral Oncol. 2006;42(2):115–122.