
Abstract
Objective: To determine speech perception in quiet and noise of adult cochlear implant listeners retaining a hearing aid contralaterally. Second, to investigate the influence of contralateral hearing thresholds and speech perception on bimodal hearing.
Patients and methods: Sentence recognition with hearing aid alone, cochlear implant alone and bimodally at 6 months after cochlear implantation were assessed in 148 postlingually deafened adults. Data were analyzed for bimodal summation using measures of speech perception in quiet and in noise.
Results: Most of the subjects showed improved sentence recognition in quiet and in noise in the bimodal condition compared to the hearing aid-only or cochlear implant-only mode. The large variability of bimodal benefit in quiet can be partially explained by the degree of pure tone loss. Also, subjects with better hearing on the acoustic side experience significant benefit from the additional electrical input.
Conclusions: Bimodal summation shows different characteristics in quiet and noise. Bimodal benefit in quiet depends on hearing thresholds at higher frequencies as well as in the lower- and middle-frequency ranges. For the bimodal benefit in noise, no correlation with hearing threshold in any frequency range was found.
Chinese abstract
目的:确定对侧保留助听器的成人人工耳蜗听者在安静和噪声中的言语感知。其次, 调查对侧听觉阈值和语音感知对双模式听力的影响。
患者和方法:对148名语言之后变聋的成年人进行评估只使用助听器、只有人工耳蜗植入和人工耳蜗植入术后6个月时两种模式均用时的句子识别。使用静音和噪音中的语音感知度量来分析数据以取得双模式之和。
结果:与只有助听器或只有人工耳蜗的模式相比, 大多数受试者在安静和噪声中的双模式状态下显示出句子识别的改进。静音中双模式效益的巨大可变性可以部分地由纯音损失的程度来解释。此外, 在听觉方面, 听力较好的受试者从额外的电输入中受益显著。
结论:双模式之和在静音和噪声中表现出不同的特征。安静中的双模式效果取决于较高频率以及较低频率和中频率范围内的听力阈值。对于噪声中的双模式效益, 在任何频率范围内均未发现与听力阈值的相关性。
Introduction
A number of studies have shown that a cochlear implant (CI) is superior compared to hearing aids (HA) when a bilateral profound or severe to profound hearing loss (HL) is present. Driven by surgical and technological advances and the progress in CI follow-up care, indication criteria have expanded significantly [Citation1–3]. Consequently, in clinical practice, asymmetric hearing has become a more frequent circumstance for cochlear implantation. In many of the asymmetric cases, subjects are provided with a CI system on one side and a hearing aid on the other known as bimodal listening. Previous studies showed that bimodal listening is most advantageous for speech perception, localization, and subjective rating of speech understanding in quiet, in noise and environmental alertness [Citation4–7].
Several binaural effects are to be considered: the binaural summation effect can be interpreted as a result of the loudness increase from one to two ears for unimodal bilateral and symmetric listening. For the bimodal condition, this summation refers not only to the loudness increase but to hearing with two different modalities that provide, to a certain degree complementary information. It is usually measured as the difference in speech perception in the CI + HA situation compared to CI-only mode when speech is presented via a frontally placed loudspeaker either in quiet or with a co-located noise source. Several studies described significant improvements of about 10–20% points [Citation8]. The binaural squelch effect is associated with the listener’s ability to facilitate the spatial separation of signal and noise sources. The head-shadow effect denotes the influence of attenuation on the sound pressure by the head; in particular, high frequencies above 1000 Hz are attenuated varying with the angle and frequency.
According to the candidate selection criteria most of the studies investigated the bimodal benefit in subjects with rather poor acoustic hearing [Citation8–12]; that is, only low-frequency hearing was present on the HA side. Consequently, low-frequency hearing had the greatest impact on bimodal benefits of speech perception in quiet, in noise, and in music perception. Other topics were the hearing progress over time in those bimodal CI recipients [Citation13], the bimodal benefit in different spatial conditions [Citation14] and specific fitting methods of the HA side [Citation9,Citation10,Citation12,Citation15].
Less is known about bimodal processing in subjects with substantial acoustic hearing. Recently, Sanhueza et al. [Citation16] investigated the bilateral–binaural advantage in a group of 31 patients with bimodal stimulation that included recipients with moderate hearing impairment. They described a trend for higher bimodal benefits for patients with better residual hearing. Another study by Illg et al. [Citation17] with 141 subjects might have included subjects with better hearing; however, the average thresholds between 0.5 and 4 kHz were between 70 and 90 dB. They found a great variability in the bimodal performance that could only partly be explained by the degree of HL. This finding supports the hypothesis that the integration process is highly listener-specific.
The aim of this study was to describe speech perception capabilities in quiet and in noise of a present-day clinical CI population using a contralateral hearing aid. In particular, we determined the bimodal summation effect on speech recognition for CI alone, HA alone, and the better ear. The results were analyzed with respect to different degrees of HL, frequency dependent HL, and speech perception in the non-implanted ear.
Methods
Subjects
In the presence of increasing numbers of recipients with contralateral hearing, we introduced a systematic assessment of bimodal speech perception in 2014. For this study, we reviewed all patient files from CI recipients who were implanted at the ENT Department at Erlangen. Inclusion criteria for the current retrospective study were postlingually onset of deafness, age over eighteen years, bilateral hearing aid usage before surgery, retention of contralateral hearing aid, and informed consent of the patient. Furthermore, all subjects had at least six months of CI experience and took part in the bimodal assessment.
Procedure
Audiometric testing was completed as clinical routine in the ENT Department at Erlangen for those patients who were provided with a CI and who used a hearing aid on the opposite ear. Audiometry included pure-tone testing on the CI-contralateral side, speech in quiet and speech in noise measurements. Pure-tone thresholds were measured routinely at 125, 250, 500, 750 Hz, and 1 kHz and 1.5, 2, 3, 4, 6, and 8 kHz. For analysis, pure-tone loss was summarized as the four-frequency pure-tone average (4FPTA) by calculating the mean hearing thresholds at 0.5, 1, 2, and 4 kHz. Additionally, in order to evaluate the influence of frequency-dependent hearing thresholds, we defined three different frequency regions, low, middle, and high. Low frequencies were represented by the average hearing thresholds for frequencies below 500 Hz (i.e. 0.125 and 0.25 kHz), middle-frequency hearing was defined by the 4FPTA, and the high frequencies were represented by the average hearing thresholds at 6.0 and 8.0 kHz.
Tests were performed in a soundproof booth (Series 40a, IAC Acoustics, Niederkrüchten, Germany) with a patient located 0.8 m from the frontally placed loudspeaker using a computer-audiometer (AT1000, Auritec, Hamburg, Germany).
All speech tests were performed for the CI switched off (HA-only mode), the HA switched off (CI-only mode), and both devices switched on (bimodal).
Göttingen sentences were used as speech material at a presentation level of 65 dB SPL. The test consists of 20 lists each comprising 10 meaningful, phonemically balanced, everyday sentences. Each list comprises 50 words.
Speech recognition scores (SRS [%]) in quiet were measured in the three conditions. Whenever the SRS was above 60% for all of the three conditions, speech recognition thresholds (SRT [dB]) in noise were measured by adaptively varying the noise level with a fixed speech level at 65 dB SPL. As a result, the signal-to-noise ratio (SNR) for 50% recognition (SRT) was determined for the HA-only, CI-only, and bimodal condition. For all CI-only conditions, the HA on the contralateral ear was switched off and the ear was occluded with an earplug and white noise was applied for adequate masking. Speech and competing noise were both applied from the same speaker placed at S0 (in front of the listener). Ethical approval was obtained from the institutional ethical committee Erlangen (Ref. No. 162_17 Bc).
Data analysis
The subjects were divided into different HL grades according to the World Health Organization (WHO) classification based on the pure-tone average on the HA side. The five different grades WHO0, WHO1, WHO2, WHO3, and WHO4 refer to PTA ≤25, 25 < PTA ≤40, 40 < PTA ≤60, 60 < PTA ≤80, and PTA >80 dB HL. WHO0 and WHO1 were collapsed into one group due to the limited number of subjects in these categories.
The bimodal benefit in quiet was defined as a recently used relative measure [Citation15,Citation18]. This is referred to as normalized bimodal summation. It was calculated as the percentage of possible benefit obtained related to either the HA ear, the CI ear, or the better ear for the monaural condition. For example, for a CI-only score of 45%, HA-only of 60%, and bimodal score of 87%, the resultant normalized bimodal summation in quiet related to the HA ear would be (87 − 60)/(100 − 60) = 68%. The corresponding normalized bimodal summation related to the CI would be calculated as (87 − 45)/(100 − 45) = 76%.
The bimodal summation noise was simply defined as the difference in SRT for the monaural condition and the SRT in the bimodal condition. Hence, positive values of the bimodal summation in noise represent a bimodal benefit, while negative values stand for poorer performance in the bimodal condition.
Correlation analysis was performed for hearing thresholds at low, mid, and high frequencies and the speech perception in quiet and in noise. In particular, the monaural HA score, the bimodal results, and the bimodal summation were used for correlation analyses. With respect to the uneven spread of data due to nonlinear relation and ceiling effects, Spearman rank correlation coefficients were calculated. p values for correlation analysis are displayed without any correction for multiple testing; however, for interpretation, p values were corrected using the Bonferroni–Holm method.
Results
Of 148 patients met the inclusion criteria, 67 male, and 81 female, with age at implant ranging from 18 to 84 years of age (mean 60.5 ± 16 years) and an average CI experience of 28 months ranging from six months to 176 months. In 83 (56%) of the cases, the right ear was provided with a CI.
shows the pure-tone thresholds of the 148 CI recipients with contralateral hearing aid with respect to the WHO classification of HL. shows the eight thresholds of WHO grade 0 and 1 (five with contralateral mild HL, grade 0, and three with grade 1). The three CI-recipients with contralateral grade 0 had a mean 4FPTA of 23 dB HL. The reason for wearing a hearing aid was a ski-slope high-frequency HL greater than 60 dB HL at 4–8 kHz.
Figure 1. Boxplots of pure tone thresholds of the study population with respect to the WHO-classification of hearing loss.
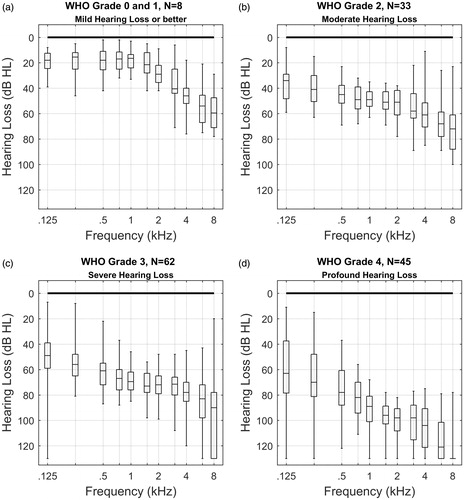
Median thresholds for the different WHO grades decrease with higher grades of hearing loss (HL), a self-fulfilling result since the grade is calculated via 4FPTA. This decrease is also observed in the frequency ranges above and below the 4FPTA. The variability in hearing thresholds dramatically increases, beginning with about 40 dB for grades 0 and 1 up to more than 100 dB for grade 4. Present in all WHO grades, we see substantial pure-tone hearing in the low-frequency range.
shows two panels of box plots for speech perception in the HA-only mode for the different WHO-groups and, for comparison, the test results in CI-only mode. The upper panel (a) shows the speech reception score at 65 dB SPL in free field and the lower panel (b) shows speech reception thresholds in noise (SRTHA).
Figure 2. Box plots showing the speech perception of the study population in HA-only mode. shows the speech reception score @65 dB SPL in free field for the different grades of hearing loss. shows the speech reception threshold in noise. The speech reception scores () and thresholds () in CI-only mode are shown at the right-hand side. The boxplots denote the median, 1st and 3rd quartiles, maximum, and minimum. The dotted lines at the bottom side of the boxplots indicate that those quantities cannot be determined for all condition and groups. The legend displays the proportion of complete measurements (complete for sentences in quiet; variable in noise).
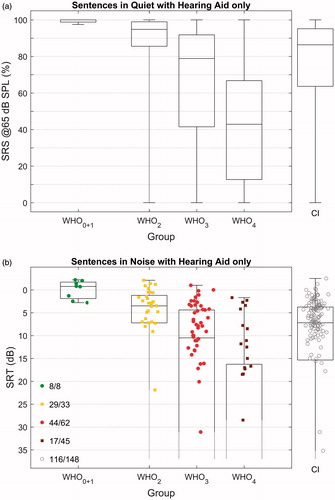
For speech in quiet, the median performance of SRSHA decreases from 100% for WHO0 + 1 to 95% in WHO2, 79% in WHO3 and down to 43% in WHO4. This decrease is combined with a growing interquartile range up to 50% in the WHO3 and WHO4. Ceiling effects of the test are obvious in the WHO0 + 1 and WHO2 groups.
The SRTHA in noise represents measurements for 98 out of 148 subjects. Two factors contributed to the unsuccessful assessment of SRTHA in noise in the remaining 50 subjects. First, the insufficient speech understanding did not allow for an adaptive procedure and, secondly, similar to some SRSHA in quiet measurements, a few subjects showed fatigue effects and did not complete the evaluation. Therefore, the determination of the statistical parameters for the SRTs is incomplete. All recipients of the WHO0 + 1 group could perform the SRT measurements. In the WHO2 group, 29 of 33 recipients showed sufficient speech perception to complete the adaptive SRT measurement. Therefore, all statistical parameters but the minimum were determined. The portion of completed and valid SRT measurements dropped down to 38% (17 of 45) in the WHO4 group for which the maximum score and the 3rd Quartile could only be determined. In the speech in noise test, the trends for decreased median performance and an increased variability with larger HL is visible as well. The observed variability is largest in the WHO3 and the WHO4 groups. In CI-only mode, the median SRS was 86% and the median SRT was 7.2 dB. For both, speech in quiet and noise, this corresponds to a performance in HA-only mode for hearing losses between WHO-grade 2 and 3.
The scatter plots in illustrate the relation between the three different hearing modalities to CI-recipients with contralateral HA for speech understanding in quiet and noise. relate the two unimodal hearing modes with each other. The portion of subjects with better HA-performance or better CI-performance is roughly one half, each. and compare CI- and HA-only performance with the bimodal condition, respectively. Additionally, two panels (d and h) relate speech understanding in the bimodal mode with speech understanding of the better ear.
Figure 3. Scatter plots showing the speech perception of the study population in all three modalities: HA-only, CI-only, and Bimodal hearing with HA and CI. Panels 3(a,d) show the distributions for the SRS scores in quiet. Panels 3(e,h) show the SRT scores in noise. The legend depicted in panel h refers to all panels of this figure. Each diagonal grey line in (a,h) represents equal performance for the two conditions as labeled at the corresponding x- and y-axes. The scatter plots are based on three measurements each in quiet and in noise, HA only, CI only, and Bimodal. The percentage values characterize the portion of data points above and below the bisecting line.
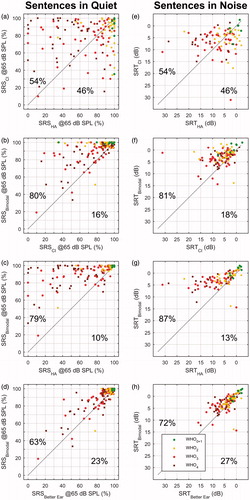
When considering a single modality (HA or CI), between 79 and 87% of the recipients were above the bisecting line, respectively (); however, this portion decreased from 63 to 72% once the reference was made to the better ear (). This reduction means that not all of the bimodal subjects exhibit a true bimodal benefit of the second ear in this condition with the complementary modality. , however, show that even in relation to the better ear a large proportion of patients benefit from the second ear both in quiet and in noise.
The scatter plots in shows the performance of the better ear with respect to the 4FPTA of the hearing aid side. It provides an indication as to which extent the portion of subjects with better HA-side changes with greater pure-tone loss and how this affects the SRSBetter Ear and the SRTBetter Ear.
Figure 4. The two upper scatter plots (Figure 4(a,d)) show the speech recognition in quiet and in noise for the better ear and the two lower scatter plots represent bimodal speech perception (Figure 4(b,e)). Downward pointing triangles represent those cases with superior HA performance, upward pointing triangles refer to better CI performance. The stacked histograms in Figure 4(c,f) summarize the normalized bimodal summation in quiet and the binaural summation in noise. Data in Figure 4(c) can be interpreted as c = b−a, followed by transformation to normalized binaural summation. Figure 4(f) displays the difference between data shown in Figure 4(d,e).
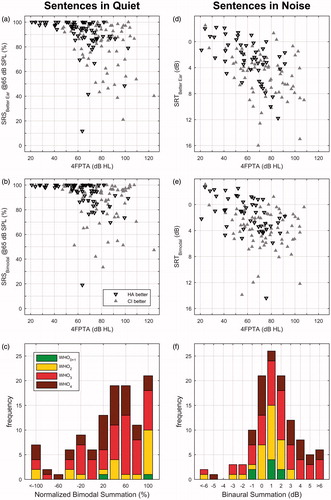
display the bimodal performance with respect to the 4FPTA on the HA side in quiet and noise. Interestingly, speech scores in quiet approach 100% for nearly all subjects with a 4FPTA below 60 dB on the HA side (). The scatter plots lead to the final evaluation of the bimodal summation shown in ). These two stacked histograms summarize the differences between the data in ) and (a,d) for each WHO grade. For speech in quiet, a large portion of the subjects with WHO-grade 0, 1, and 2 cannot be evaluated due to ceiling effects. The subjects with grade WHO2 show a normalized bimodal summation in quiet of 57% relative to the better ear, the subjects with WHO3 and WHO4 show a normalized bimodal summation of 45 and 31%, respectively.
In noise, the subjects of WHO0,1 and WHO2 show a bimodal summation with respect to the better ear between 0.8 and 1.0 dB improvement for the SRT. The subjects with WHO3 and WHO4 show a bimodal summation of 1.5 and 1.8 dB, respectively.
In order to evaluate the influence of the degree of residual hearing on the HA side on speech perception, Spearman rank correlation coefficients were calculated. Additionally, the effect of monaural speech recognition on the HA side on bimodal hearing was analyzed by correlation analysis, see . For speech in quiet, the strongest correlation is shown for the 4FPTA and a little less for the frequencies above and below the 4FPTA. For the speech in noise, there is a slight shift toward a stronger correlation for the lower frequency range and a weaker correlation for the higher frequency range.
Table 1. Correlation of pure tone thresholds in three different frequency ranges and hearing aid scores for the contralateral side for SRS in quiet and SRT in noise in the different conditions.
Both the normalized bimodal summation and the bimodal perception, itself, are significantly correlated with pure-tone loss and HA speech recognition with respect to the speech in quiet condition. For the noise condition, this relationship is only observed for bimodal perception. The bimodal summation noise is correlated with SRT in the HA-only mode.
Discussion
The vast majority of subjects experience a bimodal benefit even though there is a great variability for speech perception with respect to HL. For all WHO grades, a significant correlation of HL and speech perception in quiet in HA-only mode was observed.
For the normalized bimodal summation in quiet, a significant correlation with hearing thresholds was found. In addition and complementary to previous studies [Citation15,Citation17] this was not only found for the low frequencies but also for middle- and high-frequency hearing thresholds.
SRT in noise for the HA-only mode correlates significantly with pure-tone thresholds at all three frequency ranges. While the bimodal SRTs correlate with pure-tone threshold and HA-only performance, the bimodal gain itself does not yield a correlation with pure-tone thresholds but rather with the SRT on the HA side (SRTHA).
Better ear advantage
Considering the scatter plots in , bimodal speech perception in quiet and in noise is partially determined by the better-ear effect. There is a reduction of the percentage of subjects with bimodal gain in the order of 10–20% points once the reference is made to the better ear. This finding supports the reference to the better ear, regardless of modality, in order to evaluate the true bimodal effects of the second ear with the complementary modality.
Obviously, the better-ear advantage is important in everyday life. Furthermore, in an acoustic environment with spatially separated sources of signal and noise, the advantages of bilateral hearing in making use of the head shadow have a major impact on all recipients. When speech and noise are emitted from the same sound source and the reference is the better ear, it is possible to make assumptions about binaural processing in bimodal mode without having to consider the superposition by head shadow or better ear advantage. Additionally, the positive effects of binaural squelch do not obscure any negative effect that might have occurred as a result of binaural interference. Hence, the here presented data for bimodal benefit can be seen as a conservative estimation.
Degree of hearing loss and bimodal gain
An established view in bimodal hearing is based on the assumption that the hearing-aid side complements the better CI side. In particular, the low-frequency sounds were thought to contribute to the bimodal hearing. The reasons for this view were based on study populations in which the CI side was better than the hearing aid side for the vast majority of recipients [Citation8]. For these subjects, there are some approaches to increase bimodal benefit [Citation9,Citation12,Citation19]. Further studies are necessary to evaluate if and to which degree, those approaches can be applied to the growing number of bimodal recipients with mild and moderate HL.
In our study population, CI and HA side perform similar in average both in quiet and in noise. However, in individual cases, all grades of relation between CI- and HA-performance occurs. A comprehensive analysis showed a significant bimodal benefit due to electrical input also for subjects with better acoustic hearing. These results are complementary to previous findings showing the additional benefit of the acoustic input to the electric input [Citation13,Citation17]. The results in our bimodal recipients show that the performance in HA-only mode and bimodal mode are correlated with the HL in all frequency ranges as shown in . The combined thresholds in the higher and lower frequency ranges explain between 34 (noise) and 40% (quiet) of the variance in HA-only mode.
Methodological considerations: missing data
The evaluation of SRTs reveals a methodological dilemma that is inherently connected with audiological assessments when speech tests of bimodal recipients are evaluated: For reliable adaptive measurements of SRT, the speech scores in quiet must be above 50%. Therefore, with higher degrees of HL, a reliable SRT measurement is not possible for a growing number of recipients. This leads to missing data with a certain impact on statistics. Hence, the determination of statistical parameters is confounded. For example, in bimodal recipients with WHO4 grade on the HA side, the determination of a group median is not possible because more than fifty percent of the measurements could not be performed. Additionally, the correlation analysis as displayed in may be confounded for two reasons: First, the result of the correlation analysis depends on the occurrence of missing data. Second, the analyses for speech perception in quiet and in noise are based on different sample sizes.
Bimodal hearing in quiet and in noise
Remarkably, the calculated normalized bimodal summation in quiet shows a correlation with hearing thresholds for all frequency ranges while the calculated bimodal gain in noise shows no correlation. The missing impact of the pure-tone threshold may be a hint that bimodal benefit in noise is determined by additional factors as temporal masking or frequency resolution. This phenomenon known from studies in acoustic hearing subjects [Citation20] was not yet described for bimodal listeners.
In summary, the better ear advantage must be taken into account when discussing the bimodal benefit in subjects with substantial contralateral hearing. In distinction to previous studies [Citation12,Citation13,Citation15,Citation18], in our study population, there is roughly the half of subjects with better hearing on the CI side compared to HA side and vice versa. This may be due to the expanded indication criteria where the influence of the contralateral hearing status on CI indication is based on medical and audiological consideration [Citation2,Citation3].
As shown in this study subjects with all degrees of contralateral hearing benefit from a CI. More research is needed to investigate the different mechanisms for speech perception and bimodal benefit in quiet and in noise. Furthermore, the impact of high-frequency hearing for bimodal listening should be subject to future studies.
Conclusion
Bimodal listening is advantageous in quiet and in noise compared to all monaural conditions.
Subjects with better hearing on the acoustic side also experience significant benefit from the additional electrical input.
The summation in quiet depends on hearing thresholds in the higher frequency range as well as in the lower-and middle-frequency ranges.
The bimodal summation shows different characteristics in quiet and noise.
Further research is needed to identify appropriate fitting strategies covering all different groups of bimodal recipients.
Disclosure statement
TH is working for a company cochlear implant company.
References
- Dettman SJ, D'Costa WA, Dowell RC, et al. Cochlear implants for children with significant residual hearing. Arch Otolaryngol Head Neck Surg. 2004;130:612–618.
- Gifford RH, Dorman MF, Shallop JK, et al. Evidence for the expansion of adult cochlear implant candidacy. Ear Hear. 2010;31:186–194.
- Hoppe U, Hast A, Hocke T. Audiometry-based screening procedure for cochlear implant candidacy. Otol Neurotol. 2015;36:1001–1005.
- Armstrong M, Pegg P, James C, et al. Speech perception in noise with implant and hearing aid. Am J Otol. 1997;18:S140–S141.
- Ching TYC, Psarros C, Hill M, et al. Should children who use cochlear implants wear hearing aids in the opposite ear? Ear Hear. 2001;22:365–380.
- Ching TYC, Incerti P, Hill M. Binaural benefits for adults who use hearing aids and cochlear implants in opposite ears. Ear Hear. 2004;25:9–21.
- Morera C, Manrique M, Ramos A, et al. Advantages of binaural hearing provided through bimodal stimulation via a cochlear implant and a conventional hearing aid: a 6-month comparative study. Acta Oto-Laryngologica. 2005;125:596–606.
- van Hoesel RJ. Contrasting benefits from contralateral implants and hearing aids in cochlear implant users. Hear Res. 2012;288:100–113.
- Veugen LC, Chalupper J, Snik AF, et al. Matching automatic gain control across devices in bimodal cochlear implant users. Ear Hear. 2016;37:260–270.
- Veugen LC, Chalupper J, Snik AF, et al. Frequency-dependent loudness balancing in bimodal cochlear implant users. Acta Otolaryngol. 2016;136:775–781.
- Devocht EMJ, George ELJ, Janssen AML, et al. Bimodal hearing aid retention after unilateral cochlear implantation. Audiol Neurotol. 2015;20:383–393.
- Dorman MF, Loizou P, Wang S, et al. Bimodal cochlear implants: the role of acoustic signal level in determining speech perception benefit. Audiol Neurotol. 2014;19:234–238.
- Luntz M, Yehudai N, Shpak T. Hearing progress and fluctuations in bimodal-binaural hearing users (unilateral cochlear implants and contralateral hearing aid). Acta Otolaryngol. 2007;127:1045–1050.
- Morera C, Cavalle L, Manrique M, et al. Contralateral hearing aid use in cochlear implanted patients: multicenter study of bimodal benefit. Acta Oto Laryngol. 2012;132:1084–1094.
- Sheffield SW, Simha M, Jahn KN, et al. The effects of acoustic bandwidth on simulated bimodal benefit in children and adults with normal hearing. Ear Hear.2016;37:282–288.
- Sanhueza I, Manrique R, Huarte A, et al. Bimodal stimulation with cochlear implant and hearing aid in cases of highly asymmetrical hearing loss. Int Adv Otol. 2016;12:16–22.
- Illg A, Bojanowicz M, Lesinski-Schiedat A, et al. Evaluation of the bimodal benefit in a large cohort of cochlear implant subjects using a contralateral hearing aid. Otol Neurotol. 2014;35:e240–e244.
- Zhang T, Spahr AJ, Dorman MF, et al. Relationship between auditory function of nonimplanted ear and bimodal benefit. Ear Hear. 2013;34:133–141.
- Siburt HW, Holmes AE. Bimodal programming: a survey of current clinical practice. Am J Audiol. 2015;24:243–249.
- Rhebergen KS, Versfeld NJ, Dreschler WA. Extended speech intelligibility index for the prediction of the speech reception threshold in fluctuating noise. J Acoust Soc Am. 2006;120:3988–3997.