
Abstract
Background: Well characterized human cell lines are needed for preclinical treatment studies of anaplastic thyroid cancer (ATC).
Aims/Objectives: The aim was to establish, verify and characterize a panel of ATC cell lines.
Material and methods: Cell lines were established from ATC fine-needle aspiration biopsies and characterized genetically and functionally regarding treatment sensitivities.
Results: Eight cell lines were established in vitro and the anaplastic thyroid origin was verified. Seven of the cell lines were also grown as xenografts. The cell lines harboured complex karyotypes with modal numbers in hyperdiploid to near-pentaploid range. Five were TP53 mutated and three carried the BRAFV600E mutation. None had rearrangements of RET. For doxorubicin, IC50 ranged from 0.42 to 46 nmol/L and for paclitaxel from 1.6 to 196 nmol/L. Radiation sensitivity varied between 2.6 and 6.3 Gy. Two of the BRAF mutated cell lines displayed high sensitivity to vemurafenib, while the third was similar to the wild-type ones.
Conclusions and significance: We describe a series of new ATC cell lines demonstrating large heterogeneity in the response to cytostatic drugs and the BRAF inhibitor vemurafenib. The observations are relevant to future attempts to optimize treatment combinations for ATC.
Chinese abstract
背景:在间变性甲状腺癌(ATC)的临床前治疗研究中, 需要具有特性明确的人细胞系。
目的:建立和验证一组ATC细胞系, 并确定其特性。
材料和方法:从ATC细针穿刺活检组织中建立细胞系, 并就其治疗敏感性在基因和功能上确定细胞系的特性。
结果:体外建立了8个细胞系, 证实了间变性甲状腺起因。其中7个细胞系还作为异种移植物生长。这些细胞系具有复杂的核型, 其模式数在超二倍体到近五倍体范围之内。其中5例为TP53突变, 3例为BRAFV600E突变。无一例出现RET重排, 多柔比星IC50为0.42~46 nmol/L, 紫杉醇为1.6~196 nmol/L。放射敏感性为2.6~6.3Gy。其中两个BRAF突变细胞系对威罗菲尼(vemurafenib)表现出高度的敏感性, 而第三个与野生型细胞系相似。
结论和意义:我们描述了一系列新的ATC细胞系。它们对细胞抑制药物和BRAF抑制剂威罗菲尼的反应具有很大的异质性。这些观察结果与未来优化ATC治疗组合的尝试有关。
Introduction
Anaplastic thyroid cancer (ATC) is one of the most lethal malignancies with a median survival of about five months and a disease-specific mortality close to 100%. ATC accounts for approximately 5% of all thyroid cancers (TC), but for a substantial part of all deaths from TC. In part based on pilot studies from Skåne University Hospital, a Swedish protocol for treatment of ATC has been defined [Citation1]. The current mainstay is chemoradiotherapy, combining accelerated external radiation therapy and concomitant neoadjuvant chemotherapy. Debulking surgery is performed if the tumour is considered resectable, if the patient is still in good condition after primary treatment, and if distant metastases has not progressed rapidly [Citation1]. The protocol is continuously refined and doxorubicin has recently been replaced by paclitaxel both due to an improved tumour effect as a local radiosensitizer and increased tumour efficacy per se [Citation2]. While this strategy has been successful in decreasing local failure, it has not been shown to prevent or inhibit progression of distant metastases and the survival rates have not increased [Citation1]. Arguably, there is a need for improved strategies, for example, involving optimized treatment combinations or new drugs such as the recently US Food and Drug Administration (FDA) approved combination of dabrafenib and trametinib.
Human cell lines established in vitro, and as xenografts on T-cell deficient nude mice in vivo, are powerful tools for preclinical studies of treatment combinations. In addition, such cell lines may be utilized to study cancer cell characteristics, including signalling pathways and genetic features. Arguably, in order to extrapolate into clinical situations, a panel of cell lines of similar origin is needed. In the literature about 40 cell lines of TC are described [Citation3, Citation4]. However, these have had a widespread use over the last 20 years and half of them may be contaminated with cells of non-thyroid origin [Citation4]. Accordingly, there is a need for new ATC cell lines, well-defined regarding origin and retained original features, but also regarding sensitivity to chemoradiosensitivity.
In this study, we describe the establishment, verification and characterization of a panel of ATC cell lines, as well as the effects on these cell lines of chemo- and radiotherapy.
Material and methods
Study subjects
Patients referred to Skåne University Hospital for primary treatment of ATC between November 2007 and January 2012, were asked for participation in the study (). All patients had a history of a rapidly growing neck tumour at the time of diagnosis and were in a good or fair performance (WHO performance index ≤2). Treatment was given according to the Swedish National Guidelines. The study was approved by the Regional Ethics committee, Lund (522/2008).
Table 1. Patient characteristics and treatment modalities.
Establishment of cell lines
Tissue sampling was performed with conventional fine-needle aspiration technique using a 0.6–0.7 mm needle. The aspirates were directly transferred to R10 medium, i.e. RPMI 1640 with stable glutamine supplemented with 1.0 mmol/L sodium pyruvate, minimum essential medium (MEM) non-essential amino acids, 20 µg/mL gentamicin, and 10% foetal bovine serum all from GE Healthcare (Piscataway, NJ). The suspensions were immediately transferred into cell culture flasks and left to attach and grow at 37 °C under a humidified atmosphere with 5% CO2. The ATC cells grew faster than the fibroblasts and detached from the surface. Therefore, the cancer cells could be sequentially transferred into new flasks without trypsin treatment until visibly free from fibroblasts. The average time from initial seeding to established cell line was 4–5 months (). In the subsequent experiments, the cell lines were always analysed at passage numbers below 20. Mycoplasma tests were negative for all cell lines.
Establishment of xenografts
Experiments on mice were approved by the local ethics committee (488/2017). We used in-house bred, athymic 5 to 8-week-old BALB/c nude (nu/nu) mice. The mice were given food and water ad libitum. Cells were injected subcutaneously into the flank of the animals and the resulting tumours were serially transplanted to new mice.
Immunocytochemistry
Antibodies used were anti-pan keratin (AE1/AE3/PCK26) and anti-thyroid transcription factor-1 (TTF1) (8G7G3/1) from Ventana Medical Systems (Tucson, AZ), anti-PAX-8 polyclonal antibody from Proteintech (Rosemont, IL), and thyroglobulin (TG) (DAK-Tg6) from DAKO/Agilent (Santa Clara, CA).
Single tandem repeat analysis
Single tandem repeat (STR) analysis was performed by Uppsala Genome Center using the AmpFlSTR Identifiler PCR amplification kit (Applied Biosystems, Carlsbad, CA). Separation of DNA fragments was performed with capillary electrophoresis on the ABI3730XL DNA analyzer (Applied Biosystems) and allele scoring was performed with the GeneMapper 4.0 software package (Applied Biosystems).
Mutational analysis
Cell line DNA sequence was determined by sequencing with BigDye Terminator v1.1 Cycle Sequencing Kit (Thermo Fisher Scientific, Waltham, MA) according to the manufacturer’s instructions. Samples were electrophoresed on a 3130xl Genetic Analyzer (Applied Biosystems) and sequence analysis was performed using the DNA sequencing software Sequencher (Gene Codes Corporation, Ann Arbor, MI, USA). Multiplex Ligation-dependent Probe Amplification (MLPA) analysis was performed using the SALSA MLPA probemix P056-B1 TP53 (MRC-Holland, Amsterdam, the Netherlands) according to manufacturer’s instructions. Samples were electrophoresed on a 3130xl Genetic Analyzer (Applied Biosystems) and MLPA analysis was performed using the genotype analysis software Genemarker (SoftGenetics, State College, PA, USA). Furthermore, whole exome sequencing data from Woodward et al. [Citation5] were reanalysed regarding TP53 mutational status using ANNOVAR.
Targeted analysis for the BRAFV600E mutation was done by direct sequencing as described previously [Citation6].
Cytogenetic analysis
For cytogenetic analysis, cells were cultured in DMEM/F12 medium with 10% foetal bovine serum and antibiotics. When the mitotic index was high, cultured cells were exposed to colchicine (final concentration 0.03 µg/mL) for 4–5 h before harvesting. Cells were detached by trypsin EDTA (0.05%) and treated with hypotonic solution (0.06 mol/L KCl) for 35 min. Subsequently, the cells were fixed three times with methanol/acetic acid 3:1. Chromosome preparations were incubated at 60 °C overnight and then treated with 2 × SSC (saline sodium citrate buffer) in 60 °C water bath for 4 h. G-banding was done using Wright’s stain and karyotypes were described according to ISCN 2009. All cell lines were analysed for rearrangements of RET with metaphase fluorescence in situ hybridization according to standard methods, using break-apart probes and a whole chromosome paint probe for chromosome 10 (Abbott Molecular, Des Plaines, IL, USA). A minimum of 20 metaphases were analysed for each cell line.
Determination of treatment sensitivities
For analysis of the growth inhibiting effects of doxorubicin, paclitaxel and vemurafenib, 500–1500 viable cells (depending on cell line) were seeded in 96-well plates. After 48 h, the cells were treated with increasing amounts of the drugs, six wells per concentration. After 4–7 days incubation, depending on the growth rate of the different cell lines, the cell amounts were measured by the sulphorhodamine B (SRB) method. In short, after trichloroacetic acid fixation the cells were stained with SRB, dissolved in 10 mmol/L Tris base and then the absorbance was measured at 570 nm. The data were fitted to a sigmoidal dose-response equation with variable slope using non-linear regression, and the half maximal inhibitory concentration (IC50) values calculated in the GraphPad Prism (5.04) software package (GraphPad Software, La Jolla, CA).
Radiosensitivity
For analysis of the effects of radiation, cells were trypsinized, counted and diluted to 500–1500 viable cells per 100 µL in R10 medium in 1.5 mL microtubes. The cells were irradiated with a Gammacell 2000 (Mølsgaard Medical, Skodsborg, Denmark) from 0 to 32 Gy and then seeded in 96-well plates. After 7 days, the cell amounts were measured with the SRB assay and analysed as detailed under Doxorubicin, calculating the half maximal inhibitory dose (ID50).
Results
Establishment of cell lines
Eight cell lines were established in ten attempts, i.e. from 10 different patients (). The reason for failure in two cases was probably low numbers of viable cells in the aspirates as assessed by microscopic inspection after transfer to cell culture flasks. The median survival of the eight patients from which cell lines were established was 49 (16-107) days after diagnosis, and all received radiotherapy. All cell lines were analysed by STR profiling in early passages using 16 loci in order to facilitate later verification of cell line identity (). No cell line was more than 47% identical to any other in this study and less than 50% identical to any other cell line used in our laboratory (unpublished observation). No match was above 78% when comparing with other analysed cell lines in the DSMZ repository (https://www.dsmz.de). The doubling times of the cell lines were determined (see Supplemental Table 1).
Figure 1. Cells were grown in flask until approximately 50% confluent and photographed using a phase contrast microscope. (A) LU-TC-1, (B) LU-TC-2, (C) LU-TC-7, (D) LU-TC-8, (E) LU-TC-10, (F) LU-TC-12, (G) LU-TC-14, and (H) LU-TC-15. Bars indicate 100 µm.
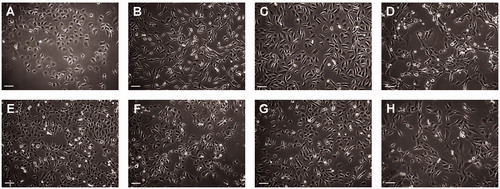
Table 2. STR analysis.
As a consequence of the limited amount of material obtained from the fine needle aspirates, we were not able to perform comparative genetic analyses of the cell lines with their original tumours. To verify that the cell lines originated from ATC, cell pellets were analysed according to morphology and the expression of four different marker proteins by an experienced pathologist (). All cell lines displayed similar morphologies, including large pleomorphic cells with hyperchromatic and clearly atypical nuclei and prominent nucleoli. There were also pleomorphic tumour giant cells with multiple nuclei and numerous (often atypical) mitoses.
Table 3. Cytological and cytochemical characteristics.
Six of the cell lines (LU-TC-2, 7, 8, 12, 14, and 15) were PAX8 positive and two of these (LU-TC-2 and 8) were also focally TTF1 positive supporting a thyroid origin. All cell lines were TG negative and only two (LU-TC-10 and 15) were CK negative (). These results were compared with the corresponding analyses performed on the original diagnostic fine-needle aspirations. For LU-TC-1 and -15, only cytology was performed on the original material. For the other fine-needle aspiration biopsies (FNABs), all analysed marker expressions matched those of the deduced cell lines ().
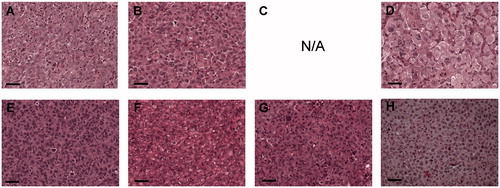
Seven of the cell lines grew as subcutaneous xenografts in nude mice. Only LU-TC-7 resisted all attempts to establish as xenograft. Also in xenografts, the cells displayed an ATC like appearance as stated above, and there were also areas with necrosis and acute inflammation ().
Figure 2. Xenograft tumors were sectioned and stained with hematoxylin and eosin. (A) LU-TC-1, (B) LU-TC-2, (C) N/A due to no xenograft tumor take of LU-TC-7, (D) LU-TC-8, (E) LU-TC-10, (F) LU-TC-12, (G) LU-TC-14, and (H) LU-TC-15. Bars indicate 100 µm.
Karyotype and mutational status
All the cell lines harboured complex karyotypes with modal numbers in the hyperdiploid to near-pentaploid range (). No pattern of specific chromosomal gains or losses was observed. A high number of pericentromeric breakpoints was seen, with 51/123 (41%) breakpoints occurring in chromosomal bands p11-q11.
Table 4. Composite karyotypes.
The cell lines have previously been extensively characterized on the genetic level [Citation5]. In this work we further analysed the mutational status of RET, BRAF and TP53. The cell lines contained 3-6 copies of RET. No rearrangements involving this gene were seen (). Three cell lines, LU-TC-2, LU-TC-8, and LU-TC-15, harboured the BRAFV600E mutation (). Seven of the cell lines had mutations in the TP53 gene, of which five were homozygous, including a homozygous deletion of exon 2-9 in LU-TC-14 (). In addition to the previously reported TP53 mutations reported in Woodward et al. [Citation5], the reanalysis resulted in detection of additional mutations in LU-TC-2 and LU-TC-12 ().
Table 5. Mutation status of TP53, BRAF and RET and sensitivity to doxorubicin, paclitaxel, radiation, and vemurafenib.
Sensitivity to doxorubicin, radiation, paclitaxel and vemurafenib
The cell lines displayed a more than 100-fold difference in sensitivity to doxorubicin with IC50 ranging from 0.42 nmol/L for LU-TC-8 to 46 nmol/L for LU-TC-7 (). For paclitaxel, the difference in sensitivity between cell lines was also over 100-fold between the most and least sensitive cell lines LU-TC-15 and LU-TC-1 with IC50 1.6 and 196 nmol/L, respectively ().
To measure the radiosensitivity of the cells, we chose to use the SRB assay, as clonogenicity of the cell lines is not a prerequisite for this method in contrast to the clonogenic assay. The SRB assay might underestimate cell kill, but is still a reliable method for in vitro comparison of radiosensitivity. The differences in radiation effects were less pronounced than for doxorubicin with a span of ID50 values from 2.6 Gy for LU-TC-1 to 6.3 Gy for LU-TC-14 ().
As three of the cell lines carried the BRAFV600E mutation we also tested the effect of the BRAFV600E specific inhibitor vemurafenib. The wild type cell lines had an average IC50 of 9.6 µmol/L (range: 6.5-12 µmol/L). Two of the BRAFV600E cell lines (LU-TC-2 and 8) had considerably lower IC50 (15 and 5 times lower than the wild type average, respectively), indicating a considerably higher sensitivity against the drug. Interestingly, the third BRAFV600E cell line, LU-TC-15, was as insensitive to vemurafenib as the least sensitive wild type cell lines with an IC50 of 12 µmol/L.
Discussion
Evaluation of treatment combinations are preferably first performed in pre-clinical experimental assays. With such an approach, the contribution to anti-tumour efficacy of each agent of a combination can be identified and form a rationale for treatment schedules, i.e. the order and timing of specific therapies. Also, a large number of combinations and schedules can be tested comparatively quickly. A prerequisite for pre-clinical testing is the availability of panels of well characterized and representative cell lines that can be used in vitro and in vivo, and which can be verified over time and between laboratories. For thyroid cancer, this has so far posed a problem [Citation4], and in this work we therefore established and characterized cell lines using fine-needle aspirates taken from ATC patients.
Eight cell lines were established from ATC tumours. They all displayed ATC-like morphologies and a thyroid origin could be verified by immunohistochemistry for six of them by PAX8 positivity. Two of these cell lines were also focally TTF1 positive, strengthening a thyroid origin claim. The PAX8 and TTF1 negativity of two of the cell lines does not preclude an ATC origin. In fact, the ratio of PAX8 and TTF1 negativity fits well with what has been shown for ATC tumours, where 21% were PAX8 negative and 82% TTF1 negative [Citation7]. Epithelial differentiation was established in six cell lines using CK staining. Two of the cell lines were CK negative, but loss of CK expression is well known in ATC especially in sarcomatoid cases [Citation8]. All cell lines were negative to TG, which is a common finding in ATC [Citation8]. Also, the biomarkers that were analysed in FNABs were identically expressed in the matching cell line. None of the patients included in the study received palliative surgery, which means that there are no histological diagnoses for the original tumours. For cell line LU-TC-1 and LU-TC-10, both PAX8 and TTF1 negative and therefore only being diagnosed on the basis of cytology. However, LU-TC-10 has previously been shown to harbour NRAS and TERT promoter mutations, both relatively common in ATC tumours [Citation5]. Both LU-TC-1 and LU-TC-10 carried deletions in the PTPRD gene similar to 60% of the ATC cell lines [Citation5] and also display homozygous mutations in the TP53 gene () indicating copy-neutral loss of heterozygosity followed by whole-genome doubling as previously suggested for ATC [Citation9]. We conclude that an ATC origin of the cell lines in this study was verified with high certainty.
Only a limited number of karyotypes from ATC have been published previously, in total eight of primary tumours and eight of cell lines [Citation10–12]. In line with our findings, a majority of these have displayed complex karyotypes with near-triploid to near-pentaploid modal numbers, indicating that polyploidization is common in these tumours [Citation10–12]. We detected a high number of pericentromeric breaks in our analysis with 41% of breakpoints occurring in or close to the centromeres, corresponding to a high number of isochromosomes and whole-arm translocations (). This pattern has been previously observed in ATC by Lee et al. [Citation10], and is common in tumours of epithelial origin such as colon cancer and head and neck squamous cell cancer [Citation13]. It has been associated with telomere shortening, anaphase bridges, and mitotic spindle defects, which are hallmarks of chromosomal instability [Citation14]. Thus, our findings indicate that chromosomal instability is a common mutational mechanism in ATC.
The cell lines in this study displayed a large variability in drug sensitivities, with the IC50 for doxorubicin and paclitaxel varying over two orders of magnitude, while the difference in radiosensitivity was less pronounced. The original experimental work, suggesting the use of paclitaxel for treatment of ATC [Citation15], used six cell lines in vitro of which three were later shown not to be ATC cell lines (DRO90-1, KAT4, and ARO81-1) [Citation4]. Indeed, these same three non-ATC cell lines were also used for verification in vivo. The relatively homogenous response of ATC cell lines to paclitaxel reported in that work could therefore be questioned. In contrast our work shows a great heterogeneity in the response to paclitaxel, which is more in line with the reported 47% non-responders in a clinical trial [Citation2]. The lack of correlation between drug sensitivities () suggests that some paclitaxel non-responders may actually do better with doxorubicin.
Figure 3. Comparison between doxorubicin and paclitaxel response, treatment response and TP53 mutational status. (A) The IC50 for doxorubicin was plotted against the IC50 for paclitaxel and the nonparametric Spearman correlation calculated using GraphPad Prism software. (B) For each treatment, the cell lines were grouped according to TP53 status, and the p-values calculated using the nonparametric Mann–Whitney test in the GraphPad Prism software.
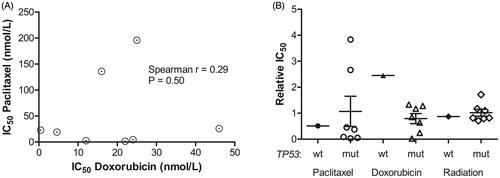
It has been suggested that paclitaxel sensitivity in ATC cells correlates to loss of function of p53 [Citation2]. Only one of our cell lines was TP53 wild type, which precluded a statistical comparison between mutational status and drug sensitivity. The TP53 wild-type cell line showed an approximately average sensitivity to paclitaxel and radiation and a lower than average sensitivity to doxorubicin ().
As mentioned, three out of eight investigated cell lines were revealed to have the BRAFV600E mutation. This is in accordance to previous observations for ATC [Citation16] as well as with reported preclinical [Citation17] and clinical effects of adding BRAF inhibitors to chemotherapy [Citation18]. We investigated the effect of the BRAFV600E specific inhibitor vemurafenib and it was found to have a relatively high inhibitory effect on two of the BRAF mutated cell lines (). However, the third cell line (LU-TC-15) was not affected more than the least sensitive BRAF wild type cell lines. This is consistent with case reports describing both excellent and less successful treatment results using BRAF inhibition [Citation18,Citation19]. Recently, a combination of the BRAF inhibitor dabrafenib and the MEK inhibitor trametinib was shown to have clinical efficacy in ATC [Citation20] and the combination has since then been approved for treatment of ATC by FDA. It is possible that other intracellular signalling inhibitors could be combined with BRAF inhibition to produce a more general effect on BRAFV600E tumours, and this can be tested in future experiments. The established panel of cell lines in this study displayed a large heterogeneity both in genotype and in response to different treatment modalities. A similar heterogeneity is probably to be expected in the clinical setting. By using large panels of well characterized cell lines with verified ATC origin it may be possible to validate different treatment options involving both traditional cytostatic drugs and more innovative approaches in a systematic manner before clinical introduction. For several tumour types, a good correlation between pre-clinical cell and xenograft studies on one hand and clinical performance on the other has been reported when panels of cell lines have been used and for low prevalence cancer types like ATC pre-clinical validation is of great importance given the challenges associated with clinical trials. By using cell lines, it is also possible to perform high quality genome characterization to identify putative target genes [Citation5].
In conclusion, we describe a substantial series of new ATC cell lines demonstrating large heterogeneity in the response to cytostatic drugs as well as the BRAF inhibitor vemurafenib. The observations are of relevance to future attempts to optimize treatment combinations for ATC.
Supplemental Material
Download MS Word (30.7 KB)Supplemental Material
Download JPEG Image (663.9 KB)
Disclosure statement
No potential conflict of interest was reported by the authors.
Additional information
Funding
References
- Tennvall J, Lundell G, Wahlberg P, et al. Anaplastic thyroid carcinoma: three protocols combining doxorubicin, hyperfractionated radiotherapy and surgery. Br J Cancer. 2002;86(12):1848–1853.
- Ain KB, Egorin MJ, DeSimone PA. Treatment of anaplastic thyroid carcinoma with paclitaxel: phase 2 trial using ninety-six-hour infusion. Collaborative Anaplastic Thyroid Cancer Health Intervention Trials (CATCHIT) Group. Thyroid. 2000;10(7):587–594.
- Marlow LA, D’Innocenzi J, Zhang Y, et al. Detailed molecular fingerprinting of four new anaplastic thyroid carcinoma cell lines and their use for verification of RhoB as a molecular therapeutic target. J Clin Endocrinol Metab. 2010;95(12):5338–5347.
- Schweppe RE, Klopper JP, Korch C, et al. Deoxyribonucleic acid profiling analysis of 40 human thyroid cancer cell lines reveals cross-contamination resulting in cell line redundancy and misidentification. J Clin Endocrinol Metab. 2008;93(11):4331–4341.
- Woodward EL, Biloglav A, Ravi N, et al. Genomic complexity and targeted genes in anaplastic thyroid cancer cell lines. Endocr Relat Cancer. 2017;24(5):209–220.
- Davidsson J, Lilljebjorn H, Panagopoulos I, et al. BRAF mutations are very rare in B- and T-cell pediatric acute lymphoblastic leukemias. Leukemia. 2008;22(8):1619–1621.
- Nonaka D, Tang Y, Chiriboga L, et al. Diagnostic utility of thyroid transcription factors Pax8 and TTF-2 (FoxE1) in thyroid epithelial neoplasms. Modern Pathol. 2008;21(2):192–200.
- Miettinen M, Franssila KO. Variable expression of keratins and nearly uniform lack of thyroid transcription factor 1 in thyroid anaplastic carcinoma. Hum Pathol. 2000;31(9):1139–1145.
- Paulsson JO, Backman S, Wang N, et al. Whole-genome sequencing of synchronous thyroid carcinomas identifies aberrant DNA repair in thyroid cancer dedifferentiation. J Pathol. 2019. doi:10.1002/path.5359
- Lee JJ, Foukakis T, Hashemi J, et al. Molecular cytogenetic profiles of novel and established human anaplastic thyroid carcinoma models. Thyroid. 2007;17(4):289–301.
- Roque L, Soares J, Castedo S. Cytogenetic and fluorescence in situ hybridization studies in a case of anaplastic thyroid carcinoma. Cancer Genet Cytogenet. 1998;103(1):7–10.
- Jenkins RB, Hay ID, Herath JF, et al. Frequent occurrence of cytogenetic abnormalities in sporadic nonmedullary thyroid carcinoma. Cancer. 1990;66(6):1213–1220.
- Jin Y, Mertens F, Mandahl N, et al. Chromosome abnormalities in eighty-three head and neck squamous cell carcinomas: influence of culture conditions on karyotypic pattern. Cancer Res. 1993;53(9):2140–2146.
- Guerrero AA, Gamero MC, Trachana V, et al. Centromere-localized breaks indicate the generation of DNA damage by the mitotic spindle. Proc Natl Acad Sci U S A. 2010;107(9):4159–4164.
- Ain KB, Tofiq S, Taylor KD. Antineoplastic activity of taxol against human anaplastic thyroid carcinoma cell lines in vitro and in vivo. J Clin Endocrinol Metab. 1996;81(10):3650–3653.
- Guerra A, Di Crescenzo V, Garzi A, et al. Genetic mutations in the treatment of anaplastic thyroid cancer: a systematic review. BMC Surg. 2013;13(Suppl 2):S44.
- Kurata K, Onoda N, Noda S, et al. Growth arrest by activated BRAF and MEK inhibition in human anaplastic thyroid cancer cells. Int J Oncol. 2016;49(6):2303–2308.
- Rosove MH, Peddi PF, Glaspy JA. BRAF V600E inhibition in anaplastic thyroid cancer. N Engl J Med. 2013;368(7):684–685.
- Marten KA, Gudena VK. Use of vemurafenib in anaplastic thyroid carcinoma: a case report. Cancer Biol Ther. 2015;16(10):1430–1433.
- Subbiah V, Kreitman RJ, Wainberg ZA, et al. Dabrafenib and trametinib treatment in patients with locally advanced or metastatic BRAF V600-mutant anaplastic thyroid cancer. JCO. 2018;36(1):7–13.