
Abstract
Background
The grading of intracochlear endolymphatic hydrops (EH) in Meniere’s disease (MD) varies and lacks uniformity.
Aims
To compare the grading consistency and correlation between different grade methods of intracochlear EH and hearing loss.
Materials and methods
Thirty-one patients diagnosed with MD underwent gadolinium-enhanced magnetic resonance imaging. Two radiologists graded the cochlea EH according to M1, M2, M3, or M4. We analysed the grading consistency and correlation between the EH degrees and hearing loss.
Results
The weighted kappa coefficients for inter-observer and intra-observer agreements for grading using M1 were good, whereas those for M2, M3, and M4 are excellent (all p < 0.001). The cochlear EH degree based on M2 was correlated with the low-to-mid frequencies, high frequencies, full frequencies, and MD clinical stage (all p < 0.05). The degrees based on M1, M3, M4 were only relevant to some of the 4 items.
Conclusions
The grading consistency of M2, M3, M4 is relatively higher than that of M1, and M2 shows the strongest correlation with hearing loss.
Significance
Our results provide a more accurate method for assessing the clinical severity of MD.
Chinese Abstract
背景:梅尼埃病 (MD) 耳蜗内淋巴积水 (EH) 的分级方法有多种多样, 缺乏统一性。
目的:比较耳蜗内淋巴积水和听力损失的不同分级方法之间的分级一致性和相关性。
材料和方法:31 名诊断为 MD 的患者接受了钆强化磁共振成像。 两位放射科医生根据 M1、M2、M3、或 M4进行了耳蜗EH分级。 我们分析了 EH 程度和听力损失之间的分级一致性和相关性。
结果:在观察者间和观察者内对使用 M1 分级的一致性的加权卡帕系数良好, 而使用 M2、M3 和 M4 的分级的加权卡帕系数极佳( p都是<0.001)。 基于 M2 的耳蜗 EH 程度与低到中频率、高频、全频率和 MD 临床分期相关( p都是<0.05)。 基于M1、M3、M4的EH 程度只与 这4 点中的一部分相关。
结论:M2、M3、M4的分极一致性相对高于M1, 且M2 显示出与听力损失的最强相关性。
意义:我们的结果为评估 MD 的临床严重程度提供了一个更准确的方法。
Introduction
Meniere’s disease (MD) is a disorder characterised by endolymphatic hydrops (EH), with associated symptoms including paroxysmal vertigo, fluctuating hearing loss, tinnitus, or a feeling of stuffiness in the ear [Citation1]. Magnetic resonance (MR) is the only way to display EH directly and non-invasively [Citation2]. China incorporated gadolinium imaging into its guidelines for diagnosing and treating MD in 2017 [Citation1]. Subsequently, the EH of gadolinium radiography was used as a basis for diagnosing “Certain” MD in the clinical guidelines of the Japan Balance Research Association [Citation3]. Currently, the main scanning method, both in China and abroad, is three-dimensional fluid-attenuated inversion recovery (3D FLAIR) [Citation4–6]. However, the application of three-dimensional real inversion recovery (3D-real IR) sequences has gradually increased in recent years. The 3D-real IR sequence has the advantage of separating the endolymph, perilymph, and surrounding bone in a single scan [Citation7]. The significance of EH assessment lies in its ability to provide objective imaging evidence of the severity of MD and its regression after treatment, thus improving the accuracy of clinical MD diagnosis. Various EH grading methods have been proposed by researchers [Citation4], and the absence of a unified understanding has resulted in difficulty to compare cochlear EH grading results horizontally. The consistency comparison of these methods in clinical application has not been evaluated, it remains unclear which method is more suitable for clinical dissemination and better reflects the clinical severity of MD. In addition, the methods described in previous studies mainly involved 3D FLAIR, and it is unclear which method is more appropriate for 3D-real IR.
Nakashima et al. [Citation8] evaluated whether Reissner’s membrane is displaced, as well as the area of the cochlear duct and the area of the scala vestibuli. Gürkov et al. [Citation9] (similar to Yang et al. [Citation6]) focused on the appearance of the scala tympani and vestibuli surrounding the dark scala media. Baráth et al. [Citation10] (similar to Bernaerts et al. [Citation11]) examined the degree of dilatation of the endolymphatic space and the presence or absence of the perilymphatic space. In He et al. [Citation12], the evaluation criterion was the degree of scala media expansion and the morphology of the scala media. In this study, we adopted 3D-real IR sequences and referred to the grading methods of cochlear EH proposed by Nakashima et al. (M1) [Citation8], Gürkov et al. (M2) [Citation9] (similar to Yang et al. [Citation6]), Baráth et al. (M3) [Citation10] (similar to Bernaerts et al. [Citation11]), and He et al. (M4) [Citation12] to investigate the consistency of different methods for determining MD cochlear EH. Furthermore, this study explored the correlation between the grade of different methods and the degree of hearing loss to find the most applicable method for relevant clinical diagnostic and therapeutic studies.
Materials and methods
Patients
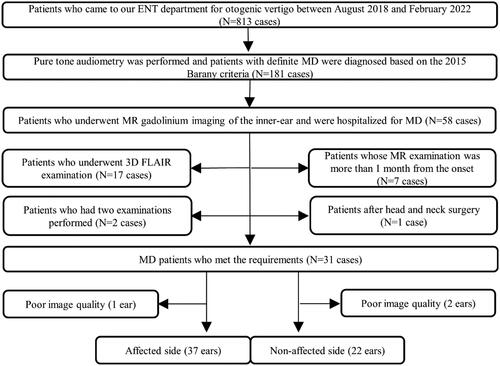
This retrospective study enrolled patients who visited the X Medical University and were diagnosed with MD (2015 Barany criteria [Citation13]) from August 2018 to February 2022. The inclusion criteria were as follows: (1) patients admitted to the hospital for treatment, (2) patients who completed pure tone audiometry (PTA) before endolymphatic sac decompression, and (3) inner ear MR gadolinium imaging based on a 3D-real IR was performed within one month before the endolymphatic sac decompression. The exclusion criteria were as follows: (1) scanning based on 3D FLAIR, (2) patients undergoing repeated examinations (if a patient has had multiple gadolinium angiograms, the most recent one was chosen), (3) patients whose MR examination was > 1 month after the onset of the disease, (4) previous head and neck surgery, and (5) the poor image quality. Thirty-one patients (59 ears) were finally included in the study (). This study adhered to the Declaration of Helsinki, and ethics approval was obtained from the relevant Ethics Committee. Informed consent was obtained from all the patients.
Figure 1. Flow diagram for inclusion and exclusion of eligible patients with MD. ENT: ear, nose, and throat; MD: Meniere’s disease; MR: magnetic resonance; 3D FLAIR: three-dimensional fluid-attenuated inversion recovery.
PTA and clinical staging
Using a Danish Otometrics audiometer (model: Astera), air conduction PTA thresholds at all frequencies were tested (250–8000 Hz), and hearing loss was divided into low-to-mid frequency (LMF) (250–1000 Hz) and high frequency (HF) (2000–8000 Hz) according to the frequency distribution of hearing loss [Citation2,Citation14,Citation15]. The mean PTA thresholds of 500, 1000, and 2000 Hz were used as the hearing thresholds of full frequency (FF). According to the American Academy of Otolaryngology-Head and Neck Surgery guidelines in 1995, the MD clinical stage (MDCS) was as follows: stage I (10–25 dBHL), stage II (26–40 dBHL), stage III (41–70 dBHL), and stage IV (>70 dBHL).
Magnetic resonance imaging (MRI)
After obtaining written informed consent, an otolaryngologist injected a dilution of the contrast agent galadium-diethylenetriamone peta-acetic acid with saline (1:7 mixture) into the patient’s bilateral tympanic chambers via the tympanic membrane and instructed the patient to maintain the head position for 30 min. After 24 h, a temporal bone MRI was performed with a 3.0-T MRI scanner (Prisma, Siemens, Germany), 64-channel coil, and 3D-real IR protocol. The 3D-real IR parameters were as follows: repetition time = 6000 ms, time to echo = 187 ms, inversion time = 1730 ms, slice thickness = 0.8 mm, bandwidth = 501 Hz/Px, echo train length = 124, flip angle (120°), parallel acquisition techniques = 2, matrix 384*384, field of view = 200*200 mm2, and scan time = 6 min 38 s.
Image processing and image analysis
The images were evaluated by two experienced radiologists, with 9 (observer 1) and 12 (observer 2) years of experience, respectively. Observer 2 reconstructed the cross section parallel to the horizontal semi-circular canal, using a General Electric workstation (AW 4.6, GE Healthcare, United States). Furthermore, the thickness of the layer was 0.5 mm and the spacing between the layers was 0.5 mm. Observers 1 and 2 reviewed the images from 3D-real IR sequences and measured the relevant data separately without knowledge of the clinical history. The same physician (observer 2) measured the data again one month later. Cochlear EH was assessed according to the cochlear EH grading methods proposed in 2009 (M1), 2011(M2), 2014 (M3), and 2020 (M4) ( and ). The observer graded at the central level of the cochlear shaft and two adjacent levels above and below it. Inconsistencies were confirmed by consultation with a senior physician.
Figure 2. Evaluation of the five patients(A–E) using four different methods for cochlear EH grading. M1 = Nakashima et al. [Citation8]; M2 = Gürkov et al. [Citation9] and Yang et al. [Citation6]; M3 = Baráth et al. [Citation10] and Bernaerts et al. [Citation11]; M4 = He et al. [Citation12].
![Figure 2. Evaluation of the five patients(A–E) using four different methods for cochlear EH grading. M1 = Nakashima et al. [Citation8]; M2 = Gürkov et al. [Citation9] and Yang et al. [Citation6]; M3 = Baráth et al. [Citation10] and Bernaerts et al. [Citation11]; M4 = He et al. [Citation12].](/cms/asset/7b8c189b-e8c6-4217-8f1f-c6a1f5aff737/ioto_a_2209134_f0002_b.jpg)
Table 1. Four grading methods of cochlear EH.
Statistical analysis
Statistical analyses were performed using Statistical Package for Social Sciences 26.0 (IBM) and Stata/SE 15.0. The Shapiro–Wilk method was used to test the normality of quantitative data, and normally distributed data were expressed as xˉ±s. Non-normally distributed data were expressed as M (Q1, Q3). Qualitative data were expressed as frequencies (composition ratios). Inter-observer and intra-observer consistency for cochlear EH grading was determined using the weighted kappa coefficient. The Kendall W coordination coefficient was used to determine coordination between different methods. These two coefficients were explained as follows: poor (0–0.2), fair (0.2–0.4), moderate (0.4–0.6), good (0.6–0.8), and excellent (0.8–1). The correlation between the grading of cochlear EH and PTA air conduction was tested using Spearman’s correlation. A correlation was interpreted as follows: weak (0.01 ∼ 0.24), moderate (0.25–0.49), strong (0.50–0.74), and very strong (0.75–1). Differences were considered statistically significant at p < 0.05.
Results
Demographic and clinical characteristics of the study population
A total of 31 patients (59 ears) with MD who met the requirements were retrospectively assessed. The patients included 19 (61.30%) females and 12 (38.70%) males, with a mean age of 60 (51,65) years (range: 16–75 years). There were 37 (62.71%) ears on the affected side and 22 (37.29%) ears on the normal side. The cochlea, vestibule, and semi-circular canal were clearly visualised in all enrolled patients.
Consistency analysis
The inter-observer weighted kappa coefficients were 0.72, 0.82, 0.89, and 0.84 for M1, M2, M3, and M4, respectively (). The intra-observer weighted kappa coefficients were 0.77, 0.87, 0.93, and 0.88 for M1, M2, M3, and M4, respectively (). Furthermore, all P values were less than 0.001. The results showed good agreement grade for M1 and excellent agreement for M2, M3, and M4. The Kendall W coordination coefficients were 0.87 and 0.86 for each observer, with both P values being less than 0.001. The results indicated an excellent coordination grade.
Table 2. Inter-observer agreement analysis for M1∼M4.
Table 3. Intra-observer (Observer 2) agreement analysis for M1∼M4.
Correlation analysis
The results of the correlation between the degree of cochlear EH and the LMF, HF, FF, and MDCS for M1, M2, M3, and M4 are summarised respectively in . All four grading methods for cochlear EH showed a better correlation with LMF than HF. Among the four methods for cochlear EH grading, M2 showed a better correlation than the other three methods, especially at HF.
Table 4. The correlation between the degree of cochlear EH for M1∼M4 and the LMF, HF, FF, and MDCS.
Discussion
In this study, we summarized the four currently prevailing methods to assess cochlear EH [Citation16]. Furthermore, we compared the inter-observer and intra-observer agreements of the different methods. The results showed that the inter-observer and intra-observer agreement of M2, M3, and M4 was better than that of M1. Furthermore, the coordination grades were rated as “excellent”. The correlations between the grades of the different methods and LMF, HF, FF, and MDCS were further compared. The results showed that M2 performed better than the other three methods. Therefore, we recommend the use of M2 for evaluating cochlear EH.
This study employed several techniques and methods to achieve more accurate results. First, the drug was administered in the tympanic chamber. Compared to the intravenous method, drug concentrations are lower (diluted to 1/8 of the conventional concentration) when administered via the tympanic chamber, avoiding the problem of gadolinium agent deposition in the brain [Citation16] and providing better imaging results [Citation17]. Second, a 3D-real IR sequence was used. Compared to conventional 3D FLAIR, the 3D-real IR sequence can differentiate between the perilymph (high signal), bone tissue (equal signal), and endolymph (low signal) using less contrast agent, thus allowing for a more accurate assessment of EH [Citation15,Citation16]. Third, standardised reconstruction along the horizontal semi-circular canal was performed, so as to avoid a reduction in the stability of the assessment method due to different scanning baselines in different patients. Additionally, observation was performed at the central level of the cochlear shaft and the two levels adjacent to it above and below, in order to avoid inaccurate grading at the edge of the cochlea, unify the observation angle and level, and improve the consistency and accuracy of the EH grading.
Although previous studies have explored various methods for assessing EH [Citation4,Citation16,Citation17], there is a lack of comparison regarding the consistency between these methods. In this study, we conducted a cross-sectional comparison of the four mainstream methods. Subsequently, the results showed that M2, M3, and M4 had better inter-observer and intra-observer agreement. The reason for this result may be that the three methods provide a clearer description of the specific criteria for cochlear EH grading, reducing subjectivity. The reason why M1 is lower than M2-M4 may be due to the diagnostic criterion of “Reissner’s membrane displacement” being more subjective, as it is not directly visible on the image.
The United States MD clinical practice guidelines [Citation18] suggest that low-frequency hearing loss is most prominent in the early stages of MD. Furthermore, the guidelines also suggest that HF hearing loss can occur in the later stages of the disease. A recent study in 2022 [Citation15] showed that patients with early involvement of the top turn of the cochlea in MD mainly exhibited low-frequency hearing loss. Subsequently, as the disease progressed, cochlear middle and bottom turn involvement led to progressive impairment of HF hearing. Our findings also suggest that LMF hearing loss appears earlier than HF hearing loss and shows a higher correlation. In terms of cochlear EH, scholars have proposed many different methods in the last decade [Citation4], most of which used the classic three-level scale (M1) developed by Nakashima et al. in 2009 [Citation19]. Subsequently, different scholars proposed M2, M3, and M4 in 2011, 2014, and 2020, respectively. However, there is no consensus on which method is best. In this study, the four grading methods were correlated with LMF, HF, FF, and MDCS in an attempt to investigate a more optimal grading method. The results showed that the cochlear EH grading of M2 correlated better than the other three methods. This finding may be due to the lack of representativeness and objectivity of the M1 classification [Citation20]. However, cochlear duct dilatation may also occur in healthy populations, as confirmed by a histopathological study [Citation17]. Second, while M3 is also a three-level scale, “level 2” is more strictly limited than M1, and only 5.40% (2/37) of the patients in this study were rated as “level 2”, which may be one of the reasons for the reduced correlation between M3 classification and the degree of hearing loss. Third, Gürkov et al. [Citation9] (similar to Yang et al. [Citation6]) proposed a new four-level scale (M2) that increased the number of gradations while clearly defining the performance of different cochlear EH grades. The new four-level scale facilitates a more accurate assessment of different degrees of cochlear EH, which can be matched to different degrees of hearing loss. Fourth, compared with M2, M4, which is also a four-level scale, has a stricter definition of “level 2”, resulting in a relatively smaller proportion of “level 2” cases, which may lead to a lower correlation between the M4 classification and the degree of hearing loss, primarily with regard to HF. Therefore, based on the correlation between the grade of cochlear EH and hearing loss, we recommend the use of M2 in this context.
Our study has some limitations. First, the sample size of this study was small. Furthermore, the results may have been biased by the change in sample size. Second, compared with previous 3D-real IR studies, this study used a parallel acquisition technique, which shortened the scanning time and might have reduced the image quality. However, the image quality of this study did not affect the results of the analysis. Third, this study only examined different methods of cochlear EH, and the correlation between the grading methods of different EH sites (such as vestibular EH) and hearing loss needs to be further explored.
Conclusions
The consistency levels of M2, M3, and M4 were shown to be excellent and higher than that of M1 in this study; therefore, the former are more suitable for clinical application. The M2-based grading method showed a relatively good correlation with the degree of hearing loss and is recommended for relevant clinical diagnostic and therapeutic studies.
Ethical statement
This study adhered to the Declaration of Helsinki, and ethics approval was obtained from the Ethics Committee of Beijing Friendship Hospital, Capital Medical University (No. 2022-P2-259-02). Informed consent was obtained from all the patients.
CRediT authorship contribution statement
Zhihao Han: Conceptualisation, Methodology, Data curation, Writing-original draft.
Xiaoyu Qiu: Conceptualisation, Data curation, Visualisation, Investigation.
Yan Huang, Qian sun, Heyu Ding, Jing Xie, Jingying Guo, Yutong Yang, Yuhe Liu, Shusheng Gong: Conceptualisation, Data curation, Formal analysis.
Pengfei Zhao, Zhenchang Wang: Supervision, Project administration, Conceptualisation, Methodology, Writing-review & editing.
Disclosure statement
No potential conflict of interest was reported by the author(s).
Data availability statement
The research data is confidential.
Additional information
Funding
References
- Jin X, Kong W, Leng Y, et al. Guideline of diagnosis and treatment of Meniere disease (2017). [article in Chinese]. Chin J Otorhinolaryngol Head Neck Surg. 2017;52:167–172.
- Sun Q, Jiang G, Xiong G, et al. Quantification of endolymphatic hydrops and its correlation with Meniere’s disease clinical features. Clin Otolaryngol. 2021;46(6):1354–1361.
- Iwasaki S, Shojaku H, Murofushi T, et al. Diagnostic and therapeutic strategies for Meniere’s disease of the Japan society for equilibrium research. Auris Nasus Larynx. 2021;48(1):15–22.
- Zanetti D, Conte G, Scola E, et al. Advanced imaging of the vestibular endolymphatic space in meniere’s disease. Front Surg. 2021;8:700271.
- Barlet J, Vaussy A, Ejzenberg Y, et al. Optimized 3D-FLAIR sequences to shorten the delay between intravenous administration of gadolinium and MRI acquisition in patients with Meniere’s disease. Eur Radiol. 2022;32(10):6900–6909.
- Yang S, Zhu H, Zhu B, et al. Correlations between the degree of endolymphatic hydrops and symptoms and audiological test results in patients with Meniere’s disease: a reevaluation. Otol Neurotol. 2018;39(3):351–356.
- Liu F, Chen Q, Fang Z, et al. The consensus of Chinese experts on evaluation of endolymphatic hydrops in the inner ear using MRI. [Article in Chinese]. Chin J Otorhinolaryngol Head Neck Surg. 2020;55:809–813.
- Nakashima T, Naganawa S, Pyykko I, et al. Grading of endolymphatic hydrops using magnetic resonance imaging. Acta Otolaryngol Suppl. 2009;129(sup560):5–8.
- Gürkov R, Flatz W, Louza J, et al. In vivo visualization of endolyphatic hydrops in patients with Meniere’s disease: correlation with audiovestibular function. Eur Arch Otorhinolaryngol. 2011;268(12):1743–1748.
- Baráth K, Schuknecht B, Naldi AM, et al. Detection and grading of endolymphatic hydrops in Meniere disease using MR imaging. AJNR Am J Neuroradiol. 2014;35(7):1387–1392.
- Bernaerts A, Vanspauwen R, Blaivie C, et al. The value of four stage vestibular hydrops grading and asymmetric perilymphatic enhancement in the diagnosis of Meniere’s disease on MRI. Neuroradiology. 2019;61(4):421–429.
- He B, Zhang F, Zheng H, et al. The correlation of a 2D volume-referencing endolymphatic-hydrops grading system with extra-tympanic electrocochleography in patients with definite meniere’s disease. Front Neurol. 2020;11:595038.
- Lopez-Escamez JA, Carey J, Chung WH, et al. Diagnostic criteria for Menière’s disease. J Vestib Res. 2015;25(1):1–7.
- Yang CJ, Yoshida T, Sugimoto S, et al. Lesion-specific prognosis by magnetic resonance imaging in sudden sensorineural hearing loss. Acta Otolaryngol. 2021;141(1):5–9.
- Niu Y, Chen W, Lin M, et al. Development and characteristics of hearing loss with the progression of endolymphatic hydrops. Ear Nose Throat J. 2022;:014556132211010.
- Liu Y, Pyykkö I, Naganawa S, et al. Consensus on MR imaging of endolymphatic hydrops in patients with suspected hydropic ear disease (Meniere). Front Surg. 2022;9:874971.
- Eliezer M, Attyé A, Toupet M, et al. Imaging of endolymphatic hydrops: a comprehensive update in primary and secondary hydropic ear disease. J Vestib Res. 2021;31(4):261–268.
- Basura GJ, Adams ME, Monfared A, et al. Clinical practice guideline: meniere’s disease. Otolaryngol Head Neck Surg. 2020;162: s 1–S55.
- Kahn L, Hautefort C, Guichard JP, et al. Relationship between video head impulse test, ocular and cervical vestibular evoked myogenic potentials, and compartmental magnetic resonance imaging classification in Meniere’s disease. Laryngoscope. 2020;130: e 444–E452.
- Han SC, Kim YS, Kim Y, et al. Correlation of clinical parameters with endolymphatic hydrops on MRI in Meniere’s disease. Front Neurol. 2022;13:937703.