
Abstract
Background
The pathway by which drugs are injected subcutaneously behind the ear to act on the inner ear has not been fully elucidated.
Objectives
To compare the uptake of gadopentetate dimeglumine (Gd-DTPA) and dexamethasone (Dex) in the cochlea and facial nerve of rats following different administrations.
Materials and methods
Magnetic resonance imaging was applied to observe the distribution of Gd-DTPA in the facial nerve and inner ear. We observed the uptake of Dex after it was injected with different methods.
Results
Images of the intravenous (IV) and intramuscular (IM) groups showed that the bilateral cochlea of the rat was visualized almost simultaneously. While in the left post-auricular (PA) injection group, it was asynchronous. The maximum accumulation (Cmax) of the Gd in the left facial nerve of the PA group (35.406 ± 5.32) was substantially higher than that of the IV group (16.765 ± 3.7542) (p < .01).
Conclusions
Compared with systemic administration, PA has the advantages of long Gd and Dex action time and high accumulation concentration to treat facial nerve diseases.
Significance
The distribution of Gd and Dex in the inner ear and facial nerve of rats following PA injection might be unique.
背景
药物通过耳后皮下注射作用于内耳的途径尚未得到完全阐明。
目的
在不同给药后, 比较大鼠的耳蜗和面神经中钆喷酸二葡胺 (Gd-DTPA) 和地塞米松(Dex)的吸收。
材料与方法
应用磁共振成像观察Gd-DTPA 在面神经和内耳中的分布。 我们观察用不同的方法注射 Dex 后的吸收情况。
结果
静脉注射(IV)组和肌内注射(IM)组的图像显示大鼠双侧耳蜗几乎可以同时观察到, 而在左耳后(PA)注射组中, 却是异步的。 PA组左侧面神经Gd最大累积量(Cmax)(35.406 ± 5.32) 显著高于 IV 组 (16.765 ± 3.7542) (p < .01)。
结论
与全身给药相比, PA具有Gd和Dex作用时间长、积累浓度高的优点, 可治疗面神经疾病。
意义
PA注射后大鼠内耳和面神经中Gd和Dex的分布可能是独特的。
Introduction
Several inner ear or facial nerve diseases require drug administration, and glucocorticoids are one of the most commonly used drugs [Citation1,Citation2]. The major modes of administration are systemic and intratympanic (IT) injections [Citation3].
The intravenous (IV) delivery is less invasive, does not depend on the state of the round window (RW) membrane, and is more evenly distributed in the inner ear [Citation4]. However, the blood–labyrinth barrier, as a barrier in the ear, limits the amount of drugs circulating through the blood to the inner ear, making it difficult to achieve effective drug concentrations at the target location [Citation5]. IT administration has some advantages, such as directly allowing the drugs to concentrate in the inner ear, thereby lowering their distribution in other systems and reducing toxic side effects [Citation6]. Currently, clinicians can effectively control the speed and dosage of drugs [Citation7]. However, this invasive method is associated with inevitable risks and may increase the likelihood of complications such as tympanic membrane perforation, damage to the auditory ossicle chain and the membrane of the RW [Citation8]. It can also cause temporary conductive hearing loss [Citation9].
Postauricular injection is a new approach that offers lower side effects and delivers more drug to the target sites. As early as 2015, the Chinese Otolaryngology Academic Organization issued guidelines for the treatment of sudden deafness, which recommended the application of postauricular corticosteroids for patients who could not recover from systemic corticosteroids. Multiple clinical trials have proved that PA injection has achieved good therapeutic effects. Postauricular injection is now widely used in China, and the clinical application rate even exceeds that of IT injection [Citation10].
Unfortunately, the pathway by which the drug is injected subcutaneously behind the ear to act on the inner ear has not been fully elucidated. Several hypotheses have been proposed by researchers. One is that after injection, the drugs may enter the inner ear through a local circulatory route. Moreover, there are also some hypotheses [Citation11], including retroauricular veno-systemic circulation-cochlear pathway or anatomic space – middle ear – RW membrane pathway.
There is also a specific hypothesis that the drug enters the cochlea through the facial nerve canal, either via the stylomastoid foramen or via the sensory branch of the facial nerve (postauricular). The facial nerve is accompanied laterally by the auditory nerve (vestibulocochlear nerve), which enters the internal auditory canal (IAC). Part of the facial nerve runs in a long, narrow, tortuous and rigid facial canal. After exiting from the stylomastoid foramen, a single branch is given off as a sensory branch to the external acoustic meatus and tympanic membrane [Citation12]. Due to its superficial running and special anatomical position, we designed a series of experiments to comprehensively reveal the distribution of drugs in the cochlea and facial nerve following PA, and explore the possible action routes.
A study of the pharmacokinetic characteristics of drugs entering the inner ear can provide a reliable experimental basis for the understanding of diseases. In this study, we compared the uptake of Gd in different parts of the inner ear and facial nerve as reported by MRI after Gd was injected in different ways. We also injected dexamethasone (Dex) (the most commonly used drug for treating otological disorders) in rats and measured Dex uptake in the facial nerve and cochlea using immunohistochemistry.
Materials and methods
Study design
In the present study, first we observed the dynamic distribution of Gd using different administrations in rats’ facial nerves and inner ear under a 9.4 T magnetic resonance scanner with gadopentetate dimeglumine (Gd-DTPA) (Magnevist). Second, we used immunofluorescence technology for a semi-quantitative analysis of Dex distribution in the facial nerve and cochlea following diverse injection modalities.
Animals
Male Wistar rats weighing 250–300 g were purchased from the Beijing Weitonglihua Experimental Animal Company (Beijing, China). All animal care and experimental procedures were approved by the Peking University People’s Hospital Institutional Animal Care and Use Committee (2021PHE019), and were conducted in accordance with internationally accepted guidelines. Prior to the first experimental procedure, the rats were maintained in cages with constant temperature and humidity (temperature 24 ± 1 °C and 60% humidity) for seven days, with a 12-h light/12-h dark cycle. We ensured adequate food and water. At baseline, all rats had normal tympanic membranes and hearing levels, as measured by otoscope and auditory brainstem responses.
MRI
All MRI experiments were performed using a 9.4 T magnetic resonance scanner (Bruker BioSpin MRI, Karlsruhe, Germany) with Bruker’s 86-mm volume coil for transmission and a 2-cm diameter single loop surface coil for receiving (Para Vision Version 6.0.1 for MRI acquisitions). We randomly assigned 16 rats into four groups (four each), namely the tail vein injection (IV) group, left hip muscle injection (intramuscular, IM) group, left post-auricular (PA) injection group, and control (CO) group. Prior to the start of the MRI scanning, 4% isoflurane was used for induction of anesthesia. Then, rats are rapidly transferred to an MRI compatible rig in the prone position. Two to three percent isoflurane was used to maintain anesthesia. The criteria of satisfactory anesthesia were as follows: slow and steady breathing and the disappearance of pain and corneal reflex. The body temperature, respiration and blood oxygen saturation of the rats were monitored, all within the normal range.
To make the cochlea appear in the center of the magnet, we first used the 2D heavily T2-weighted imaging sequence. The acquisition parameters were as follows: fast spin echo; repetition time, 2200 ms; echo time, 33 ms; slice thickness, 0.5 mm; and matrix size, 192 × 192.
We acquired 2D T1-weighted images using a fast spin echo sequence with the following acquisition parameters: repetition time, 579.2 ms; echo time, 5.4 ms; slice thickness, 0.6 mm; the number of averages, 8; acquisition matrix, 256 × 256; field of view, 35 × 25 mm2; and scan duration, 3 min and 42 s. All rats were scanned at baseline before being injected with the contrast agent. The contrast agent was gently injected within 30 s to avoid the movement of the rats and position deviation. We performed scanning every 10 min until 5 h post-injection, with a total of 31 scans.
We used the Image J software (Bethesda, MD) to extract the gray values of T1-weighted images at different time points of the vestibular organs (vestibular ampulla), cochlea (basal, middle, and apical cochlear turns) and facial nerve. We captured five pixels from each region of interest (ROI), compared the signal intensity after contrast injection with the baseline values, and calculated the average of signal enhancement. The edge of the images was avoided to the maximum extent possible. The image evaluation was performed in consensus by two radiologists, respectively. Moreover, we plotted the signal change curve chart to obtain the distribution of the contrast agent in different parts.
Immunohistochemistry
According to the MRI analysis, we divided 72 rats into four groups (18 rats in each), namely the CO group, IV group, IM group and PA group. However, considering different physical properties of Dex and Gd contrast agent, we collected the samples at 30 min, 1 h, 2 h, 3 h, 4 h, and 6 h post-injection, based on our previous research [Citation11]. Dex was dissolved in 1% dimethyl sulphoxide at a concentration of 10 mg/ml. According to previous data from our experimental group, the dose of injection was 1 ml/kg. The CO group received a tail vein injection of normal saline (1 ml/kg). Following deep anesthesia with 1% sodium pentobarbital, the rats were subsequently decapitated at each selected point.
Facial nerve samples preparation
We cut the skin and subcutaneous tissue in a circular manner along the base of the neck, and bluntly dissected the two sides and cephalad until the mastoid of the temporal bone was completely exposed. We could observe the major trunk of the facial nerve and the posterior auricular branch. This dissection completely exposed the skull approximately 0.5 cm around the stylomastoid foramen. The electric drill used a fine grinding head to continuously alter the grinding direction with the course of the facial nerve, thus avoiding the nerve trunk and preventing damage until all segments of the temporal bone of the facial nerve were entirely exposed. We carefully dissected the middle 3–4 mm of the facial nerve within the facial nerve canal segment.
The tissue was soaked in 4% paraformaldehyde (PFA) overnight in a 4 °C refrigerator. Following dehydration in a gradient of sucrose solution and embedding in optimal cutting temperature (OCT) compound, the samples were placed in a cryostat and sliced. One piece was collected for every eight pieces with a thickness of 8 μm. We stored the collected samples in a refrigerator at −20 °C.
Dex primary antibodies were diluted 1:250, whereas anti-neurofilament heavy polypeptide antibodies were diluted 1:3000 in 10% normal goat serum (NGS). We applied 0.5% Triton X-100 to the sectioned tissues and incubated them overnight at 4 °C. Goat anti-rabbit 488 and goat anti-chicken 555 secondary antibodies were diluted 1:500 in 10% NGS and incubated at 37 °C for 1 h. The sections were rinsed and co-labeled with 4′,6-diamidino-2-phenylindole.
Cochlear sample preparation
Following the removal of temporal bones, we fully exposed the cochlea and vestibular apparatus. We removed the ossicles under a microscope and created small perforations in the apex and RW. The prepared samples were fixed in 4% PFA for 24 h, after which they were decalcified in 10% ethylenediaminetetraacetic acid for three days. Following dehydration in a gradient of sucrose solution and embedding in OCT compound, the samples were placed in a cryostat and sliced. We collected one piece for every eight pieces with a thickness of 8 μm. Store the collected samples in a −20 °C refrigerator and wait for immunofluorescence staining. The remaining steps were similar to that for the preparation of the facial nerve samples, except that anti-NF antibodies and goat anti-chicken 555 secondary antibodies were not added.
All immunolabeled tissues were imaged using a Zeiss Axio Observer Z1 microscope (Oberkochen, Germany). To avoid intergroup differences due to the scanning process, the laser and scan parameter settings were always consistent. An outline was drawn around each cochlear and facial nerve subsites (the ROI) and mean grey intensity measured, along with several adjacent background readings. The mean grey value per subject for each subsite was calculated as a function of ROI mean grey value-background mean grey value.
Statistics analysis
The Shapiro–Wilk test was performed to determine whether the data obtained were normal distribution. We calculated mean signal intensity levels, and used the independent-sample t-test to measure significance. p < .05 was considered significant (IBM SPSS Statistics, v. 25, 64-bit edition for Windows, Armonk, NY).
Results
MRI-based dynamic distribution of Gd in rat facial nerve and inner ear
depicts changes in signal value of the facial nerve within 5 h after the injection of the contrast agent. Comparing the accumulation of the Gd in the left facial nerve following different injection methods, the Cmax of the PA group was substantially higher than that of the IV group. Gd concentration in the left facial nerve tube reached its peak within 20 min and 80 min post-injection in the IV and PA groups, respectively.
Figure 1. The growth in signal intensity of the left facial nerve post different administrations. Cmax: maximum concentration; #: Cmax IV (16.765 ± 3.7542) vs. Cmax PA (35.406 ± 5.32), p < .01.
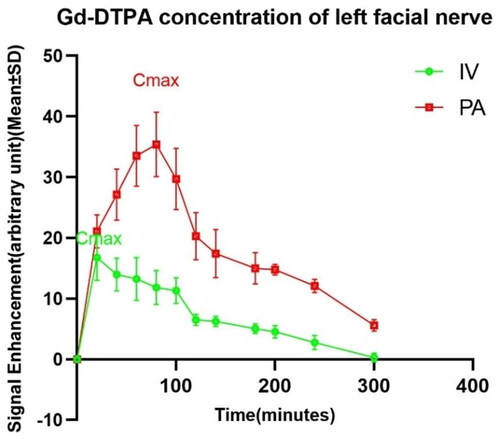
Figure S1 depicts changes in facial nerve imaging post-injection in the PA group. The Gd concentration in the basal turn of the cochlea did not reach a maximum value when the signal intensity in the facial nerve was at its highest.
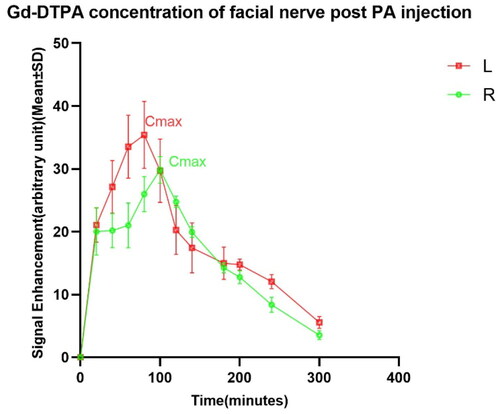
In , it can be observed that the rate of Gd uptake by the left and right facial nerves in the PA group was not the same. The left side reached its maximum at 80 min post-injection (Cmax = 35.406 ± 5.320), and the right side took 100 min (Cmax = 29.843 ± 2.106). Based on the changes in the scanned images of the facial nerve, we can find that the uptake of Gd in the PA group was significantly higher than that in the IV group. Moreover, there was a statistical difference in the rate and the amount of gadolinium uptake between the left and right facial nerves in the PA group.
Figure 2. The growth in signal intensity of the facial nerve in group PA. Cmax: maximum concentration; #: Cmax L (35.406 ± 5.32) vs. Cmax R (29.843 ± 2.106), p < .05.
Meanwhile, we observed the distribution characteristics of Gd in different parts of the cochlea and vestibule following different administrations over a period of time (). Images of the bilateral cochlea appeared simultaneously in groups IV and IM, and the intensity of scala tympani (ST) signal peaked 80 min and 100 min following injection, respectively. Considering the substance should be absorbed from the muscle before entering the blood circulation, the cochlear enhancement time in the IM group was delayed by approximately 30 min, compared with the IV group. However, the cochlea in the PA group were observed 20 min after injection, and the signal intensity increased for the next 240 min. The bilateral cochlea reached the maximum signal value at different times, and the right side was delayed by approximately 40 min, compared with the left side.
Figure 3. The growth in signal intensity of basal turns post different injections. Cmax: maximum concentration; #: Cmax IV (9.9404 ± 0.7991) vs. Cmax IM (3.9198 ± 1.09) vs. Cmax PA (12.057 ± 3.376), p < .05; **p < .01.
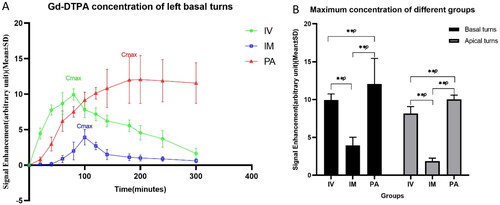
The velocity and quantity of contrast agent entering each part of the cochlea and vestibular apparatus were different, and the Gd distribution continuously increased in a certain period. The concentration was the highest in the basal turns, which was substantially correlated with the concentration in the vestibular area.
Upon comparing the accumulation of Gd in the cochlear basal turns following three different groups, the concentration was the highest in the PA group, followed by the IV group. The maximum value of Gd was the lowest in the IM group. Meanwhile, IV was significantly more effective than IM, in terms of both maximum concentration and the duration of action. The signal intensity of the IV and IM groups dropped immediately after reaching the maximum, forming a peak. However, the signal intensity of the PA group showed a relatively gentle downward trend after reaching the maximum.
Distribution of Dex in the facial nerve and cochlea
Upon comparing the accumulation of Dex in the facial nerve in different groups, its concentration reached the maximum value in the IV and PA groups within 1/2 h and 3 h, respectively ().
Figure 4. Dynamic curve of Dex distribution in the facial nerve. (A) Cmax: maximum concentration; #: Cmax IV (5.693 ± 0.114) vs. Cmax PA (6.194 ± 0.180) vs. Cmax IM (3.033 ± 0.102), p < .01. (B) Cmax: maximum concentration; #: Cmax L (6.194 ± 0.180) vs. Cmax R (5.700 ± 0.313), p < .05.
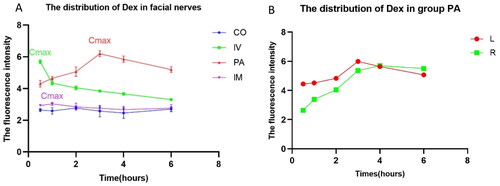
Following the subcutaneous injection of Dex behind one ear, the contralateral (Cmax R (5.700 ± 0.313)) concentration was not as high as that on the injected side (Cmax L (6.194 ± 0.180)); nonetheless, it was considerably higher than that in the IV group (Cmax IV (5.693 ± 0.114)). Furthermore, the accumulation time in the facial nerve was longer. As substantially different molecular weight and polarity of Gd-DTPA and Dex, their distribution trends in the facial nerves were relatively inconsistent. Contrarily, the PA group performed significantly better than the IV group, both in terms of maximum concentration and duration of maintenance. Therefore, PA injection may have high application value in the diagnosis and treatment of facial nerve diseases.
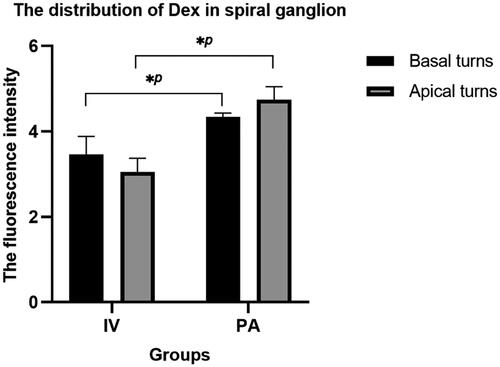
As shown in , the fluorescence intensity of Dex in the spiral ganglions of the PA group was higher than that of the IV group upon reaching the maximum concentration in the facial nerve. Spiral ganglion Dex concentration in the IV group was higher in the basal turns than those in the apical turns and vice versa in the PA group.
Figure 5. The distribution of Dex in spiral ganglions at maximum concentration. *p < .05.
Discussion
We comprehensively applied 9.4 T MRI and immunofluorescence technology to illustrate the distribution of Gd and Dex with different physical properties and molecular weights in the cochlea and facial nerve following different delivery. When compared with the IV group, we found that Gd had a higher concentration and longer duration of action on the facial nerve in the PA group. Scanning images of the facial nerve showed more complete visualization in the PA group, with complete visualization on the injection side preceding the contralateral side. Furthermore, the distribution characteristics of Dex corroborate with Gd. When the concentration of Dex uptake by the facial nerve reached the maximum, the signal density of the spiral ganglion showed that the concentration was higher in the PA group.
The course, companionship and branching structure of the facial nerve are complex. Within the temporal bone, the facial nerve runs inside the IAC. In the IAC, the two branches of the facial nerve accompany the vestibulocochlear nerve and the labyrinthine artery. And then, the facial nerve enters the face tube. Here, the nerve has a very tortuous Z-shaped course (consisting of the labyrinthine, geniculate, tympanic and mastoid segments) [Citation13]. This segment is the most common injury site of the facial nerve and the edematous injury is severe. After exiting the temporal bone from the stylomastoid foramen, the facial nerve branches behind the ear. The injection site for postauricular administration is the body projection surface of the sieve area of the mastoid, i.e. the plane of the external auditory canal behind the ear, 0.5–1.0 cm lateral to the posterior ear sulcus. This injection site coincides with the segment of facial nerve from the stylomastoid foramen to the parotid gland. Therefore, the facial nerve is likely to serve as a connecting bridge from the subcutaneous tissue behind the ear to the cochlea and vestibule. Our findings confirm this.
For the same dose, the perilymph in the IM group had the lowest uptake dose of Gd. This finding indicated that Gd could successfully penetrate across the blood–labyrinth barrier and be ingested following IM, but at very low doses. Compared with IM group, the maximum concentration of Gd was higher and the time of Gd to the inner ear was shorter in IV group. This may because following IV, Gd can enter the blood circulation directly. In the selected time, the highest uptake of Gd in the perilymphatic fluid was in the PA group, followed by the IV group, and the lowest was the IM group. Bilateral cochleae were visualized simultaneously in both IV and IM groups. The Gd appearance time of control side in PA group appeared 40 min later than that of the injected side. These suggest that Gd enters the inner ear following PA in a route different from blood circulation.
Enhanced MRI is increasingly applied as a valuable tool for exploration of the inner ear [Citation14,Citation15] and facial nerve. However, it remains challenging to select the appropriate injection method to efficiently deliver therapeutic agents to the cochlea, vestibular apparatus, and facial and auditory nerves. In case of systemic injection, drug concentrations in the cochlea are extremely low owing to the restricted diffusion of the RW membrane and the poor permeability of the blood–labyrinth barrier [Citation16]. Numerous compounds that act on the inner ear and facial nerve are under clinical investigation [Citation3,Citation17], including traditional and emerging drugs and therapies, such as corticosteroids, growth factors, and genetic material delivery. Dozens of bio-companies are working on experimental compounds for related diseases [Citation18]. However, the aforementioned efforts are limited because we cannot precisely deliver these agents into the cochlea.
Both IT and PA are local ear injections. The drug is distributed bilaterally in the inner ear and facial nerve after injection via PA. This method requires only a unilateral injection of the drug, and the drug reaches a relatively high concentration in the contralateral inner ear. Previous literature has noted that after injection of drug into the unilateral tympanic cavity, the drug accumulates more in the inner ear on the injected side, with only a small amount of drug diffusing to the contralateral middle and inner ear. And this phenomenon may be caused by the Eustachian tube route or the connection between the perilymph and cerebrospinal fluid from the cochlear aqueduct [Citation8]. The drug usually accumulates in the basal turns, with less distribution in the apical turn and a clear basolateral-apical concentration gradient [Citation19]. Our results demonstrated that Gd concentrations were average in the cochlea in the PA group, without an apparent concentration gradient.
IT injection was directly administered. The primary routes from the tympanic cavity to the cochlea and vestibular apparatus are RW and oval windows [Citation20]. Potential risks, such as suppurative otitis media and the perforation of the tympanic membrane, may aggravate middle ear inflammation. Moreover, certain substances may be rapidly lost through the eustachian tube, thus leading an increase in the actual dosage.
Facial paralysis is an important disease because it substantially increases psychological and emotional issues in patients. Bell’s palsy (BP) is the most common cause of acute unilateral nerve palsy. In 2013, clinical practice guidelines strongly recommend that patients aged >16 years old use steroids as treatment within 72 h of symptom onset. Our findings revealed that PA injection resulted in greater redistribution of the drug to the facial nerve and longer duration of action, compared with traditional systemic administration. Therefore, steroid injection behind the ear may be a novel treatment for BP.
The drug should initially penetrate the skin and mucous membrane behind the ear, followed by its distribution to the posterior auricular branch of the facial nerve; nonetheless, the operation is simple and convenient. PA is more acceptable for patients requiring long-term treatment.
Gd contrast agents accumulate in the body following injection, such as in the bones, brain, and kidneys. This warrants particular attention to the use of contrast agent doses in persons with renal disease and with a lower metabolic rate. We previously compared the pharmacokinetic characteristics of the drug in sigmoid sinus blood and systemic blood following PA and systemic administration. The drug maintained a low concentration in systemic blood. Our findings demonstrated that compared with the IV group, the substance had a higher concentration and longer duration of action on the cochlea in the PA group. Post-auricular administration can reduce the possibility of side effects caused by systemic delivery and further maintaining the high concentration in long period. Therefore, this mode of administration adds a novel option for the diagnosis and treatment in clinic.
Definitely, our studies have certain limitations. Taking into account a number of factors, including the anesthetic dose, body temperature of rats, scan angle deviations due to position changes, and the overheating of the scanning machine, the scanning time was set within five hours. Since the size and anatomical structure of rats are quite different from those of the human, we should choose animal models that are more similar to the human in the future, such as miniature pigs.
Conclusions
The content mainly detailed the distribution of Gd and Dex in the cochlea and facial nerve, which may be the first time to compare the distribution of the substances in these areas by comparing PA and systemic administration. Compared with IV injection, PA has the advantages of long Gd and Dex action time and high accumulation concentration to treat facial nerve diseases. The structure and branches of the facial nerve may be a bridge between the inner ear and the injection site for PA administration. One of the keys to the successful development of targeted drugs for diseases of the inner ear and facial nerve is a clear understanding of the parameters and variables of the target site uptake of the agents. Our study provides theoretical support for clinicians’ choice of medication.
Author contributions
Xing Jin: overall design, data processing and text writing of the study. Yixu Wang: design of the study and revision of the article. Liyuan Zhang: partial conduction of animal experiments. Hongwei Zheng: design of the partial study and revision of the article. Xin Ma: design of the partial study and revision of the article. Lisheng Yu: overall design of the study and revision of the article. Maoli Duan: design of the study and revision of the article.
Supplemental Material
Download Zip (3.1 MB)Acknowledgements
The authors would like to thank Magnetic Resonance Imaging Research Center of Peking University for the assistance with MRI.
Disclosure statement
No potential conflict of interest was reported by the author(s).
Additional information
Funding
References
- Basura GJ, Adams ME, Monfared A, et al. Clinical practice guideline: Ménière’s disease. Otolaryngol Head Neck Surg. 2020;162(2 Suppl.):S1–S55. doi: 10.1177/0194599820909438.
- Froehlich MH, Lambert PR. The physiologic role of corticosteroids in Menière’s disease: an update on glucocorticoid-mediated pathophysiology and corticosteroid inner ear distribution. Otol Neurotol. 2020;41(2):271–276. doi: 10.1097/MAO.0000000000002467.
- Devare J, Gubbels S, Raphael Y. Outlook and future of inner ear therapy. Hear Res. 2018;368:127–135. doi: 10.1016/j.heares.2018.05.009.
- Jung DH, Rauch SD. Clinical trials for inner ear drugs: design and execution challenges. Hear Res. 2018;368:123–126. doi: 10.1016/j.heares.2018.03.020.
- Glueckert R, Johnson CL, Rask-Andersen H, et al. Anatomical basis of drug delivery to the inner ear. Hear Res. 2018;368:10–27. doi: 10.1016/j.heares.2018.06.017.
- Li Y, Kanzaki S, Shibata S, et al. Comparison of drug availability in the inner ear after oral, transtympanic, and combined administration. Front Neurol. 2021;12:641593. doi: 10.3389/fneur.2021.641593.
- Mäder K, Lehner E, Liebau A, et al. Controlled drug release to the inner ear: concepts, materials, mechanisms, and performance. Hear Res. 2018;368:49–66. doi: 10.1016/j.heares.2018.03.006.
- Lee SY, Kim J, Oh S, et al. Contralateral spreading of substances following intratympanic nanoparticle-conjugated gentamicin injection in a rat model. Sci Rep. 2020;10(1):18636. doi: 10.1038/s41598-020-75725-y.
- Videhult PP, Fransson A, Kisiel MA, et al. Middle ear administration of a particulate chitosan gel in an in vivo model of cisplatin ototoxicity. Front Cell Neurosci. 2019;13:268. doi: 10.3389/fncel.2019.00268.
- Chen N, Karpeta N, Ma X, et al. Diagnosis, differential diagnosis, and treatment for sudden sensorineural hearing loss: current otolaryngology practices in China. Front Neurol. 2023;14:1121324. doi: 10.3389/fneur.2023.1121324.
- Wang Y, Han L, Diao T, et al. A comparison of systemic and local dexamethasone administration: from perilymph/cochlea concentration to cochlear distribution. Hear Res. 2018;370:1–10. doi: 10.1016/j.heares.2018.09.002.
- Chhabda S, Leger DS, Lingam RK. Imaging the facial nerve: a contemporary review of anatomy and pathology. Eur J Radiol. 2020;126:108920. doi: 10.1016/j.ejrad.2020.108920.
- Ozgen MB. Imaging anatomy and pathology of the intracranial and intratemporal facial nerve. Neuroimaging Clin N Am. 2021;31:553–570. doi: 10.1016/j.nic.2021.06.001.
- Zhao D, Tong BS, Duan ML. In vivo dynamic changes of inner ear guinea pigs with 9.4 Tesla MRI. Zhonghua Er Bi Yan Hou Tou Jing Wai Ke Za Zhi. 2020;55(4):378–383. doi: 10.3760/cma.j.cn115330-20190727-00467.
- Duan M, Bjelke B, Fridberger A, et al. Imaging of the guinea pig cochlea following round window gadolinium application. Neuroreport. 2004;15(12):1927–1930. doi: 10.1097/00001756-200408260-00019.
- Salt AN, Hirose K. Communication pathways to and from the inner ear and their contributions to drug delivery. Hear Res. 2018;362:25–37. doi: 10.1016/j.heares.2017.12.010.
- Plontke SK, Salt AN. Local drug delivery to the inner ear: principles, practice, and future challenges. Hear Res. 2018;368:1–2. doi: 10.1016/j.heares.2018.06.018.
- Schilder A, Su MP, Blackshaw H, et al. Hearing protection, restoration, and regeneration: an overview of emerging therapeutics for inner ear and central hearing disorders. Otol Neurotol. 2019;40(5):559–570. doi: 10.1097/MAO.0000000000002194.
- Lukashkin AN, Sadreev II, Zakharova N, et al. Local drug delivery to the entire cochlea without breaching its boundaries. iScience. 2020;23(3):100945. doi: 10.1016/j.isci.2020.100945.
- Salt AN, Hartsock JJ, Gill RM, et al. Perilymph pharmacokinetics of locally-applied gentamicin in the guinea pig. Hear Res. 2016;342:101–111. doi: 10.1016/j.heares.2016.10.003.