
Abstract
We surveyed offshore fish populations in the Gulf of Mexico in 2011 and 2012, following persistent reports of abnormal skin lesions and other pathologies in the aftermath of the Deepwater Horizon oil spill. The incidence of skin lesions in 2011 sampling was most frequent in some bottom-dwelling species along the continental shelf edge north of the Deepwater Horizon site. Longline surveys revealed that by 2012 the overall frequency of lesions in northern Gulf of Mexico (NGM) fishes in the vicinity of the Deepwater Horizon had declined 53%, with severity also declining. Relatively high concentrations of polycyclic aromatic hydrocarbon (PAH) metabolites (up to 470,000 ng naphthalene equivalents/g bile wet weight), indicative of oil-related pollution, were found in fish bile in 2011; concentrations of summed PAHs measured in fish liver and muscle were relatively low (<35 ng/g) due to the efficient metabolism of these compounds by teleost fish. Significant declines in bile concentrations of naphthalene and phenanthrene metabolites in Red Snapper Lutjanus campechanus between 2011 and 2012 indicate an episodic exposure to elevated levels of hydrocarbons of petrogenic origin. The composition of PAH parent compounds and alkylated homologs in Red Snapper liver samples was highly correlated with oil collected at the Deepwater Horizon wellhead but was less coherent with other PAH sources in the NGM. The elevated 2011 prevalence of skin lesions in some NGM species was unrelated to surface salinity or temperature anomalies and was not the result of an epizootic observable in our histopathology samples but was positively correlated with PAH concentration. Thus, we fail to reject the null hypothesis that elevated skin lesion frequency is unrelated to PAH exposure from the Deepwater Horizon oil spill.
Received August 14, 2013; accepted March 26, 2014
Persistent anecdotal reports of offshore fishes exhibiting skin lesions and other symptoms began in the winter of 2010–2011, following the Deepwater Horizon blowout and resulting oil spill (April 20–July 15, 2010; Lubchenco et al. Citation2012; McNutt et al. Citation2012). Open skin lesions are a relatively rare occurrence in wild marine fish populations (van Banning Citation1987; Ziskowski et al. Citation1987), being generally more prevalent in coastal regions and estuaries (Vethaak Citation1992; Lange et al. Citation1999; Vethaak et al. Citation2011), and thus there were concerns that exposure to oil from the Deepwater Horizon may have been associated with the reported symptomatology. The greatest health concerns for fish from exposure to crude oil are from carcinogenic and noncarcinogenic polycyclic aromatic hydrocarbons (PAHs; Reynaud and Deschaux Citation2006; Carls et al. Citation2008). A number of biological effects have been associated with PAH exposure in fish, including developmental abnormalities, immunosuppression, hepatic lesions, altered growth, increased susceptibility to vibriosis and other diseases, altered gene expression, reduced multigenerational fitness, and cardiac dysfunction (Myers et al. Citation1994; White et al. Citation1999; Heintz et al. Citation2000; Arkoosh et al. Citation2001; Incardona et al. Citation2004, Citation2012, Citation2014; Meador et al. Citation2006; Reynaud and Deschaux Citation2006; Balk et al. Citation2011; Whitehead et al. Citation2012). Fish can be exposed to PAHs via various routes (Law and Hellou Citation1999), including consumption of contaminated prey, direct contact with contaminated water through the gills, and potentially through transdermal exposure of benthic fish to contaminated sediments. Petrogenic PAHs enter the environment as unburned crude and processed petroleum products, including low-molecular-weight (LMW) PAHs, such as naphthalene (NPH) and phenanthrene (PHN). Pyrogenic-origin PAHs of relatively high molecular weight originate primarily from partially burned coal and petroleum (Lima et al. Citation2005).
The sampling of fish following the Deepwater Horizon blowout for seafood safety monitoring revealed that there were relatively low concentrations of 13 PAHs in fish muscle (Ylitalo et al. Citation2012). However, this does not necessarily mean that the fish were not previously exposed to high levels of hydrocarbons. Vertebrates, such as fish, readily take up PAHs present in their food and the environment and quickly metabolize these compounds to more polar compounds that are then secreted into the bile for rapid elimination over a period of several days (Varanasi et al. Citation1989). As a result, fish exposed to high levels of PAHs generally contain relatively low or undetectable levels of these compounds in their muscle, even within a few days following an exposure episode (Varanasi et al. Citation1989). The region where the Deepwater Horizon spill occurred is, however, chronically exposed to oil from multiple sources, including natural seeps (Mitchell et al. Citation1999; Kvenvolden and Cooper Citation2003), inputs from the Mississippi and other rivers (Mitra and Bianchi Citation2003), coastal erosion (Iqbal et al. Citation2007), atmospheric deposition, and low-level releases from the extant oil industry (McDonald et al. Citation1996; Peterson et al. Citation1996; Overton et al. Citation2004; Balk et al. Citation2011; ). Thus, disentangling the relationship of various PAH sources, including the Deepwater Horizon spill, represents a significant challenge. There was no comprehensive baseline for fish disease prevalence and associated PAH levels in fish in the areas most heavily impacted by the Deepwater Horizon spill for years prior to 2010. It was thus not possible to determine if fish pathologies were elevated coincident with Deepwater Horizon exposure using the then-available data. Accordingly, we undertook surveys in 2011 and 2012 to sample primarily bottom-dwelling fishes in the northern Gulf of Mexico (NGM), near the well site, around the adjacent West Florida Shelf (WFS), and in the continental shelf region west of the oil spill to document the frequency and spatial distribution of skin lesions and to sample fish for exposure to hydrocarbons ().
FIGURE 1. Location of sampling stations and the percent of skin lesions per station for (A) June–August 2011 and (B) June–August 2012. The percent of skin lesions at a station is indicated as follows: white circles = 0%, red graduated circles = 0.1–2.0%, 2.1–4.0%, 4.1–6.0%, and >6.0% (from smallest to largest), black and white circles = 0%, and blue graduated circles = 0.1–2.0%, 2.1–4.0%, 4.1–6.0%, and >6.0% (from smallest to largest). In panel (B), black and white and blue graduated circles represent stations first sampled in 2012, while white circles and red graduated circles represent stations sampled in both 2011 and 2012. The gray shading is the cumulative distribution of surface oil occurring during the duration of the Deepwater Horizon (DWH) event. At each 10’ square, the number of days oil was observed was multiplied by the daily density of surface oil observed at that location (low = 1, moderate = 5, high = 10) and summed. Oil density per square thus ranges from 0 to 572 “oil days.” The heavy black line in panel (A) separates the West Florida Shelf (WFS) from the northern Gulf of Mexico (NGM). Yellow dots are the current (April 2012) locations of oil and gas platforms (BOEM Citation2012). [Color figure available online.]
![FIGURE 1. Location of sampling stations and the percent of skin lesions per station for (A) June–August 2011 and (B) June–August 2012. The percent of skin lesions at a station is indicated as follows: white circles = 0%, red graduated circles = 0.1–2.0%, 2.1–4.0%, 4.1–6.0%, and >6.0% (from smallest to largest), black and white circles = 0%, and blue graduated circles = 0.1–2.0%, 2.1–4.0%, 4.1–6.0%, and >6.0% (from smallest to largest). In panel (B), black and white and blue graduated circles represent stations first sampled in 2012, while white circles and red graduated circles represent stations sampled in both 2011 and 2012. The gray shading is the cumulative distribution of surface oil occurring during the duration of the Deepwater Horizon (DWH) event. At each 10’ square, the number of days oil was observed was multiplied by the daily density of surface oil observed at that location (low = 1, moderate = 5, high = 10) and summed. Oil density per square thus ranges from 0 to 572 “oil days.” The heavy black line in panel (A) separates the West Florida Shelf (WFS) from the northern Gulf of Mexico (NGM). Yellow dots are the current (April 2012) locations of oil and gas platforms (BOEM Citation2012). [Color figure available online.]](/cms/asset/f312b950-e9d6-429c-b6d8-8bc89be14f91/utaf_a_911205_f0001_oc.jpg)
METHODS
Field sampling procedures.—Sampling in 2011 occurred from June to August using chartered commercial longline fishing vessels (). The depth distribution of sampling was 15–195 m along 15 transects from near shore to off shore. After the Deepwater Horizon blowout, the species most often reported with anomalous skin lesions was Red Snapper Lutjanus campechanus. Therefore, the maximum depth of our initial survey (∼200 m) coincided with the maximum depth distribution of the species (Patterson et al. Citation2007). Sampling stations were located at nominal depths of 18, 37, 73, 110, 146, and 183 m along 15 transects extending from north of the Dry Tortugas Islands to offshore of Terrebonne Bay, Louisiana (). Some additional stations were located between transects, and for some transects with steep bathymetric slopes, we reduced the number of stations fished.
The longitudinal scope of the study was set to encompass the majority of the area in which surface oil concentrations during the Deepwater Horizon event were the greatest () and also to include the WFS region (), which had no observed surface oiling from the spill (), although we cannot rule out upwelling of dissolved Deepwater Horizon hydrocarbons there (Hu et al. Citation2011; Weisberg et al. 2014).
In 2012 we sampled 34 of the stations originally occupied in 2011, again using a chartered commercial fishing vessel (June–July) and the RV Weatherbird II (August). We extended the 2012 sampling westward of the original transects in order to assess disease frequency in areas of the extant oil infrastructure but where no surface or subsurface oil contamination from Deepwater Horizon was evident (OSAT Citation2010; ). Thirteen deeper stations were also sampled in 2012, based on the 2011 results indicating particularly elevated skin lesion prevalence of deep-dwelling shelf species (e.g., Tilefish Lopholatilus chamaeleonticeps, Yellowedge Grouper Hyporthodus flavolimbatus, and Southern Hake Urophycis floridana).
At each predetermined sampling location, the vessel captain searched for suitable habitat for the target species, primarily snappers (family Lutjanidae) and groupers (family Epinephelidae). The vessel was allowed to range up to 9 km from the center line of the sampling transect in search of suitable “hard bottom” habitat. At each station, 8 km of 3.2-mm galvanized-steel main line with 322–500 baited hooks was deployed. We used 91-kg-test leaders, 3.7 m long and attached to #13 circle hooks, with alternating cut fish and squid as bait. At the beginning and end of the main line we deployed Star:Oddi CDST Centi temperature–time–depth recorders to record actual bottom time, as well as bottom temperature and depth fished. At setout and haul-back, we recorded latitude and longitude, time, depth from the vessel's depth finder, and local weather conditions. Once the longline was deployed, the vessel steamed back to the start buoy and began haul-back. The average soak time was 2 h 1 min. At retrieval, we determined fish species and recorded the standard, fork, and total lengths to the nearest centimeter, as appropriate. Each specimen was weighed to the nearest gram on a Marel motion-compensated scale or a hand scale (nearest cg) for very large fish. Large sharks (e.g., ∼2 m and greater) were photographed for species identification at the rail and released alive. Each fish obtained was inspected for a variety of externally symptomatic diseases, and other samples were obtained. For specimens exhibiting obvious skin abnormalities, photographs of the affected tissues were taken and a portion of the affected skin was excised in thin sections and preserved in 10% neutral buffered formalin for subsequent histological analyses. Our catches of large pelagic species were augmented by trolling surface lures while transiting between longline stations. Troll-caught specimens were processed using methods similar to longline catches.
Each fish was examined for the following: (1) the presence of external skin lesions (e.g., ulcers, other external eruptions of the integument, or skin irritation unrelated to mechanical damage), (2) the presence of fin rot disease, (3) the presence of parasites (data not reported here) or tumors on the gills, (4) the evidence of recent mechanical damage thought to occur through trauma of the catching process or due to predators, and (4) the presence of obvious tumors and tumor-like growths on the skin and internal organs. The status of each candidate lesion was evaluated (e.g., open bloody ulcer, closed skin contusions, healing, or old injury).
For selected species (Red Snapper, Red Grouper Epinephelus morio, Vermilion Snapper Rhomboplites aurorubens, Gag Mycteroperca microlepis, Yellowedge Grouper, Snowy Grouper Hyporthodus niveatus, and Tilefish), we chose the first five specimens encountered of normal specimens and all fish with obvious skin anomalies and weighed the liver, gastrointestinal tract, and gonad separately to the nearest gram using the Marel scale. For Red Snapper and associated species, we also took samples for PAH determinations from muscle, liver, and bile. Muscle samples were excised from the dorsal area and consisted of about 2 cm3 of tissue. Liver samples of similar size were also taken. Both liver and muscle samples were separately wrapped in aluminum foil and inserted into plastic bags. Samples were kept on ice for the duration of each fishing vessel trip, then frozen at −20°C prior to analysis. Samples from the RV Weatherbird II were frozen at sea immediately upon collection. To obtain bile samples, we dissected and punctured the gallbladder into a clear 15-mm × 45-mm vial. A foil liner was inserted between the cap and vial to prevent hydrocarbon contamination. The vial was wrapped in foil to prevent photo oxidation and placed in a plastic bag. Bile samples were kept on ice or frozen at sea until return to the laboratory, where they were maintained at −20°C or colder until analyzed.
Laboratory determinations of PAHs.—Frozen bile samples collected from five species sampled in 2011 were shipped to the Northwest Fisheries Science Center in Seattle, Washington, and were stored at −20°C until analysis. Thirty-four individual fish bile samples from 2011 (several species) and 15 samples from 2012 (Red Snapper) were analyzed for metabolites of PAHs using a high-performance liquid chromatography–fluorescence (HPLC-F) method (Krahn et al. Citation1984; Krahn et al. Citation2005). This method results in the determination of the concentrations of classes of PAH metabolites fluorescing in the regions typified by NPH, PHN, and benzo[a]pyrene (BaP). Bile was injected directly onto a Waters HPLC-F system equipped with a C-18 reverse-phase column (Phenomenex Synergi Hydro). The PAH metabolites were eluted with a linear gradient from 100% water (containing a trace amount of acetic acid) to 100% methanol at a flow of 1.0 mL/min. Chromatograms were recorded at the following wavelength pairs: (1) 292/335 nm, at which many 2–3 benzene ring aromatic compounds (e.g., NPH) fluoresce, (2) 260/380 nm, at which several 3–4 ring compounds (e.g., PHN) fluoresce, and (3) 380/430 nm, at which 4–5 ring compounds (e.g., BaP) fluoresce. Peaks eluting after 9 min were integrated, and the areas of these peaks were summed. The concentrations of fluorescent PAHs in the bile samples of the marine fish were determined using NPH, PHN, and BaP as external standards and converting the fluorescence response of bile to PHN (ng PHN equivalents/g bile), NHP (ng NPH equivalents/g bile), or BaP (ng BaP equivalents/g bile) equivalents.
To ensure that the HPLC-F system was operating properly, a NPH–PHN–BaP calibration standard was analyzed five times to obtain a relative standard deviation of <15% for each PAH. As part of the laboratory quality assurance plan (Sloan et al. Citation2006), two quality assurance samples, consisting of a method blank and a fish bile control sample (bile of Atlantic Salmon Salmo salar exposed to 25 μg/mL of Monterey crude oil for 48 h), were analyzed with the fish bile samples. Three methods blanks revealed no traces of PAH metabolites, and the calibration standard was reproduced within the standard deviation of the source compound.
Bile samples taken in 2012 were analyzed at the Mote Marine Laboratory using identical methods as described above. We reanalyzed 2011 samples at the Mote Marine Laboratory, resulting in identical results as those obtained by the Northwest Fisheries Science Center. Methods blanks were also run periodically to assure that no contamination of samples was skewing contaminant assessment results.
Liver and muscle samples from the NGM and WFS were analyzed using gas chromatography–mass spectrometry (GC–MS) methods to evaluate individual parent PAH compounds and alkylated homologs (C1–C4) at relatively low detection levels <1 ng/g (Varanasi et al. Citation1993; Krahn et al. Citation2005; Hom et al. Citation2008; Ylitalo et al. Citation2012). For muscle and liver samples obtained in 2011, the GC–MS method employed measured individual PAHsFootnote1 at low detection levels (<1 ng/g) and provided data on alkylated homologs (Ylitalo et al. Citation2012). The GC–MS method (Sloan et al. Citation2005) is a reliable and sensitive analytical method that has been used to measure these compounds in fish and other marine organisms collected after previous oil spills and natural disasters (Krahn et al. Citation2005; Hom et al. Citation2008; Ylitalo et al. Citation2012). For the GC–MS method, muscle and liver samples were extracted with dichloromethane using an accelerated solvent extractor. Polar compounds were removed from the extracts using a gravity flow silica–alumina column, followed by separation of PAHs from interfering biogenic compounds using liquid chromatography with size exclusion chromatography. The PAHs were then measured on a low-resolution quadrupole GC–MS system. Methods blanks were run every 3–14 samples. Small amounts of a few analytes from the methods blanks were determined at background levels (primarily NPH and a few other PAHs) that averaged from 0.03 to 1.3 ng/g. We did not adjust the sample results for the positive readings for the few instances of small positive readings because doing so would have resulted in negative PAH or homolog levels, and the overall effect on interpretation of results was minor. However, if such adjustments are made, they would shift the dominant PAH homolog slightly from C2 to C3 NHP.
Histology samples.—Histology samples of skin pathologies and representative fish livers from field collections taken in 2011 were thin-sectioned and mounted per standard histopathology procedures. Slides were read twice by separate classifiers to determine skin conditions relative to various sources, including microsporidian parasite infections, skin abrasions, and skin lesions of potential toxicopathic origin. Based on the analysis of histological material and photographs of skin anomalies taken at the time of field collection, the field classifications were either confirmed as skin lesions or reclassified as due to other sources. Final skin lesion frequencies are based on these determinations, and the data collected in 2011 were used as a training set for subsequent field classifications in 2012.
Data analysis.—For prevalence data (percent of animals exhibiting signs of skin lesions), we computed percentile confidence intervals using a bootstrap method, resampling diseased and nondiseased animals 1,000 times with the bootstrap sample size equal to the number of the test species or species group actually sampled (). Where appropriate, we performed an odds ratio evaluation, noting significance of the Fisher's exact test (). When comparing percent frequency if one of the comparisons involved zero frequency, we performed a one-sided test evaluating the probability of disease frequency exceeding 0%. Tests of bile PAH concentrations employed a Mann–Whitney rank-sum test for medians.
FIGURE 2. Mean percent (error bars show SEs) of fish within a species or species group with skin lesions examined in 26 repeated stations in 2011 (red) and 2012 (gray) in the NGM region. Abbreviations are as follows: O/R = the odds ratio of differences between years (2011/2012) and n.s. = not significant. [Color figure available online.]
![FIGURE 2. Mean percent (error bars show SEs) of fish within a species or species group with skin lesions examined in 26 repeated stations in 2011 (red) and 2012 (gray) in the NGM region. Abbreviations are as follows: O/R = the odds ratio of differences between years (2011/2012) and n.s. = not significant. [Color figure available online.]](/cms/asset/385eefca-5948-4f42-a5c2-85f0e78ffb79/utaf_a_911205_f0002_oc.jpg)
RESULTS
We evaluated the disease status of 7,433 finfish specimens from 103 different species caught at 150 sampling stations in 2011 and 2012 and examined them for signs of skin lesions. From 84 longline stations sampled in 2011 (), we caught a total of 3,952 fish, with overall rates of skin lesions varying widely by species, area, and depth. Average fish catch in 2011 was 47 per haul (range = 4–240); the dominant species were Red Snapper, Red Grouper, Gulf Smoothhound Mustelus sinusmexicanus, and Atlantic Sharpnose Shark Rhizoprionodon terraenovae, which in aggregate accounted for about two-thirds of the total catch.
The 2012 sampling consisted of 66 longline stations with repeat collections at stations sampled in 2011 in the NGM near the shelf break to ascertain potential changes at locations exhibiting skin lesions in 2011. Additionally, some WFS stations were repeated to sample Red Snapper there for lesion frequency and PAH contamination. In 2012 we caught 3,481 specimens at 66 stations, for an overall average catch rate of 53 fish per haul (range = 2–202). Catches in 2012 consisted primarily of King Snake Eel Ophichthus rex, Atlantic Sharpnose Shark, Red Snapper, Gulf Smoothhound, and Tilefish, also comprising about two-thirds of the catch.
Of the 34 stations repeated in 2012, 26 were in the NGM region (). The catch rates were similar between years (67 versus 60 fish per longline set) at these 26 stations, but the frequency of skin lesions declined significantly from 1.9% to 0.9% (P = 0.019; ). Of the four species groups (species membership by group is given in the associated online information), the large pelagic species, the other bottom fishes, and the snapper–grouper species had higher rates of prevalence of skin lesions in 2011 than did the elasmobranchs (). There was a consistent, relatively high frequency of skin lesions in the 2011 data (), especially along the northern axis of DeSoto Canyon north of the Deepwater Horizon site. In contrast, the inner-continental-shelf stations north of the Deepwater Horizon well site had very low or zero lesion frequency. Species occurring relatively frequently at the shelf break, which we also sampled intensively in 2012, included Tilefish, Southern Hake, Yellowedge Grouper, and King Snake Eel (, ).
The concentrations of PAHs (parent and alkylated-homolog compounds) measured in the liver and muscle were low (<35 ng/g; ), whereas the NHP metabolite equivalent levels (associated with petroleum exposure) determined in fish bile () were relatively high (range = 41,000–470,000 ng/g bile wet weight). These findings are consistent with the high rates of PAH metabolism in vertebrates (Varanasi et al. Citation1989). In all cases, the PAH levels in these tissues were well below (one to three orders of magnitude) U.S. Food and Drug Administration consumption “levels of concern” (Ylitalo et al. Citation2012).
FIGURE 3. Average sum of low-molecular-weight (LMW) PAHs and alkylated homologs for liver and muscle samples of 13 species sampled in the NGM and WFS regions. Numbers in parentheses are the sample sizes (liver, muscle). Some of these samples are composites from several fish. The 1:1 bisector is plotted as a dashed line. Species include those listed in the text, as well as Greater Amberjack Seriola dumerili, Yellow Conger Rhynchoconger flavus, Cobia Rachycentron canadum, and Scamp Mycteroperca phenax.
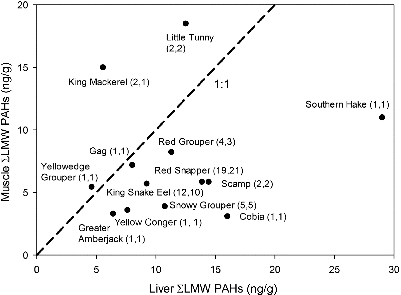
FIGURE 4. Changes in the concentration of PAH metabolites (for naphthalene, phenanthrene, and benzo[a]pyrene) sampled from Red Snapper bile obtained in the NGM in 2011 and 2012. The U statistic is from the Mann–Whitney rank-sum test for differences in the median. The dark horizontal lines are mean values, the lighter horizontal bars inside the boxes are the medians, the shaded boxes are the interquartile ranges, the whiskers represent the 10th and 90th percentiles, and the white circles are individual samples.
![FIGURE 4. Changes in the concentration of PAH metabolites (for naphthalene, phenanthrene, and benzo[a]pyrene) sampled from Red Snapper bile obtained in the NGM in 2011 and 2012. The U statistic is from the Mann–Whitney rank-sum test for differences in the median. The dark horizontal lines are mean values, the lighter horizontal bars inside the boxes are the medians, the shaded boxes are the interquartile ranges, the whiskers represent the 10th and 90th percentiles, and the white circles are individual samples.](/cms/asset/844d0a63-c5e2-401d-8b57-9a1d7ba8a3b8/utaf_a_911205_f0004_b.gif)
The liver : muscle ratio for LMW PAHs differed substantially among species (). For two large pelagic species (King Mackerel Scomberomorus cavalla and Little Tunny Euthynnus alletteratus), muscle PAH levels exceeded liver concentrations by 172% and 48%, respectively. The ratio of muscle : liver LWM PAHs was substantially higher for Southern Hake (), a deep water benthic omnivore that feeds primarily on invertebrate infauna and potentially bioturbates PAH-laden sediments. Southern Hake liver and muscle samples were dominated by high proportions of PAH parent compounds, perhaps indicative of relatively recent exposure or less efficient PAH metabolism.
Concentrations of PAH metabolites in bile samples from the NGM in 2011 were in the moderate to high range, averaging 126,000 ng NHP equivalents/g bile (wet weight). Bile-derived PAH metabolite levels taken from Red Snapper sampled in the NGM region () declined between 2011 and 2012, consistent with an episodic exposure event. Mean and median levels of NPH equivalents declined significantly (P < 0.001) by 47% and 49%, respectively, between years. Likewise, mean and median PHN equivalent concentrations declined significantly (P = 0.036) by 34% and 32%, respectively, between years. While mean and median levels of BaP equivalents declined 19% and 24%, respectively, these levels were not statistically significant (P = 0.153; ).
The average composition of PAHs in NGM liver samples has a very strong positive relationship (r2 = 0.82; P < 0.001) with the composition of PAHs determined from the leaking wellhead (Reddy et al. Citation2012; ), despite the nearly 1 year that elapsed between the end of the Deepwater Horizon spill and our sampling. The concentration of various parent and alkylated-homolog compounds differed between NGM and WFS, with the WFS having a somewhat lower fraction of alkylated to parent compounds (74% and 71% alkylated homologs in the WFS in liver and muscle samples, respectively, versus 84% and 85% for the NGM). These patterns are indicative of differing exposure histories and differential weathering of compounds between the two regions (Mitra and Bianchi Citation2003; Short et al. Citation2004; Iqbal et al. Citation2007). The source of PAH contamination on the WFS is unknown, but its composition exhibits lower concentrations of alkylated homologs of a number of PAHs than that in the NGM (). This condition is indicative of exposure to a differentially weathered oil source or perhaps an admixture of PAH sources (, ).
FIGURE 5. Concentrations of some PAH parent compounds and alkylated homologs (see Methods, particularly footnote 1, for compound abbreviations) sampled from the Macondo (Deepwater Horizon) wellhead (Reddy et al. Citation2012; gray bars), from 56 Red Snapper aggregated into 18 composite samples of livers from the NGM in 2011 (red bars), and from two composite samples of 8 fish from the WFS (black circles and line). Standard errors are plotted for the Red Snapper liver samples from the NGM. [Color figure available online.]
![FIGURE 5. Concentrations of some PAH parent compounds and alkylated homologs (see Methods, particularly footnote 1, for compound abbreviations) sampled from the Macondo (Deepwater Horizon) wellhead (Reddy et al. Citation2012; gray bars), from 56 Red Snapper aggregated into 18 composite samples of livers from the NGM in 2011 (red bars), and from two composite samples of 8 fish from the WFS (black circles and line). Standard errors are plotted for the Red Snapper liver samples from the NGM. [Color figure available online.]](/cms/asset/ee578648-eed2-4ecf-a83b-9fd8fb4425e9/utaf_a_911205_f0005_oc.jpg)
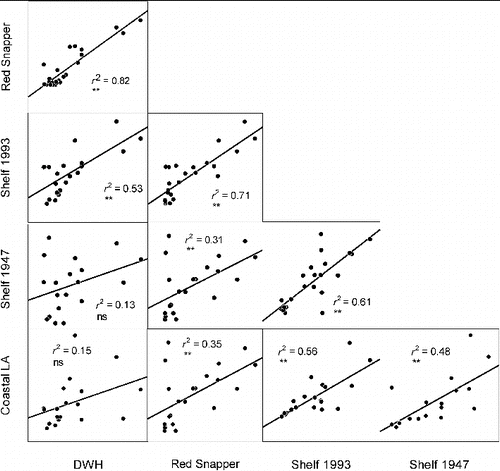
FIGURE 6. Correlations between PAH concentrations (parent compounds and alkylated homologs; see footnote 1) from various sources in the Gulf of Mexico. Coefficients of determination (r2) and significance of regressions (** = highly significant, ns = not significant) are provided for each pair of concentrations. Data are from the following sources: Deepwater Horizon (DWH) = Reddy et al. Citation2012, Red Snapper = this study (Figure 5), Shelf 1993 = average concentrations along the continental shelf from 1950 to 1993 from Presley et al. Citation1998, Shelf 1947 = average concentrations along the continental shelf from 1893 to 1947 from Presley et al. Citation1998, Coastal Louisiana (LA) = data derived from Iqbal et al. Citation2007.
DISCUSSION
The etiologies of skin lesions are complex and can be influenced by a multiplicity of individual and synergistic environmental stressors, including mechanical damage, predation attempts, social interactions among fish, pathogens, physical environmental stresses, and exposure to toxicopathic contaminants (Vethaak Citation1992; Vethaak et al. Citation2011). If skin lesions in the NGM are primarily of toxicopathic origin, with PAH exposure being the primary toxic agent, then there are four potential alternative or cumulative sources for PAHs influencing our results (Ocean Studies Board and Marine Board Citation2003; Overton et al. Citation2004): (1) natural hydrocarbon seeps (MacDonald et al. Citation1993, Citation1996; Presley et al. Citation1998; Mitchell et al. Citation1999; Santschi et al. Citation2001; Kvenvolden and Cooper Citation2003), (2) chronic low-level exposure from the extant oil and gas infrastructure in the gulf (drilling rigs, production platforms, pumping facilities, vessels, and pipelines; McDonald et al. Citation1996; Overton et al. Citation2004; ), (3) inputs from large rivers, atmospheric deposition, and coastal erosion (Mitra and Bianchi Citation2003; Overton et al. Citation2004; Iqbal et al. Citation2007), and (4) Deepwater Horizon (Lubchenco et al. Citation2012; McNutt et al. Citation2012; Reddy et al. Citation2012; ).
Despite considerable uncertainty about the volume of specific constituents, several attempts have been made to establish an oil pollution budget for the Gulf of Mexico (Ocean Studies Board and Marine Board Citation2003) against which we can evaluate Deepwater Horizon impacts. The Ocean Studies Board and Marine Board (Citation2003) estimated the average annual input of oil (1990–1999) from all sources into the Gulf of Mexico (their regions G and H) to be 95,500 tons, comprised of the following: 70,000 tons from natural seeps, 2,710 tons from oil and gas extraction activities, 4,090 tons from transportation activities, and 18,700 tons from oil consumption (combustion) byproducts. By contrast, the Deepwater Horizon spill was 699,700 metric tons ± 10% or over seven times the average annual input from all non-Deepwater Horizon sources (McNutt et al. Citation2012).
Sediment cores from the region west of the Mississippi River delta, analyzed by Presley et al. (Citation1998), Santschi et al. (Citation2001), and Overton et al. (Citation2004), indicate that hydrocarbon seeps do not account for much of the contemporary PAH flux on the continental shelf where our fish were sampled. Coring (Presley et al. Citation1998) was conducted in 60 m of water, near one of our transects (). In their chronological reconstruction, ΣPAHs averaged 234 ng/g of sediment from 1893 to 1947, increasing quickly thereafter to an average of 611 ng/g from 1950 to 1993, coincident with the development of offshore oil production and post–World War II increases in domestic oil consumption (Presley et al. Citation1998; Santschi et al. Citation2001). These results are consistent with findings of Overton et al. (Citation2004), who sampled more broadly in the Mississippi River Bight. Thus, rather than seeps accounting for >70% of oil pollution in the Gulf of Mexico oil budget as a whole (Ocean Studies Board and Marine Board Citation2003), even if they accounted for all PAH inputs to sediments prior to 1940 (which they clearly do not), they must account for about a third (e.g., 234/611 ng/g), or likely much less, of the contemporary annual PAH budget (minus Deepwater Horizon) on the continental shelf in the NGM. This conclusion is supported by the spatial distribution of natural seeps, the vast majority of which occur westward and well offshore of our sample locations (MacDonald et al. Citation1993, Citation1996; Mitchell et al. Citation1999; Kvenvolden and Cooper Citation2003; ).
Leaking oil infrastructure and produced waters () are also unlikely to be a major source for PAHs found in the fishes that we examined. The Ocean Studies Board and Marine Board (Citation2003) estimated an annual total of 3,571 tons of oil from leaks and discharges from platforms, produced waters, and pipelines distributed over the broad region occupied by oil and gas infrastructure (). This represents about 0.5% of the volume of oil from the Deepwater Horizon spill (McNutt et al. Citation2012). Oil infrastructure is distributed over about 250,000 km2 of the NGM (); thus, the density of annual infrastructure-derived oil inputs is about 14 kg km−2 y−1 versus pollution from Deepwater Horizon of about 5,000 kg km−2 y−1 over an area of about 140,000 km2 (over 350 times more from Deepwater Horizon in the overlapping regions; ). Furthermore, while monitoring of fish toxicology for oil and gas extraction-related pollution is very limited in Gulf waters, sampling in the vicinity of gas wells in the western Gulf of Mexico revealed generally lower levels of PAHs than in our bile samples, particularly for BaP (McDonald et al. Citation1996). Pollution from oil infrastructure is generally limited to <1 km around rigs (Kennicutt et al. Citation1996) and is thus considered a more localized, rather than regional, pollution source. Our 18 composite Red Snapper samples from the NGM, extending over 400 km across the region north of the leaking wellhead, resulted in a generally coherent signal of PAH profiles (see online data) that are not consistent with localized leaks or discharges resulting from multiple different sources and oil formations. Likewise, no such seeps or oil infrastructure occur on the WFS, and thus the predominantly petrogenic PAHs we detected there () must be from a distant pollution source and perhaps Deepwater Horizon (Weisberg et al. 2014).
Of the remaining sources (riverine, coastal erosional sources, and atmospheric deposition), coastal erosion appears to account for the majority of the annual flux, ranging from 97% to >99% for three example PAHs (Mitra and Bianchi Citation2003). However, the PAH composition of erosional sources in coastal Louisiana (Iqbal et al. Citation2007) differs substantially from that of the Deepwater Horizon oil (Reddy et al. Citation2012) and our profiles (, ). Iqbal et al. (Citation2007) found a very low ratio of parent to C4 NHP (∼1:10), which is characteristic of substantial weathering, in contrast to our data, to that of Reddy et al. (Citation2012), and in offshore core samples (Presley et al. Citation1998), indicating approximate unity. Also, erosional sediments in coastal Louisiana had detectable levels of ANT (Iqbal et al. Citation2007), which is indicative of a more pyrogenic source, and is inconsistent with our results () and the composition of the source oil (Reddy et al. Citation2012) showing no detectable ANT. Coastal erosional, atmospheric, and riverine sources of PAHs are thus also insignificant pollution sources for the shelf fishes we sampled.
We determined a correlation matrix for PAH parent and homolog concentrations from a number of the sources noted above (), including the Deepwater Horizon source oil, our Red Snapper liver samples (), a study of PAH contamination from coastal runoff in Louisiana (Iqbal et al. Citation2007), and continental shelf core samples for a 100-year time series averaged for two 50-year time intervals (Presley et al. Citation1998). The latter source should document the impacts of natural seeps if they are a significant oil source to the shelf. The correlations were the highest between the Deepwater Horizon and Red Snapper liver samples and generally much lower among all other bivariate combinations (). Correlations were particularly weak between all sources with coastal Louisiana sediments and continental shelf samples taken prior to 1950. While the shelf samples from 1950 to 1993 showed a somewhat higher correlation with the fish, they were not similar to Deepwater Horizon source oil. In particular, shelf samples (Presley et al. Citation1998) had relatively high concentrations of PYR, which were virtually absent from Deepwater Horizon and our fish samples, and thus indicative of a different source of PAH contamination (and perhaps a mixture of PAH sources).
Our findings of significant reductions in metabolites of LMW PAHs in fish bile between 2011 and 2012 () indicate that these fish were exposed to an elevated petrogenic hydrocarbon source during 2010–2011 that declined significantly over time. It is highly unlikely that atmospheric, coastal, riverine, oil and gas infrastructure, or natural seep inputs, even if they were of similar PAH composition and concentration to our samples, would have coincidentally declined by one-third to one-half in the same region. Exposure to elevated levels of Deepwater Horizon-derived PAHs is thus the most logical explanation for the elevated levels of PAHs we detected in fish in 2011 ().
A Deepwater Horizon exposure route is supported by the strong similarity between the PAH composition of Red Snapper liver samples from the NGM and the composition of hydrocarbons escaping the damaged well (Reddy et al. Citation2012; ). A similar phenomenon was observed in the carcasses and viscera of Pink Salmon Oncorhynchus gorbuscha from oiled locations in Prince William Sound following the Exxon Valdez oil spill, although the Pink Salmon collection dates were closer to the spill date (Carls et al. Citation1996). In both the Prince William Sound and Gulf of Mexico cases, a slight shift to alkylated homologs from parent PAH compounds is consistent with oil weathering in contrast with source oils (, ; Carls et al. Citation1996).
There are, however, some differences between the source oil composition (Reddy et al. Citation2012) and our results, including the average relative concentration of FLA, which was low but present in the source but more pronounced in the fish (). This discrepancy may be explained by the fact that elevated levels of FLA were detected in only 3 of the 18 composite stations sampled for fish, potentially representing an admixture of sources there. Alternatively, higher relative concentrations of FLA may be due to selective PAH metabolism by Red Snapper. Elevated levels of PAH metabolites in fish bile in the NGM show that PAH exposure persisted in the shelf environment and entered the food chain at least through the summer of 2011 (). The decline in overall lesion frequency between 2011 and 2012 in the NGM points to an episodic, rather than chronic, exposure factor. At the same time, bile PAH levels were declining by an equivalent percentage. Elevated levels of pyrogenic PAHs and metabolites in our NGM samples, perhaps originating as residue from controlled burning of Deepwater Horizon oil (Lubchenco et al. Citation2012), are in contrast to levels from the WFS () and from previous studies of fish from the western Gulf of Mexico (McDonald et al. Citation1996).
Average levels of PAHs in the muscle of fish we sampled are comparable to samples obtained in 2010 just after the Deepwater Horizon blowout as part of the seafood safety response (Ylitalo et al. Citation2012). They are also similar to those from samples primarily of Atlantic Croaker Micropogonias undulatus in the Mississippi Sound in 2005 and 2006 following Hurricane Katrina (Hom et al. Citation2008) and are slightly higher than values obtained from the Persian Gulf 1 year after the war (Krahn et al. Citation1993). Average biliary PAH metabolite levels in our 2011 samples exceeded those from earlier studies of fish near gas production platforms in the western Gulf of Mexico for NHP (+19%) and BaP (+55%) but were similar for PHN equivalent values (McDonald et al. Citation1996). While derived from fish taken from offshore waters, the overall levels of PAH metabolites in our NGM bile samples are characteristic of those from polluted urban estuaries along the West Coast, where a variety of fish pathologies have also been evident (Krahn et al. Citation1984; Myers et al. Citation1994; Stehr et al. Citation2000).
Differences in the ratio of liver : muscle PAH concentrations by species are likely related to life history, exposure vectors, and proximate compositions of various species. There are three plausible explanations for large pelagic species (King Mackerel and Little Tunny) having muscle PAH levels exceeding liver concentrations. First, the exposure route of these pelagic species may not have been through food consumption but through direct exposure to dissolved PAHs through the gills and the circulatory system, resulting in accumulation in muscle prior to clearance through the liver (Kennedy and Law Citation1990; Namdari and Law Citation1996; Law and Hellou Citation1999). This route is consistent with the pelagic life style of these species that are in constant motion, resulting in large quantities of water contacting gill surfaces. The second potential explanation is that exposure through consumption of contaminated prey was episodic, but enough time had elapsed to allow liver contamination to dissipate, leaving higher residual muscle PAHs. The latter explanation is consistent with the PAH composition data () and is indicative of oil weathering (Wang et al. Citation1999; Overton et al. Citation2004; Short et al. Citation2004). Third, lipophilic PAHs accumulate in higher concentrations in the muscle of relatively lipid-rich fishes, such as tuna (Thunnus spp.) and mackerel (family Scombridae). Under the latter scenario, then, particular diligence in seafood sampling of lipid-rich fish species is warranted following oil spills.
Low-salinity stress is a potential nontoxicopathic factor explaining the elevated rates of skin lesions in the NGM, as large quantities of impounded freshwater were released into the Gulf of Mexico in summer 2010 (Martínez et al. Citation2012) in an attempt to forestall surface oil from coming ashore and to flush oil from Barataria Bay and Breton Sound in coastal Louisiana. In the Dutch Wadden Sea, stress from variations in salinity (range = 2.5–25 psu bottom salinity) and simultaneous contaminant exposure (including PAHs) were positively correlated with the prevalence of skin lesions in European Flounder Platichthys flesus (Vethaak Citation1992; Vethaak et al. Citation2011). We investigated the incidence of skin lesions in relation to salinity and temperature anomalies occurring in the NGM in 2010–2011. Climatological average salinity profiles (NOAA NODC Citation2013a) show a persistent low surface salinity west of the Mississippi River delta of about 6 psu and east of the Delta of about 2 psu below oceanic salinity (). In 2010, ship-based observations (NOAA NODC Citation2013b) indicated a strong surface salinity anomaly east of the Delta and a smaller anomaly west of the Delta in a shallow surface lens, extending to about 20 m deep (). Comparison of historical and 2010 salinities at depths below 20 m indicated no significant anomalies from oceanic conditions (). Similarly, bottom temperatures determined from our longline stations were consistent with the long-term average temperatures at depth for the region. Skin lesions in 2011 sampling were most frequent at depths from 140 to 180 m and thus do not appear to be related to anomalies in salinity () or other oceanographic conditions in the NGM.
FIGURE 7. Frequency of skin lesions on fish (percent of all species exhibiting skin lesions; yellow bars) sampled at depth in the NGM region, July–August 2010. Climatological mean annual salinity profiles are plotted for the western (open circles with the blue line) and eastern (black circles with the black line) 1° squares centered at 29°N, 88°W and 28°N, 90°W, respectively (NOAA NODC 2013a). Salinity profiles for FSVs Gunter and Pisces conductivity, temperature, and depth instrument (CTD) stations east of the Mississippi River delta (thin black line with no circles) and west of the Delta (thin blue line with no circles) taken in summer 2010 are also plotted (NOAA NODC 2013b). [Color figure available online.]
![FIGURE 7. Frequency of skin lesions on fish (percent of all species exhibiting skin lesions; yellow bars) sampled at depth in the NGM region, July–August 2010. Climatological mean annual salinity profiles are plotted for the western (open circles with the blue line) and eastern (black circles with the black line) 1° squares centered at 29°N, 88°W and 28°N, 90°W, respectively (NOAA NODC 2013a). Salinity profiles for FSVs Gunter and Pisces conductivity, temperature, and depth instrument (CTD) stations east of the Mississippi River delta (thin black line with no circles) and west of the Delta (thin blue line with no circles) taken in summer 2010 are also plotted (NOAA NODC 2013b). [Color figure available online.]](/cms/asset/2f119734-a823-4812-8c4f-551a09930fcf/utaf_a_911205_f0007_oc.jpg)
While we cannot definitively link cause (Deepwater Horizon) and effect (increased prevalence of skin lesions) using only 2 years of postevent data, neither can we reject the null hypothesis that lesion frequency and PAH exposure are not linked. The elevated frequency of skin lesions in the NGM for some continental shelf species observed in summer 2011, especially demersal fishes close to the Deepwater Horizon, is consistent with effects of toxic exposure to oil from the Deepwater Horizon spill and inconsistent with other potential explanatory factors (e.g., low-salinity stress, temperature anomalies, and epizootics caused by pathogens observable in our histology samples). Resolving the potential cause and effect relationship between lesion frequency and PAH contamination requires continued research, including laboratory-based exposure trials and sustained monitoring to assess the background variability of disease frequency and PAH contamination in Gulf of Mexico fishes.
We had anticipated that the WFS would serve as a negative control for contamination of fish sampled in areas of intensive surface oil accumulation in the NGM (). However, the presence of PAHs in liver and muscle samples from Red Snapper, Gag, Scamp, and Red Grouper caught on the WFS, with similar (although not identical) composition to animals from the NGM (), raises the possibility that some dissolved hydrocarbons from Deepwater Horizon were transported to the WFS, which is consistent with upwelling we observed there (Hu et al. Citation2011; Weisberg et al. 2014).
Finally, while elevated skin lesion frequency for surviving animals may be a short-term consequence of acute PAH contamination, exposure to PAHs can produce a variety of other more consequential population-level effects, including impaired growth, increased disease susceptibility, reduced larval survival, and reduced net population fecundity (Heintz Citation2007). Reduced larval survival due to exposure to contaminated waters is most likely to impact a single year-class. However, of particular importance are potential genotoxic impacts. There is some experimental evidence for fish that PAH exposure can modify heritable traits, resulting in multigenerational reductions in reproductive output and survival (White et al. Citation1999) that thus represents a significant long-term concern for Gulf of Mexico fish populations. Also, yet unresolved are the potential impacts of oil exposure on the growth of juveniles and adults. Reductions in growth rate cascade to include effects on net biomass productivity and reproductive output. Understanding these impacts will require multiyear monitoring of life history parameters, as was conducted for the Exxon Valdez spill (Jewett et al. Citation2002; Peterson et al. Citation2003).
ACKNOWLEDGMENTS
This research was supported by Grant NA11NMF4720151–Systematic Survey of Fish Diseases in the Gulf of Mexico, to S.A.M. and W.T.H., from the National Marine Fisheries Service (NMFS) and the National Oceanic and Atmospheric Administration (NOAA) and by the BP–Gulf of Mexico Research Initiative, through its Center for Integrated Modeling and Analysis of Gulf Ecosystems, and the State of Louisiana Oil Spill Coordinator's Office. Owners, captains, and crew of the fishing vessels Pisces, Sea Fox, and Brandy and research vessel Weatherbird II, operated by the Florida Institute of Oceanography, conducted our longline sampling. We appreciate the efforts of our field team, including A. Wallace, E. Herdter, K. Deak, S. Snyder, M. Drexler, R. Kitzmiller, C. Stephenson, C. Gray, and M. Bakenhaster. The “oil days” calculations were performed by J. Benson of the NOAA–NMFS Alaska Fisheries Science Center. Pathologies of skin lesion samples from 2011 were confirmed by J. Landsberg and T. Cody at the Florida Fish and Wildlife Research Institute. We appreciate the chemical and data analysis conducted by G. Ylitalo, J. Stein, B. Anulacion, R. Boyer, J. Bolton, J. Herman, P. Hoppe, R. Pearce, and C. Sloan at the NOAA–NMFS Northwest Fisheries Science Center. The 2012 bile analyses were performed by Susan Snyder, Erin Pulster, and Dana Wetzel. The NMFS Southeast Regional Office provided appropriate authorizations and technical guidance; we thank R. Crabtree, S. Branstetter, E. F. Roche, and J. Brown. C. Reddy reviewed our draft manuscript. We also appreciate the careful reviews of two anonymous referees and the associate editor. Data summarized in this paper are available at http://gisdata.rc.usf.edu/cimage/summary.
Notes
1 The PAHs analyzed included the following LMW compounds: naphthalene (NPH), acenaphthylene (ACY), acenaphthene (ACE), fluorene (FLU), and anthracene+phenanthrene (ANT/PHN). The high-molecular-weight compounds included the following: fluoranthene (FLA), pyrene (PYR), chrysene (CHR), benzo[k]fluoranthene (BkF), indeno[1,2,3-cd]pyrene (IDP), benzo[b]fluoranthene (BbF), benz[a]anthracene (BaA), dibenz[a,c]anthracene+ dibenz[a,h]anthracene (DBA), benzo[a]pyrene (BaP), dibenzothiophene (DBT), benzo[e]pyrene (BeP), perylene (PER), and benzo[ghi]perylene (BZP).
REFERENCES
- Arkoosh, M. R., E. Clemons, P. Huffman, A. N. Kagley, E. Casillas, N. Adams, H. R. Sanborn, T. K. Collier, and J. E. Stein. 2001. Increased susceptibility of juvenile Chinook Salmon to vibriosis after exposure to chlorinated and aromatic compounds found in contaminated urban estuaries. Journal of Aquatic Animal Health 13:257–268.
- Balk, L., K. Hylland, T. Hansson, M. C. Berntssen, J. Beyer, G. Jonsson, A. Melbye, M. Grung, B. T. Torstensen, J. F. Borseth, H. Skarphedinsdottir, and J. Klungsoyr. 2011. Biomarkers in natural fish populations indicate adverse biological effects of offshore oil production. PLoS ONE [online serial] 6(5):e19735.
- BOEM (Bureau of Ocean Energy Management). 2012. Geographic mapping data in digital format. Available: http://www.data.boem.gov/homepg/data_center/mapping/geographic_mapping.asp. (April 2012).
- Carls, M. G., L. Holland, M. Larsen, T. K. Collier, N. L. Scholz, and J. P. Incardona. 2008. Fish embryos are damaged by dissolved PAHs, not oil particles. Aquatic Toxicology 88:121–127.
- Carls, M. G., A. C. Wertheimer, J. W. Short, R. M. Smolowitz, and J. J. Stegeman. 1996. Contamination of juvenile Pink and Chum Salmon by hydrocarbons in Prince William Sound after the Exxon Valdez oil spill. Pages 593–607 in S. D. Rice, R. B. Spies, D. A. Wolfe, and B. A. Wright, editors. American Fisheries Society, Symposium 18, Bethesda, Maryland.
- Heintz, R. A. 2007. Chronic exposure to polynuclear aromatic hydrocarbons in natal habitats leads to decreased equilibrium size, growth, and stability of Pink Salmon populations. Integrated Environmental Assessment and Management 3:351–363.
- Heintz, R. A., S. D. Rice, A. C. Werthheimer, R. F. Bradshaw, F. P. Thrower, J. E. Joyce, and J. W. Short. 2000. Delayed effects on growth and marine survival of Pink Salmon Onchorynchus gorbuscha after exposure to crude oil during embryonic development. Marine Ecology Progress Series 208:205–216.
- Hom, T., T. K. Collier, M. M. Krahn, M. S. Strom, G. M. Ylitalo, W. B. Nilsson, R. N. Paranjpye, and U. Varanasi. 2008. Assessing seafood safety in the aftermath of Hurricane Katrina. Pages 73–93 in K. D. McLaughlin, editor. Mitigating impacts of natural hazards on fishery ecosystems. American Fisheries Society, Symposium 64, Bethesda, Maryland.
- Hu, C., R. H. Weisberg, Y. Liu, L. Zheng, K. L. Daly, D. C. English, J. Zhao, and G. A. Vargo. 2011. Did the northeastern Gulf of Mexico become greener after the Deepwater Horizon oil spill? Geophysical Research Letters 38:L09601.
- Incardona, J. P., T. K. Collier, and N. L. Scholz. 2004. Defects in cardiac function precede morphological abnormalities in fish embryos exposed to polycyclic aromatic hydrocarbons. Toxicology and Applied Pharmacology 196:191–205.
- Incardona, J. P., L. D. Gardner, T. L. Linbo, T. L. Brown, A. J. Esbaugh, E. M. Mager, J. D. Stieglitz, B. L. French, J. S. Labenia, C. A. Laetz, M. Tagal, C. A. Sloan, A. Elizur, D. D. Benetti, M. Grosell, B. A. Block, and N. L. Scholz. 2014. Deepwater Horizon crude oil impacts the developing hearts of large predatory pelagic fish. Proceedings of the National Academy of Sciences of the USA 111:E1510–E1518.
- Incardona, J. P., C. A. Vines, B. F Anulacion, D. H. Baldwin, H. L. Day, B. L. French, J. S. Labenia, T. L. Linbo, M. S. Myers, O. P. Olson, C. A. Sloan, S. Sol, F. J. Griffin, K. Menard, S. G. Morgan, J. E. West, T. K. Collier, G. M. Ylitalo, G. N. Cherr, and N. L. Scholz. 2012. Unexpectedly high mortality in Pacific Herring embryos exposed to the 2007 Cosco Busan oil spill in San Francisco Bay. Proceedings of the National Academy of Sciences of the USA 109:E51–E58.
- Iqbal, J., R. J. Portier, and D. Gisclair. 2007. Aspects of petrochemical pollution in coastal Louisiana. Marine Pollution Bulletin 54:792–819.
- Jewett, S. C., T. A. Dean, B. R. Woodin, M. K. Hoberg, and J. J. Stegeman. 2002. Exposure to hydrocarbons 10 years after the Exxon Valdez oil spill: evidence from cytochrome P4501A expression and biliary FACs in nearshore demersal fishes. Marine Environmental Research 54:21–48.
- Kennedy, C. J., and F. C. P. Law. 1990. Toxicokinetics of selected polycyclic aromatic hydrocarbons in Rainbow Trout following different routes of exposure. Environmental Toxicology and Chemistry 9:133–139.
- Kennicutt, M. C. II, P. N. Boothe, T. L. Wade, S. T. Sweet, R. Rezak, F. J. Kelly, J. M. Brooks, B. J. Presley, and D. A. Wiesenburg. 1996. Geochemical patterns in sediments near offshore production platforms. Canadian Journal of Fisheries and Aquatic Sciences 53:2554–2566.
- Krahn, M. M., M. S. Myers, D. G. Burrows, and D. C Malins. 1984. Determination of xenobiotics in bile of fish from polluted waterways. Xenobiotica 14:633–646.
- Krahn, M. M., G. M. Ylitalo, J. Buzitis, J. L. Bolton, C. A. Wigren, S.-L. Chan, and U. Varanasi. 1993. Analyses of petroleum-related contaminants in marine fish and sediments following the Gulf oil spill. Marine Pollution Bulletin 27:285–292.
- Krahn, M. M., G. M. Ylitalo, and T. K. Collier. 2005. Analysis of bile of fish collected in coastal waters of the Gulf of Mexico potentially affected by Hurricane Katrina to determine recent exposure to polycyclic aromatic compounds (PACs). National Marine Fisheries Service, Northwest Fisheries Science Center, Seattle.
- Kvenvolden, K. A., and C. K. Cooper. 2003. Natural seepage of crude oil into the marine environment. Geo-Marine Letters 23:140–146.
- Lange, T., S. Mellergaard, W. Wosniok, V. Kadakas, and K. Neumann. 1999. Spatial distribution of grossly visible diseases and parasites in flounder (Platichthys felus) from the Baltic Sea: a synoptic survey. ICES Journal of Marine Science 56:138–147.
- Law, R. J., and J. Hellou. 1999. Contamination of fish and shellfish following oil spill incidents. Environmental Geosciences 6:90–98.
- Lima, A. L., J. W. Farrington, and C. M. Reddy. 2005. Combustion-derived polycyclic aromatic hydrocarbons in the environment—a review. Environmental Forensics 6:109–131.
- Lubchenco, J., M. McNutt, G. Dreyfus, S. A. Murawski, D. Kennedy, P. Anastas, S. Chu, and T. Hunter. 2012. Science in support of the Deepwater Horizon response—an introduction. Proceedings of the National Academy of Sciences of the USA 109:20212–20221.
- MacDonald, I. R., N. L. Guinasso, Jr, S. G. Ackleson, J. F. Amos, R. Duckworth, R. Sassen, and J. M. Brooks. 1993. Natural oil slicks in the Gulf of Mexico visible from space. Journal of Geophysical Research 98:16351–16364.
- MacDonald, I. R., J. F. Reilly, Jr, W. E. Best, R. Venkataramaiah, R. Sassen, N. L. Guinasso, Jr, and J. Amos. 1996. Remote sensing inventory of active oil seeps and chemosynthetic communities in the northern Gulf of Mexico. American Association of Petroleum Geologists Memoir 66:27–37.
- Martínez, M. L., R. A. Feagin, K. M. Yeager, J. Day, R. Costanza, J. A. Harris, R. J. Hobbs, J. López-Portillo, I. J. Walker, E. Higgs, P. Moreno-Casasola, J. Sheinbaum, and A. Yáñez-Arancibia. 2012. Artificial modifications of the coast in response to the Deepwater Horizon oil spill: quick solutions or long-term liabilities? Frontiers in Ecology and the Environment 10:44–49.
- McDonald, S. J., K. L. Willett, J. Thomsen, K. B. Beatty, K. Connor, T. R. Narasimhan, C. M. Erickson, and S. H. Safe. 1996. Sublethal detoxification responses to contaminant exposure associated with offshore oil production. Canadian Journal of Fisheries and Aquatic Sciences 53:2606–2617.
- McNutt, M., S. Chu, J. Lubchenco, T. Hunter, G. Dreyfus, S. A. Murawski, and D. Kennedy. 2012. Applications of science and engineering to quantify and control the Deepwater Horizon oil spill. Proceedings of the National Academy of Sciences of the USA 109:20222–20228.
- Meador, J. P., F. C. Sommers, G. M. Ylitalo, and C. A. Sloan. 2006. Altered growth and related physiological responses in juvenile Chinook Salmon (Oncorhynchus tschawytscha) from dietary exposure to polycyclic aromatic hydrocarbons (PAHs). Canadian Journal of Fisheries and Aquatic Sciences 63:2364–2376.
- Mitchell, R., I. R. MacDonald, and K. A. Kvenvolden. 1999. Estimation of total hydrocarbon seepage into the Gulf of Mexico based on satellite remote sensing images. EOS Transactions of the American Geophysical Union 80(49), Ocean Sciences Meeting Supplement OS242.
- Mitra, S. S., and T. S. Bianchi. 2003. A preliminary assessment of polycyclic aromatic hydrocarbon distributions in the lower Mississippi River and Gulf of Mexico. Marine Chemistry 82:273–288.
- Myers, M. S., C. M. Stehr, O. P. Olson, L. L. Johnson, B. B. McCain, S.-L. Chan, and U. Varanasi. 1994. Relationships between toxicopathic hepatic lesions and exposure to chemical contaminants in English Sole (Pleuronectes vetulus), Starry Flounder (Platichthys stellatus), and White Croaker (Genyonemus lineatus) from selected marine sites on the Pacific Coast, USA. Environmental Health Perspectives 102:200–215.
- Namdari, R., and F. C. O. Law. 1996. Toxicokinetics of water-borne pyrene in Rainbow Trout (Onchorhynchus mykiss) following branchial or dermal exposure. Aquatic Toxicology 35:221–235.
- NOAA (National Oceanic and Atmospheric Administration) NODC (National Oceanographic Data Center). 2013a. Gridded climatologies of the Gulf of Mexico of a variety of oceanic parameters. Available: http://www.nodc.noaa.gov/OC5/GOMclimatology/. (June 2014).
- NOAA (National Oceanic and Atmospheric Administration) NODC (National Oceanographic Data Center). 2013b. Data from CTD casts and other observations taken from ships following the DWH incident. Available: http://www.nodc.noaa.gov/General/DeepwaterHorizon/ships.html. (May 2014).
- Ocean Studies Board and Marine Board. 2003. Oil in the sea III. Inputs, fates, and effects. National Academies Press, Washington, D.C.
- OSAT (Operational Science Advisory Team). 2010. Summary report for sub-sea and sub-surface oil and dispersant detection: sampling and monitoring. U.S. Coast Guard, Unified Area Command, New Orleans, Louisiana. Available: http://www.restorethegulf.gov/sites/default/files/documents/pdf/OSAT_Report_FINAL_17DEC.pdf. (May 2014).
- Overton, E. B., B. M. Ashton, and M. S. Miles. 2004. Historical polycyclic and petroleum hydrocarbon loading in the northern central Gulf of Mexico shelf sediments. Marine Pollution Bulletin 49:557–563.
- Patterson, W. F. III, J. H. Cowan Jr., G. R. Fitzhugh, and D. L. Nieland, editors. 2007. Red Snapper ecology and fisheries in the U.S. Gulf of Mexico. American Fisheries Society, Symposium 60, Bethesda, Maryland.
- Peterson, C. H., M. C. Kennicutt II, R. H. Green, P. Montagna, D. E. Harper Jr., E. N. Powell, and P. F. Roscigno. 1996. Ecological consequences of environmental perturbations associated with offshore hydrocarbon production: a perspective on long-term exposure in the Gulf of Mexico. Canadian Journal of Fisheries and Aquatic Sciences 53:2637–2654.
- Peterson, C. H., S. D. Rice, J. W. Short, D. Esler, J. L. Bodkin, B. E. Ballachey, and D. B. Irons. 2003. Long-term ecosystem response to the Exxon Valdez oil spill. Science 302:2082–2086.
- Presley, B. J., T. L. Wade, P. Santschi, and M. Baskaran. 1998. Historical contamination of Mississippi River Delta, Tampa Bay and Galveston Bay sediments. NOAA Technical Memorandum NOS ORCA 127.
- Reddy, C. M., J. S. Aret, J. S. Seewald, S. P. Sylva, K. L. Lemkau, R. K. Nelson, C. A. Carmichael, C. P. McIntire, J. Fenwick, C. T. Ventura, B. A. S. Van Mooy, and R. Camilli. 2012. Composition and fate of gas and oil released to the water column during the Deepwater Horizon oil spill. Proceedings of the National Academy of Sciences of the USA 109:20229–20234.
- Reynaud, S., and P. Deschaux. 2006. The effects of polycyclic aromatic hydrocarbons on the immune system of fish: a review. Aquatic Toxicology 77:229–238.
- Santschi, P. H., B. J. Presley, T. L. Wade, B. Garcia-Romero, and M. Baskaran. 2001. Historical contamination of PAHs, PCBs, DDTs, and heavy metals in Mississippi River Delta, Galveston Bay and Tampa Bay sediment cores. Marine Environmental Research 52:51–79.
- Short, J. W., M. R. Lindeberg, P. M. Harris, J. M. Maselko, J. J. Pella, and S. D. Rice. 2004. Estimate of oil persisting on the beaches of Prince William Sound 12 years after the Exxon Valdez oil spill. Environmental Science and Technology 38:19–25.
- Sloan, C. A., D. W. Brown, R. W. Pearce, R. H. Boyer, J. L. Bolton, D. G. Burrows, D. P. Herman, and M. M. Krahn. 2005. Determining aromatic hydrocarbons and chlorinated hydrocarbons in sediments and tissues using accelerated solvent extraction and gas chromatography/mass spectrometry. Pages 631–651 in G. K. Ostrander, editor. Techniques in aquatic toxicology. CRC Press, Boca Raton, Florida.
- Sloan, C. A., D. W. Brown, G. M. Ylitalo, J. Buzitis, D. P. Herman, D. G. Burrows, G. K. Yanagida, R. W. Pearce, J. L. Bolton, R. H. Boyer, and M. M. Krahn. 2006. Quality assurance plan for analyses of environmental samples for polycyclic aromatic compounds, persistent organic pollutants, fatty acids, stable isotope ratios, lipid classes, and metabolites of polycyclic aromatic compounds. NOAA Technical Memorandum NMFS-NWFSC-77.
- Stehr, C. M., D. W. Brown, T. Hom, B. F. Anulacion, W. L. Reichert, and T. K. Collier. 2000. Exposure of juvenile Chinook and Chum salmon to chemical contaminants in the Hylebos Waterway of Commencement Bay, Tacoma, Washington. Journal of Aquatic Ecosystem Stress and Recovery 7:215–227.
- van Banning, P. 1987. Long-term recording of some fish diseases using general fishery research surveys in the southeast part of the North Sea. Diseases of Aquatic Organisms 3:1–11.
- Varanasi, U., D. W. Brown, T. Hom, D. G. Burrows, C. A. Sloan, L. J. Field, J. E. Stein, K. L. Tilbury, B. B. McCain, and S.-L. Chan. 1993. Supplemental information concerning a survey of Alaskan subsistence fish, marine mammal, and invertebrate samples collected 1989–91 for exposure to oil spilled from the Exxon Valdez. NOAA Technical Memo NMFS-NWFSC013.
- Varanasi, U., J. E. Stein, and M. Nishimoto. 1989. Biotransformation and disposition of polycyclic aromatic hydrocarbons (PAH) in fish. Pages 94–149 in U. Varanasi, editor. Metabolism of polycyclic aromatic hydrocarbons in the aquatic environment. CRC Press, Boca Raton, Florida.
- Vethaak, A. D. 1992. Diseases of flounder (Platichthys felus L.) in the Dutch Wadden Sea, and their relation to stress factors. Netherlands Journal of Sea Research 29:257–272.
- Vethaak, A. D., J. G. Jol, and C. Martinez-Gomez. 2011. Effects of cumulative stress on fish health near freshwater outlet sluices into the sea: a case study (1988–2005) with evidence for a contributing role of chemical contaminants. Integrated Environmental Assessment and Management 7:445–458.
- Wang, Z., M. Fingas, and D. S. Page. 1999. Oil spill identification. Journal of Chromatography A 843:369–411.
- Weisberg, R. H., L. Zheng, Y. Liu, S. Murawski, C. Hu, and J. Paul. In press. Did Deepwater Horizon hydrocarbons transit to the west Florida continental shelf? Deep Sea Research Part II: Topical Studies in Oceanography. DOI: 10.1016/j.dsr2.2014.02.002.
- White, P. A., S. Robitaille, and J. B. Rasmussen. 1999. Heritable reproductive effects of benzo[a]pyrene on the Fathead Minnow (Pimephales promelas). Environmental Toxicology and Chemistry 18:1843–1847.
- Whitehead, A., B. Dubansky, C. Bodinier, T. I. Garcia, S. Miles, C. Pilley, V. Raghunathan, J. L. Roach, N. Walker, R. B. Walter, C. D. Rice, and F. Galvez. 2012. Genomic and physiological footprint of the Deepwater Horizon oil spill on resident marsh fishes. Proceedings of the National Academy of Sciences of the USA 109:20298–20302.
- Ylitalo, G. M., M. M. Krahn, W. W. Dickhoff, J. E. Stein, C. C. Walker, C. L. Lassitter, E. S. Garrett, L. L. Desfosse, K. M. Mitchell, B. T. Noble, S. Wilson, N. B. Beck, R. A. Benner, P. N. Koufopoulos, and R. W. Dickey. 2012. Federal seafood safety response to the Deepwater Horizon oil spill. Proceedings of the National Academy of Sciences of the USA 109:20274–20279.
- Ziskowski, J. J., L. Despres-Patanjo, R. A. Murchelano, A. B. Howe, D. Ralph, and S. Atran. 1987. Disease in commercially valuable fish stocks in the Northwest Atlantic. Marine Pollution Bulletin 18:496–504.