
 ?Mathematical formulae have been encoded as MathML and are displayed in this HTML version using MathJax in order to improve their display. Uncheck the box to turn MathJax off. This feature requires Javascript. Click on a formula to zoom.
Abstract
The response behavior and performance characteristics of the recently introduced barrier discharge ionization detector (BID) for gas chromatography (GC-BID) were investigated by analyzing different classes of organic compounds such as alcohols, alkanes, cycloaliphatic compounds, polycyclic aromatic hydrocarbons (PAHs), and others. The results obtained by GC-BID were compared with those of gas chromatography with flame ionization detection (GC-FID), aiming to demonstrate the particular merits of the new BID detector over the well-established FID. The response of the BID not only was found to be strongly dependent on the detector settings, but also shows a high dependence on the analyte class and the individual analyte. The sensitivity of the BID detector compared to the FID was higher by a factor of ca. 4 on average when considering all compounds analyzed. The relative standard deviation (RSD) was better than 5% for the majority of the cases. The BID detector showed better precision (lower RSD) in comparison with the FID for the investigated compounds. Linear calibrations were obtained for the analytes over more than four orders of magnitude with coefficients of determination typically higher than 0.999 and the limits of detection varied from 0.04 to 1.48 ng/s for the GC-BID.
Introduction
More than 75 years after its invention (Martin and Synge Citation1941), gas chromatography still maintains its role as the most important and most powerful analytical separation technique for volatile and semivolatile compounds. Its high separation efficiency, flexibility, and sensitivity are among the most commonly named assets of this technique. Much of the success of modern gas chromatography is due to the availability of a large number of sensitive detectors which, depending on the particular use, may be highly selective (such as the spectrometric detectors), or on the contrary universally applicable (such as the flame ionization detector, FID, or the thermal conductivity detector, TCD) (Rosenberg Citation2006).
One of the most recently introduced GC detectors is the so-called barrier-discharge ionization detector (BID). Being related to the FID through its detection principle, it also responds—in contrast to the former—to N2 and O2 and oxidized organic substances. The BID is based on a dielectric-barrier discharge (DBD) as the ionization source. The DBD is a low-temperature helium plasma, operated in a state of thermal nonequilibrium. It is produced by an electric discharge between two electrodes, at least one of which has a dielectric material on its surface (Liu et al. Citation2011). The discharge is initiated by a high voltage alternating current (AC) that is applied to the dielectric material. If the applied voltage surpasses the breakdown voltage of the plasma gas (also called the discharge gas, in this case He), a discharge is initiated between the two electrodes. The produced metastable species and photons (ΔE up to 24.6 eV) are responsible for the ionization of the analytes. Because the electrode/dielectric barrier/electrode arrangement functions as a capacitor, each discharge is self-limiting and the formation of an electric arc between the electrodes (often associated with the sputtering of electrode material) is prevented (Gras et al. Citation2006; Jiang et al. Citation2014). The frequency and the voltage range from a few Hz to MHz and from 1 to 100 kV, respectively (Li et al. Citation2011a).
Originally described by Siemens (Citation1857), this type of plasma was initially only adopted in production processes due to its low plasma temperature and power consumption, its simple manufacture and long operational use (Kogelschatz Citation2003; Hu et al. Citation2011). Only more recently, analytical and spectroscopic applications have become more abundant, and the DBD has been used in a number of analytical and spectroscopic applications (Guo et al. Citation2015; Schütz et al. Citation2015)
Typical applications of the DBD in spectroscopy are as an atomization (Straka et al. Citation2018; Kratzer et al. Citation2018), excitation (Brandt et al. Citation2016), and ionization source (Hagenhoff and Hayen Citation2018; Huba, Mirabelli, and Zenobi Citation2018). The DBD has also been incorporated as ionization source in some GC detectors, e.g., as GC photoionization detector on a chip (Zhu et al. Citation2016) and as an atmospheric pressure ionization detector providing detection in the low parts per billion range (Kirk, Last, and Zimmermann Citation2017). The combination of the DBD with miniaturized photodiode array detection has been reported particularly for element-specific detection in a number of applications (Li et al. Citation2011; Han et al. Citation2014; Li, Jiang, and Hou Citation2015; Jiang et al. Citation2015).
Also, the dielectric-barrier ionization detector that has recently become commercially available for GC-BID (Shinada et al. Citation2012) is based on the principle of dielectric barrier discharge ionization with He as a plasma gas. The detector, consisting of a plasma generator and the charge collector, are operated at medium frequency and high voltage (5–30 kHz, 5 to 10 kV) applied to a central ring electrode while two outer electrodes are grounded. The quartz tube acts as a dielectric barrier across which a discharge is initiated. Ions are produced as a result of the oscillating electrical field between the electrodes and the ion current is subsequently detected. The particular design of the plasma source () avoids excessive dilution of the sample.
Figure 1. BID cross-sectional diagram and gas flow. Redrawn from Shinada et al. (Citation2012).
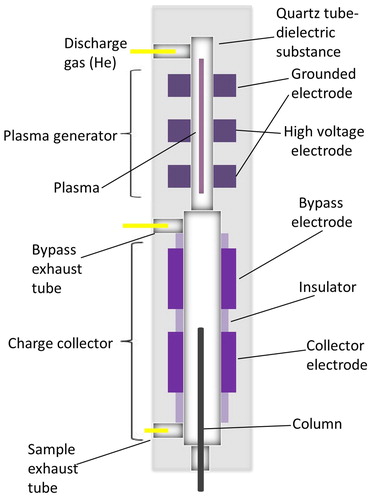
An important feature of the BID is the low plasma temperature that does not lead to a significant temperature change (more than 5 °C) in the quartz tube. This prevents sputtering or material loss from the discharge tube and allows its stable operation for an extended period of time. Furthermore, the low thermal load of the plasma decreases the noise at the detector compared to other high energy plasma sources (Shinada et al. Citation2012).
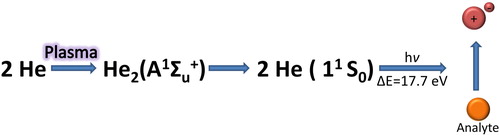
In the explanation of the working principles of the GC-barrier discharge ionization detector, the dominant role of the vacuum ultraviolet radiation in the ionization of the sample has to be emphasized. More specifically, it is suggested that the vacuum ultraviolet radiation (Δε = 17.7 eV), created by the dielectric barrier discharge and by the excited helium molecules according to the reaction ():
can photoionize the sample (Shinada et al. Citation2012). Assuming that the ionization of the BID is a photoionization process rather than the combined atomization and ionization that is prevalent in the FID, it is expected that the BID response is concentration-dependent rather than mass flow dependent as with the FID detector.
Figure 2. Ionization of the analyte (orange bowl) in a dielectric barrier-discharge sustained in He as plasma gas.
While it is claimed that the GC-BID system can be applied to a wide range of analytes, there are only few studies to verify its performance. In most cases, the BID has been used to determine a limited number of analytes within a given sample, mostly of low molecular weight and partially oxidized which is the range of analytes for which the BID is said to surpass the FID in its sensitivity and applicability (e.g., measurement of ethanol and water: Weatherly, Woods, and Armstrong Citation2014; measurement of CO2 after photocatalytic conversion: Iguchi et al. Citation2015; a 10 compound set of alkanes, benzenes, alcohols, and FAME after comprehensive two-dimensional GC: Franchina et al. Citation2015; gaseous formic and acetic acid after needle trap extraction: Ueta et al. Citation2017, Citation2018), and greenhouse gases CO2 and N2O: Pascale et al. Citation2017; as well as permanent gases, O2 and N2: Jo and Kim Citation2017).
The scope of this study is to systematically evaluate the performance of the commercial GC-BID system by determining a set of standards from various compound classes, such as alcohols, anilines, halogenated hydrocarbons, esters, alkanes, aldehydes, polycyclic aromatic hydrocarbons (PAHs), cyclic compounds, and comparing the results with the well-established flame ionization detector for GC. The analytical figures of merit of the BID are determined and provide a more consistent basis for the assessment of the merits of the dielectric barrier discharge as a GC detector.
Materials and methods
Reagents
All reagents used had a purity of at least 95%. Benzene, butylbenzene, cyclododecane, decane, ethyl acetate, ethylbenzene, isovaleraldehyde, pentachlorophenol, pentylbenzene, 2-propanol, fluoranthene, propylbenzene, n-octane, 1-decanol, 1-heptanol, n-heptane, cyclododecanone, chrysene, n-tetradecane, naphthalene, fluorene, phenanthrene, and pyrene were purchased from Fluka (Seelze, Germany). 1,4-Butanediol, 2-butoxyethyl acetate, 4-chlorophenol, 2,4-dichlorophenol, N,N-diethylamine, N,N-dimethylamine, isopropyl ether, phenol, chlorodecane, chlorododecane, cycloheptane, and cyclodecanone were obtained from Aldrich (Steinheim, Germany). Butylacetate, cyclohexane, cyclodecane, cyclopentane, dodecane, isopropyl acetate, hexane, toluene, 1-pentanol, and cyclopentane were purchased from Sigma-Aldrich (Vienna, Austria). Diethyl ether was purchased from Riedel-de Haën. Benzaldehyde, 1-bromodecane, 1-bromohexane, 1-bromo-3-chloropropane, methanol, 2-methoxy-1-propyl acetate, 1-nonanol, and chloroheptane were obtained from Merck (Vienna, Austria). 1-hexanol, cyclopentanone, and cyclohexanone were obtained from Loba (Fischamend, Austria). Chlorooctane and acenaphthene were from Hüls (Marl, Germany) and Acros Organics (Geel, Belgium), respectively.
All of the reagents were used for the standard solutions. Helium, used as the carrier and discharge gas, had a purity of 99.999% and was purchased by Messer (Austria).
Instrumentation
Measurements were performed using a GC-2010 Plus with a BID detector (Tracera) from Shimadzu and a GC-2010 Plus system with flame ionization detector and an AOC-20i autosampler (both Shimadzu, Kyoto, Japan). An RTX-5MS (5% diphenyl/95% dimethyl polysiloxane) GC column of 30 m × 0.25 mm × 0.25 μm from Restek (Bellefonte, PA) and a DB-5MS (5%-diphenyl/95% methylpolysiloxane) 30 m × 0.25 mm × 0.25 μm from Agilent J & W (Middleburg, Netherlands) were employed in this study.
Standard solutions
Standards were prepared in different solvents in order to ensure adequate solubility. Nine groups of standards were prepared at five concentration levels (100 pg/μL, 1 ng/μL, 10 ng/μL, 100 ng/μL, 1 μg/μL). The standards were grouped according to the chemical nature of compounds, namely the anilines, alcohols, aldehydes, halogenated hydrocarbons, phenols, alkanes, cycloalkanes, aromatic compounds, and esters. Alkanes, cyclic and aromatic compounds were dissolved in cyclopentane; the esters in diethyl ether, and the remaining standards in methanol.
Additional standards were analyzed to further test the instrument response. These were the cyclic ketones and cycloalkanes in cyclopentane, chlorinated benzenes, chlorinated alkanes and alcohols in methanol, benzenes, alkanes, and PAHs in dichloromethane. These solutions were prepared at two concentration levels (1 and 100 ng/μL) and an alkane standard (C10-C17) in heptane was prepared at 1 ng/μL.
Analytical procedure
Injections of 1 μL of each standard were made into the GC-BID and GC-FID system in split mode with split ratio of 20:1. In the optimized method, the BID was operated at a temperature of 300 °C; the FID at a temperature of 250 °C; the injector temperature was 250 °C in both cases; a column flow of 1.08 mL/min, resulting in a carrier gas linear velocity of 25.5 cm/s; purge flow of 3 mL/min; total flow of 25.8 mL/min; inlet pressure of 97.4 kPa; equilibration time of 1 min; and a discharge gas flow of 50 mL/min. The temperature program for the oven was 3 min at 50 °C and increased at 20 °C/min up to 250 °C with a hold time of 4 min. The total analysis time was 17 min.
The second set of standards was analyzed with a similar method but with an initial hold time of only 1 min instead of 3 min which provided an analysis time of 15 min, and with the DB-5MS column. For the PAHs and the alkane standard (C10–C17), the linear ramp of the oven program was extended to 280 °C and the FID temperature was 300 °C.
Results and discussion
Optimization of GC-BID operating conditions
Effect of the septum purge flow rate
The septum purge flow rate is a parameter whose importance is largely underestimated in gas chromatographic analysis. Its optimization is important as a correctly set septum purge flow prevents the contamination of the carrier gas inlet line and removes septum bleed volatiles from the system. On the other hand, an excessive septum purge flow may lead to unintentional dilution of the sample, and hence reduced sensitivity. For this reason, different purge flow rates were examined during analysis. The flow rates ranged from 0.5 to 10 mL/min.
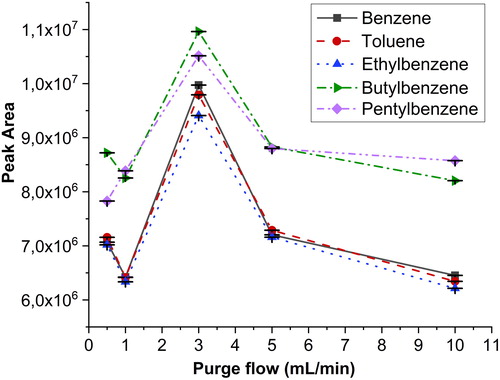
shows the response of a standard with four aromatic compounds. The optimum purge flow rate was 3 mL/min because the lower and higher rates were unable to provide greater peak signals—on the low side apparently due to less efficient sample transfer and on the high side due to increased dilution. The current result is in good agreement with the purge flow rate recommended by the manufacturer.
Figure 3. Effect of the purge flow for aromatic compounds at flow rates of 0, 1, 3, 5, and 10 mL/min. The error bars represent ± one standard deviation.
Effect of the discharge gas flow rate
In order to understand the impact of the system flow rates on the instrument response, we examined the effect of the flow rate of the discharge gas. The instrument can function within a specific flow rate range from relatively low values at which plasma stability may be affected up to ca. 100 mL/min. According to the information provided by the manufacturer, the column flow and discharge gas flow must be adjusted in mutual correspondence: Depending on the particular discharge gas flow rate used, the column flow should be adjusted accordingly. The reason for that apparently lies in the increased pressure at the GC column end when a higher flow rate and thus higher pressure is applied to the detector.
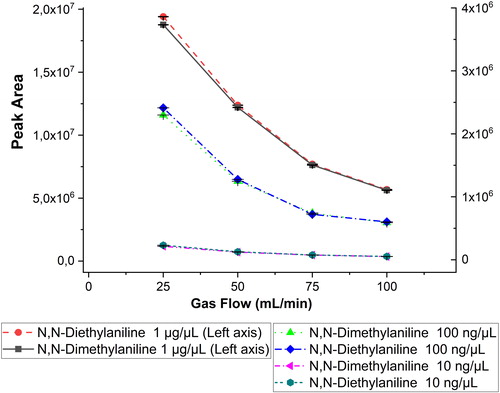
In this work, four flow rates (25, 50, 75, and 100 mL/min) were used for the determination of several compounds at different concentrations and with similar column flow. The evaluation of a set of selected standards at different detector flow rates in shows a noteworthy influence of the detector flow rate on signal intensity. Higher gas flow rate decreases the signal for the studied compounds. Although the discharge gas flow rate of 25 mL/min gave the best response, it was not preferred because it is at the lower end of the acceptable operating range of the instrument, and according to the manufacturer could affect both the reproducibility of measurement as well as have an adverse effect on the instrument long-term stability. Hence, a flow rate of 50 ml/min was chosen for all further measurements, representing a compromise between the anticipated signal stability and observed signal loss. This flow rate is in agreement with the manufacturer’s recommended flow rate.
Figure 4. Diagram demonstrating the effect of the discharge gas flow rate for anilines at concentrations of 10 ng/μL, 100 ng/μL, and 1 μg/μL) and gas flow rates of 25, 50, 75, and 100 mL/min. The error bars represent ± one standard deviation. For the higher concentration, the left axis applies, and for the two lower concentrations, the right axis applies.
The results from the purge and discharge gas flow rate investigation indicate the high dependence of the instrument response and sensitivity on the flow rate conditions and attest to the importance of optimizing these flow rates.
Comparison with the FID detector
The measurements reported subsequently are performed under optimum conditions for GC-BID and GC-FID regarding the temperatures and detector flow rates. The same split ratio and temperature program was used for the measurements on both instruments as described in the experimental section. All standards were measured in three replicates on the same day for both detectors.
The chromatograms obtained for both detectors and the investigated sets of standards were perfectly comparable (). Notably, no excessive detector-related peak broadening or peak tailing was observed with small exceptions in the case of amine compounds, easily explainable with their high tendency to interact with imperfectly inert surfaces. The retention times for the compounds were consistent between the techniques.
Figure 5. Comparison of chromatograms for four groups with the BID and the FID at 100 ng/μL: esters, upper left; alkanes, lower left; cyclic, upper right; and aromatic, lower right. Analytical conditions: injector temperature 250 °C; column flow 1.08 mL/min, 20:1 split; discharge gas flow 50 mL/min; oven initially at 50 °C (3 min) and increased at 20 °C/min to 250 °C (4 min).
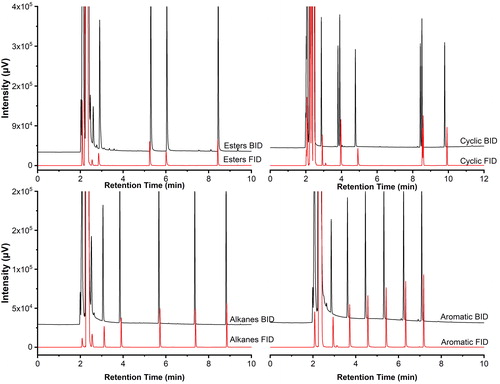
As a means of assessing the performance of the detector under the given chromatographic conditions, the resolution was calculated for the following compounds and their respective neighbor peaks: 1-butanol and isoamyl alcohol; 1-bromo-3-chloropropane and 1-bromohexane; 2,4-dichlorophenol and 4-chlorophenol; butylbenzene and pentylbenzene; butylacetate and 2-methoxy-1-propyl acetate. The resolution factors were in the range from 1.4 to 10.6 for the BID and 2.1-14.1 for the FID and are listed in . It should be noted that even in the case of the most critical separation, the resolution of the 2,4-dichlorophenol and 4-chlorophenol peaks was still satisfactory. The detector does not suffer from the introduction of a high concentration of matrix as long as it is sufficiently volatile to not cause further chromatographic problems (e.g., sample carry-over, increased background, peak tailing, or retention time shifts).
Table 1. Chromatographic resolution obtained for the BID and FID using identical separation conditions for adjacent peak pairs.
Analytical figures of merit were evaluated for all analytes from the corresponding calibration graphs using five concentration levels and are summarized in . The calibration curves were constructed by plotting the peak area of the signal (y axis) as function of the concentration in the x axis. However, in some cases, the standards could not be detected at the lowest level of the calibration in which case the calibration and calculations were performed with the remaining levels. The coefficients of determination (R2) () were typically more than 0.999 for both detectors. The R2 reached >0.9999 for anilines, halogenated compounds, phenols, alcohols, cyclic, and aromatic compounds with the BID and for four compounds also with the FID.
Table 2. Comparison of the limit of detection (LOD), limit of quantification (LOQ), and relative standard deviation (RSD) of the GC-BID and GC-FID.
The relative standard deviation (RSD) was determined and the results were found acceptable for both detectors with the majority of the RSD values being lower than 5%, except for the measurements at the lowest concentrations injected (1 ng/μL, 100 pg/μL), where the relative precision increased to above 10% (). Particularly, the halogenated compounds and aldehydes had large standard deviations for repeated measurements at low concentrations. A large part of the encountered variability is due to the low concentration levels chosen for these measurements, considering that already for statistical reasons, the RSD approaches the value of 33% when the concentration is close to the limit of quantification (LOQ), and may rise even to 50% at the lower limit of the quantitative working range. The RSD values for most analytes were lower for the BID. For the standards measured at two concentrations, the RSD was also investigated after ten days and it changed less than 20% for the 1 ng/μL concentration.
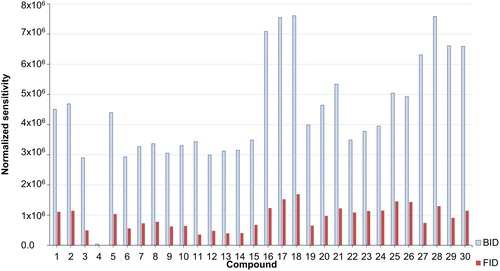
compares the sensitivity of the BID to that of the FID for the standards at five concentration levels. In general, the sensitivity of the BID is higher than the FID sensitivity. The sensitivity was determined as the slope of the calibration curve, and the results vary depending on the analyte. The BID provides for all analytes and analyte classes a higher response than the FID, although the difference in sensitivity depends on the particular class of compounds. Thus, the sensitivity of the BID detector was found to be higher than the sensitivity of the FID by a factor of 3.1 for anilines, 4.1 for aldehydes, 3.7 for halogens, 3.8 for phenols, 6.4 for alcohols, 4.1 for alkanes, 4.1 for cyclic compounds, 2.4 for aromatics, and 5.9 for esters. Generalizing this finding over all classes of compounds, the sensitivity of the BID was higher on average by a factor of 4.2 compared to the FID.
Figure 6. Normalized sensitivity of the BID in comparison to the FID. Normalized sensitivity: (compound sensitivity-lowest sensitivity from all 30 compounds)/lowest sensitivity from all 30 compounds. Compound numbers: (1) N,N-dimethylaniline, (2) N,N-diethylaniline, (3) isovalevaldehyde, (4) benzaldehyde, (5) 1-bromo-3-chloropropane, (6) 1-bromohexane, (7) 1-bromodecane, (8) phenol, (9) 2,4-dichlorophenol, (10) 4-chlorophenol, (11) 2-propanol, (12) 1-butanol, (13) isoamyl alcohol, (14) 1,4-butanediol, (15) 1-octanol, (16) heptane, (17) decane, (18) dodecane, (19) cyclohexane, (20) cyclodecane, (21) cyclododecane, (22) benzene, (23) toluene, (24) ethylbenzene, (25) butylbenzene, (26) pentylbenzene, (27) ethyl acetate, (28) butyl acetate, (29) 2-methoxy-1-propyl acetate, and (30) 2-butoxyethyl acetate.
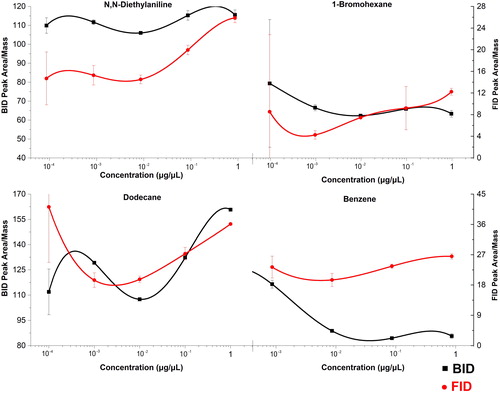
In the next step, response factors (RFs, determined as peak area/mass) were calculated for the individual compounds and investigated more closely to detect any systematic trends. reports the RFs for four analytes from different chemical classes. Although not completely homogeneous, no concentration dependence of the RFs can be observed, and the variations observed are more likely an effect of the chromatographic conditions, rather than the detection. The obtained RFs for the BID were generally higher, reflecting the higher sensitivity of the BID versus the FID.
Figure 7. Concentration dependence of the response factors (peak area/mass) for four compounds at five concentrations. The error bars represent ± one standard deviation.
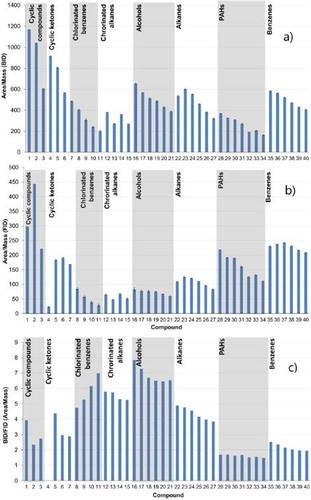
Using the results from the measurement of standards at a higher concentration level (100 ng/μL), the difference in RFs for both detectors is depicted in in form of the response factor ratio RF(BID)/RF(FID). In , the RFs of different classes of chemical compounds are reported. It is evident that the BID RFs, although generally higher than those of the FID, differ significantly. The compound class that has the highest response ratio, and thus the highest relative sensitivity in the comparison of BID and FID, is the one of the alcohols, followed by the halogenated compounds. Somewhat surprisingly, the PAHs had the lowest and most constant RF ratio between BID and FID.
Figure 8. Diagram with the specific peak area (area per mass) values per compound for both detectors. Analytes: (1) cyclohexane, (2) cycloheptane, (3) cyclododecane, (4) cyclopentanone, (5) cyclohexanone, (6) cyclodecanone, (7) cyclododecanone, (8) chlorobenzene, (9) 1,2-dichlorobenzene, (10) 1,2,3-trichlorobenzene, (11) 1,2,3,4-tetrachlorobenzene, (12) chloroheptane, (13) chlorooctane, (14) chlorodecane, (15) chlorododecane, (16) 1-pentanol, (17) 1-hexanol, (18) 1-heptanol, (19) 1-octanol, (20) 1-nonanol, (21) 1-decanol, (22) n-hexane, (23) n-heptane, (24) n-octane, (25) n-decane, (26) n-dodecane, (27) n-tetradecane, (28) naphthalene, (29) acenaphthene, (30) fluorene, (31) phenanthrene, (32) fluoranthene, (33) pyrene, (34) chrysene, (35) benzene, (36) toluene, (37) ethylbenzene, (38) propylbenzene, (39) butylbenzene, and (40) pentylbenzene.
The above observations can be explained through the different ionization mechanisms in the BID and the FID. Since the main route of ionization in the BID is through photoionization, it can be expected that a constant number of charges (cations and electrons) are produced per mole of analyte molecules. In contrast to this, the FID generates its signal by completely atomizing a molecule and simultaneously ionizing the carbon fragments produced. The FID response is thus not concentration-dependent (mol/s), but mass-dependent (g/s).
Moreover, the FID response is also diminished compared to pure hydrocarbons for analytes that contain heteroelements. According to our chemical understanding, a carbon atom bound to one or more heteroatoms such as O, S, Cl, or Br is considered already as oxidized. It cannot be further oxidized, which reduces incrementally the response of the FID. This concept is already known for long under the term “effective carbon number” (ECN) concept (Scanlon and Willis Citation1985) and can be used to theoretically calculate the FID RF of an analyte as a function of the carbon number and the functional groups attached to the carbon backbone.
The BID/FID RF ratios show remarkable trends within the individual compound classes: For example, the RF ratio clearly increases for the chlorinated compounds investigated with the degree of substitution by chlorine while it decreases for some of the other compound classes with chain length.
In order to understand which phenomenon is responsible for such behavior, presents the original RFs of the BID ( and the FID (). For the halogenated compounds—which in the current case are mono- to tetrasubstituted benzenes—this is explained by a strongly decreasing RF of the FID with increase in the chlorine substitution of the aromatic ring.
A contrary effect is seen for the aliphatic alcohols and the n-alkanes whose response decreases with increasing chain length. Since this can be caused both by a decrease of the response of the BID or by the increase of the RF of the FID, the RFs of the two instruments were evaluated and plotted separately. The results show that the main influence on this trend is the significant change in specific response for the BID. This change is due to the fact that the RFs were normalized to mass of analyte, not to amount of substance. Given that the BID leads to the formation of single-charged cations, the amount of ions generated is proportional to the amount of substance of this analyte, but inversely proportional to the molecular mass of this compound. The longer the aliphatic chain of the analyte, the lower its specific RF. This appears to be the main reason for the observed decrease in RF ratios for the n-alcohols and n-alkanes with increasing molecular mass or chain length.
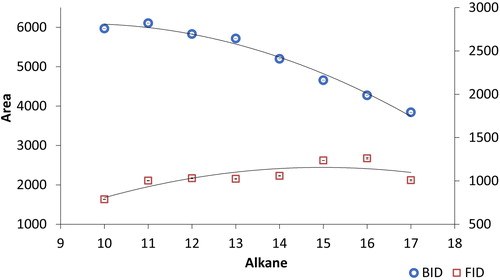
A further experiment was performed in order to verify that the BID responds to the amount of substance arriving at the detector per time unit, rather than mass of analyte per time unit. To this end, an alkane standard with the same mass concentration and carbon numbers from ten to seventeen was analyzed by both detectors. exhibits a decrease of the response with increasing carbon number in the BID in contrast to the FID response where this decrease is not evident. The reason for this difference is that the BID, in contrast to the FID, does not lead to the complete atomization of the analytes because of its low thermal energy and excitation. Thus, only one cation is formed per molecule in the BID with one electron being produced in the same process while a Cn compound can produce n carbocations and n electrons in the BID. The ionization yield is clearly lower than unity but can be expected to be similar for both excitation sources.
Figure 9. Response of the barrier discharge ionization detector (BID) and flame ionization detector (FID) for alkane standards C10-C17 at 1 ng/μL. The analytical conditions are the same as in .
Limits of detection and quantification
The limit of detection (LOD) was determined by two different approaches. The first was based on the definition of the LOD as the concentration at which the signal-to-noise ratio (S/N) is equal to 3. Both signal and noise are expressed in peak height units. The second approach uses measurements of the standard deviation of the blank σ (n = 5) to calculate the LOD as 3σ/S (where S is slope or sensitivity) from the regression ; ). Also, in this case, the regression line was calculated for the peak height.
Figure 10. Comparison of the limits of detection (LODs) for the two detectors: (a) calculation when the value of the signal-to-noise ratio (S/N) equals to 3. The compounds on the x axis are identified in . (b) Use of the height of the blank measurement (n = 5) to calculate the limit of detection using the 3σ/S relationship where S is the slope or sensitivity.
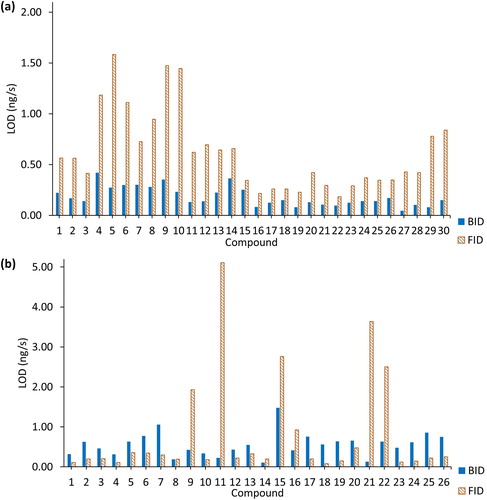
Given that the calculation of the LOD was performed in two different ways, there are evident differences between the results. According to the LOD values obtained with the S/N ratio method, the BID always exhibited better detection limits than the FID, especially for the halogenated, oxygenated compounds, and for some alkanes where the BID LOD was one order of magnitude lower than for the FID. The LOD values determined from the blank covered two orders of magnitude, ranging from the medium pg/s to the low ng/s range.
The LOD in the 3σ/S results is influenced by the background in the blank samples. The background in the BID blanks was high as a consequence of residual impurities in the He carrier and plasma gas and hence the LOD values were higher. For the FID, the background was low in comparison to the BID and the LODs were lower in comparison to the values obtained with the other method. Generally, the FID values were lower with exceptions for compounds such as heptane and cyclododecane. Because of the high background in the blanks, the LOD values do not reflect the same increase in sensitivity of the BID compared to the FID as when evaluating the slopes of the calibration lines of the two detectors which is typically used to express the instrumental or method sensitivity.
Conclusions
The current study aimed to provide a better understanding and a more comprehensive and quantitative characterization of the response behavior of the BID and to compare its performance to that of the FID for gas chromatography.
The detection principle of the BID was identified as a photoionization process of the analyte molecules, caused by metastable He species created in the dielectric barrier discharge of the detector unit. As a result, the BID shows a concentration-dependent rather than mass-dependent response behavior compared to the FID. In general, the BID shows a sensitivity that is about four times higher than that of the FID, which is particularly the case for the compounds to which the FID has a medium to low response, notably oxygen- and halogen-containing compounds.
The BID response also requires optimization and is dependent on various factors, such as the detector temperature and detector make-up gas flow rate. Depending on the particular compound, detection limits for the BID in the two-digit picogram range (absolute) were achieved. We expect that limits of detection in the low one-digit pg (absolute) range can be reached. However, to this end, even higher requirements are imposed to the carrier gas supply—the use of He with purity of better than 99.9999% rather than better than 99.999% as is often recommended for GC-FID is—and to the stability of the chromatographic columns (i.e., absence of bleed).
In general, the BID has similar robustness and ease of operation as the FID. Two practical advantages of the BID compared to the FID are the absence of a burner head which may clog with time, and that only He is required as detector gas which is also the GC carrier gas. The investment for the commercial BID instrument is moderately higher than that for a regular FID.
To summarize, the BID is a highly versatile and an interesting addition to the toolkit of gas chromatographic detectors. Due to its functioning principles, it is best used for low-molecular weight, heteroatom containing analytes where it easily outperforms the FID, while this advantage is gradually lost with increasing molecular weight of the analyte. Moreover, achieving highest performance with the BID imposes even more stringent requirements and control of the operating conditions and system state than for GC-FID. Where the above stated conditions are met—e.g., in the analysis of low molecular weight ozone precursors—the BID will find highly useful niches of application.
Acknowledgements
One of the authors (M.A.) would like to acknowledge an Erasmus fellowship that allowed her to carry out this work. Part of this study was carried out within the Austrian Research Promotion Agency (FFG) funded project “DianaBatt” (Project number 858298) which is also gratefully acknowledged.
References
- Brandt, S., A. Schütz, F. D. Klute, J. Kratzer, and J. Franzke. 2016. Dielectric barrier discharges applied for optical spectrometry. Spectrochimica Acta Part B 123:6–32. doi: 10.1016/j.sab.2016.07.001.
- Franchina, F. A., M. Maimone, D. Sciarrone, G. Purcaro, P. Q. Tranchida, and L. Mondello. 2015. Evaluation of a novel helium ionization detector within the context of (low-)flow modulation comprehensive two-dimensional gas chromatography. Journal of Chromatography A 1402:102–9. doi: 10.1016/j.chroma.2015.05.013.
- Gras, R., J. Luong, M. Monagle, and B. Winniford. 2006. Gas chromatographic applications with the dielectric barrier discharge detector. Journal of Chromatographic Science 44(2):101–7. doi: 10.1093/chromsci/44.2.101.
- Guo, C., F. Tang, J. Chen, X. Wang, S. Zhang, and X. Zhang. 2015. Development of dielectric-barrier-discharge ionization. Analytical and Bioanalytical Chemistry 407(9):2345–64. doi: 10.1007/s00216-014-8281-y.
- Hagenhoff, S., and H. Hayen. 2018. LC/MS analysis of vitamin D metabolites by dielectric barrier discharge ionization and a comparison with electrospray ionization and atmospheric pressure chemical ionization. Analytical and Bioanalytical Chemistry 410(20):4905–11. doi: 10.1007/s00216-018-1137-0.
- Han, B., X. Jiang, X. Hou, and C. Zheng. 2014. Dielectric barrier discharge carbon atomic emission spectrometer: universal GC detector for volatile carbon-containing compounds. Analytical Chemistry 86(1):936–42. doi: 10.1021/ac403662w.
- Hu, J., W. Li, C. Zheng, and X. Hou. 2011. Dielectric barrier discharge in analytical spectrometry. Applied Spectroscopy 46(5):368–87. doi: 10.1080/05704928.2011.561511.
- Huba, A. K., M. F. Mirabelli, and R. Zenobi. 2018. High-throughput screening of PAHs and polar trace contaminants in water matrices by direct solid-phase microextraction coupled to a dielectric barrier discharge ionization source. Analytica Chimica Acta 1030:125–32. doi: 10.1016/j.aca.2018.05.050.
- Iguchi, S., K. Teramura, S. Hosokawa, and T. Tanaka. 2015. Effect of the chloride ion as a hole scavenger on the photocatalytic conversion of CO2 in an aqueous solution over Ni–Al layered double hydroxides. Physical Chemistry Chemical Physics 17(27):17995–8003. doi: 10.1039/C5CP02724A.
- Jiang, X., C. Li, Z. Long, and X. Hou. 2015. Selectively enhanced molecular emission spectra of benzene, toluene and xylene with nano-MnO2 in atmospheric ambient temperature dielectric barrier discharge. Analytical Methods 7(2):400–4. doi: 10.1039/C4AY02194K.
- Jiang, X., Y. Chen, C. Zheng, and X. Hou. 2014. Electrothermal vaporization for universal liquid sample introduction to dielectric barrier discharge microplasma for portable atomic emission spectrometry. Analytical Chemistry 86(11):5220–4. doi: 10.1021/ac500637p.
- Jo, S.-H., and K.-H. Kim. 2017. The applicability of a large-volume injection (LVI) system for quantitative analysis of permanent gases O2 and N2 using a gas chromatograph/barrier discharge ionization detector. Environmental Monitoring and Assessment 189(7):317.
- Kirk, A. T., T. Last, and S. Zimmermann. 2017. A sensitive gas chromatography detector based on atmospheric pressure chemical ionization by a dielectric barrier discharge. Journal of Chromatography A 1483:120–6. doi: 10.1016/j.chroma.2016.12.071.
- Kogelschatz, U. 2003. Dielectric-barrier discharges: their history, discharge physics, and industrial applications. Plasma Chemistry and Plasma Processing 23(1):1–46.
- Kratzer, J., S. Musil, K. Marschner, M. Svoboda, T. Matoušek, Z. Mester, R. E. Sturgeon, and J. Dědina. 2018. Behavior of selenium hydride in heated quartz tube and dielectric barrier discharge atomizers. Analytica Chimica Acta 1028:11–21. doi: 10.1016/j.aca.2018.05.053.
- Li, C., X. Jiang, and X. Hou. 2015. Dielectric barrier discharge molecular emission spectrometer as gas chromatographic detector for amines. Microchemical Journal 119:108–13. doi: 10.1016/j.microc.2014.11.005.
- Li, W., C. Zheng, G. Fan, L. Tang, K. Xu, Y. Lv, and X. Hou. 2011. Dielectric barrier discharge molecular emission spectrometer as multichannel GC detector for halohydrocarbons. Analytical Chemistry 83(13):5050–5. doi: 10.1021/ac2007224.
- Liu, Z., Z. Zhu, Q. Wu, S. Hu, and H. Zheng. 2011. Dielectric barrier discharge-plasma induced vaporization and its application to the determination of mercury by atomic fluorescence spectrometry. The Analyst 136(21):4539–44. doi: 10.1039/c1an15332c.
- Martin, A. J. P., and R. L. M. Synge. 1941. A new form of chromatogram employing two liquid phases. Biochemical Journal 35(12):1358–68. doi: 10.1042/bj0351358.
- Pascale, R., M. Caivano, A. Buchicchio, I. M. Mancini, G. Bianco, and D. Caniani. 2017. Validation of an analytical method for simultaneous high-precision measurements of greenhouse gas emissions from wastewater treatment plants using a gas chromatography-barrier discharge detector system. Journal of Chromatography A 1480:62–9. doi: 10.1016/j.chroma.2016.11.024.
- Rosenberg, E. 2006. Trace organic analysis by gas chromatography with selective detectors. In Encyclopedia of analytical chemistry, eds. R. A. Meyers and M. P. Miller. Hoboken, NJ: Wiley.
- Scanlon, J. T., and D. E. Willis. 1985. Calculation of flame ionization detector relative response factors using the effective carbon number concept. Journal of Chromatographic Science 23(8):333–40. doi: 10.1093/chromsci/23.8.333.
- Schütz, A., S. Brandt, S. Liedtke, D. Foest, U. Marggraf, and J. Franzke. 2015. Dielectric barrier discharge ionization of perfluorinated compounds. Analytical Chemistry 87(22):11415–9. doi: 10.1021/acs.analchem.5b03538.
- Shinada, K., S. Horiike, S. Uchiyama, R. Takechi, and T. Nishimoto. 2012. Development of new ionization detector for gas chromatography by applying dielectric barrier discharge. Shimadzu Review SR13_001E:1–5.
- Siemens, W. 1857. Ueber die elektrostatische Induktion und die Verzögerung des Stroms in Flaschendrähten. Annalen der Physik und Chemie 178(9):66–122. doi: 10.1002/andp.18571780905.
- Straka, M., S. Burhenn, K. Marschner, S. Brandt, U. Marggraf, J. Dědina, J. Franzke, and J. Kratzer. 2018. Novel designs of dielectric barrier discharge hydride atomizers for atomic spectrometry. Spectrochimica Acta Part B 146:69–76. doi: 10.1016/j.sab.2018.05.006.
- Ueta, I., Y. Nakamura, K. Fujimura, S. Kawakubo, and Y. Saito. 2017. Determination of gaseous formic and acetic acids by a needle-type extraction device coupled to a gas chromatography-barrier discharge ionization detector. Chromatographia 80(1):151–6. doi: 10.1007/s10337-016-3201-2.
- Ueta, I., Y. Nakamura, S. Kawakubo, and Y. Saito. 2018. Determination of aqueous formic and acetic acids by purge-and-trap analysis with a needle-type extraction device and gas chromatography barrier discharge ionization detector. Analytical Sciences 34(2):201–5. doi: 10.2116/analsci.34.201.
- Weatherly, C. A., R. M. Woods, and D. W. Armstrong. 2014. Rapid analysis of ethanol and water in commercial products using ionic liquid capillary gas chromatography with thermal conductivity detection and/or barrier discharge ionization detection. Journal of Agricultural and Food Chemistry 62(8):1832–8. doi: 10.1021/jf4050167.
- Zhu, H., M. Zhou, J. Lee, R. Nidetz, K. Kurabayashi, and X. Fan. 2016. Low-power miniaturized helium dielectric barrier discharge photoionization detectors for highly sensitive vapor detection. Analytical Chemistry 88(17):8780–6. doi: 10.1021/acs.analchem.6b02180.