
 ?Mathematical formulae have been encoded as MathML and are displayed in this HTML version using MathJax in order to improve their display. Uncheck the box to turn MathJax off. This feature requires Javascript. Click on a formula to zoom.
ABSTRACT
We run recentered influence function (RIF) regressions, using Firpo et al. (2007) distributional approach to identify each control variable’s contribution on the decomposition of wage changes. Using the Egyptian Labour Market Surveys 1998–2012 for waged men we find that wage changes between 1998 and 2012 mainly resulted in increased inequality. The richer percentiles have persistently enjoyed disproportionately larger positive changes in real hourly wages. Whilst increasing in all three wage gaps, inequality increased the most between the top and bottom deciles (90–10 gap), i.e. between the lowest and highest wage earners. This increase in inequality is primarily driven by the unexplained wage structure effect. The distinct labour market segments are foremost responsible for the increased inequality trend. Private sector informality is the largest contributor to increased inequality. The sector does not adhere to a minimum wage, and being unregulated it has responded dramatically to the severe competitive pressures caused by the departing middle classes of the public sector. It suppressed mid and low-end wages resulting in sharp wage gaps at the tails. Public sector wage setting dynamics and the direction of labour movements since liberalization cause the sector to contribute more to wage inequality than does its formal private counterpart.
I. Introduction
The Egyptian economy has liberalized since the 1970s, shifting from a state-led development model into a market-oriented one which has transformed the structure of the labour market. This liberalization was not preceded by the necessary regulatory framework to assist the transition to a market economy. Lack of regulation allowed the emergence of corruption and crony capitalism, stifling the growth of a formal private sector. People have been driven to the unregulated informal sector, a trend reinforced by public sector retrenchment (El-Haddad Citation2020a).
The financial crisis of 2008 and the uprisings in 2011 further fuelled the growth of informality. By 2012 informal male employment constituted about 60% of overall wage employment in Egypt.Footnote1
Whilst the informal sector has been studied for many years in many countries around the world (cf. La Porta and Shleifer Citation2014; Loayza Citation2016, Harris and Todaro1970), there have been little analysis on the link between informality and wage inequality. An emerging literature is addressing informality’s role in wage inequality (Binelli Citation2016; Tansel and Ozdemir Citation2019). This paper contributes to and extends this literature with an analysis of Egypt.
This approach differs from the traditional Mincerian approach used by Tansel and Ozdemir (Citation2019) in their analysis of the informal sector wage gap within the Egyptian private sector. In the Mincerian approach wages are determined by observed and unobserved characteristics. The authors showed the persistence of the gap in the face of a range of sensitivity analyses. Here we quantify the contribution of informality to observed inequality in the distribution of wages over time, i.e. in the change in wage inequality. This analysis basically differs from that of Tansel and Ozdemir (Citation2019) in three ways. First, we include the public sector in our analysis.Footnote2 Our analysis identifies this sector as the main contributor after the informal sector to the observed increase in wage inequality over time amongst the economy’s four distinct labour market segments (the informal and informal private sectors and the formal and informal public sectors). Second, we take new entrants to the different labour market segments and the net effect of movements by incumbent labour between these segments into account. Finally, we analyse whether the contribution to the changes in the wage distribution in different quantiles is predominately a composition or a wage structure effect. Based on this decomposition we examine price-setting dynamics of each labour market segment. We first demonstrate where along the wage distribution of each segment the competitive pressures took place. We then investigate the way each segment responded to these pressures given its wage-setting behaviour.
The next section embeds the growth of informality with the major macro reforms implemented in Egypt during the four decades preceding 2012. Section three reviews the literature on the drivers of wage inequality. The methodology is presented in section four. Section five presents the data, the trends of temporal inequality and labour transitions. Sections six and seven contain the regression and decomposition results, highlighting the differing sectoral wage-setting dynamics. Section eight concludes.
II. Context to the growth of informality
After two decades of mostly unregulated partial liberalization, the government initiated a formal liberalization process in 1991 through adopting a structural economic reform programme (ERSAP). The program included reducing the size of the public sector. However, these first reforms retained main features of former import substitution policies and failed to fully deregulate the economy to create the necessary institutions – such as a competition authority, a streamlined tax system or a deregulated labour law- that support a formal market-based economy (El-Haddad Citation2015a, Citation2015b, Citation2017). This has limited the growth of a healthy private sector and instead nurtured the growth of an informal one (Moktar and Wahba Citation2002).
Since 2003, more profound economic reforms were introduced. Trade liberalization has been deepened and a slashing of customs and tariffs took place which nearly terminated any remaining import substitution strategy. The legislative and regulatory framework was modified through, for instance, the enactment of new tax law (91/2005), a new competition law (3/2005), facilitating and streamlining investment registration procedures and customs clearance regulation (cf. El-Haddad Citation2009, Citation2012, Citation2020b) and the unified labour law of 2005, which did have a positive impact on the transition into formal private employment (Wahba and Assaad Citation2017). Selwaness and Zaki (Citation2015) provide the support that the flexibility introduced in the new labour law combined with cuts in tariffs reduce informality in Egypt. Indeed, all of these changes in principle should encourage tangible growth of the formal private sector. However, policy capture and corruption have favoured a handful of businessmen in many sectors of the economy, more so in services than in industry (El-Haddad Citation2020a), thus creating barriers to entry that thwarted the majority of the reform efforts and further stifled the growth of a vibrant private sector. As a result, the unregulated informal sector has remarkably expanded and absorbed the majority of the growing labour force (see also Elbadawi and Loayza Citation2008).
In 2008 the economy was hit by the financial crisis. Despite the relatively limited effects of the crisis on Egypt’s weakly integrated economy, some sectors especially in manufacturing laid-off labour in the private sector, most notably the export-oriented textiles and clothing industry (El-Haddad Citation2012). These cuts in private jobs have further expanded the size of the informal sector especially as first job destination, i.e. from new entry. The sector has also taken the place formerly filled by the public sector, whose hiring has been frozen since 2003 (Assaad and Kraft Citation2013). The upheavals of 2011 reinforced this trend with increasing numbers of workers forced to migrate from the private sector to informality (Elsayed and Wahba Citation2019).
Between periods of time, there were transitions between sectors. In Egypt, the net effect of these transitions is the persistent growth of informality with time. Between 1998 and 2006 there has been some limited transition of the informal private sector to formal private sector jobs (15.5% from informal workers and about 6% from irregular informal jobs) (Assaad and Kraft Citation2013). These types of transitions have declined between 2006 and 2012, in specific transitions from informal to formal have declined by about 4% during that period and by 1.5% with respect to transitions from the irregular informal sectors.
Wahba (Citation2009) shows that this limited mobility is highly segmented along education and gender in Egypt: informal employment is a stepping stone for the highly educated males into formality, but is a dead-end for the uneducated and for females. For the later period preceding the 2011 upheavals, the situation has indeed worsened with much limited mobility, where the highly educated are more likely to be pushed to and remain in informality while the low-educated are more likely to become unemployed and lose their formal contracts (Elsayed and Wahba Citation2019). In 2012 informal male wage work has constituted about 60% of overall wage employment in Egypt.
There’s an ongoing debate that was highlighted in the introduction as to whether the informal sector in developing countries is segmented or competitive. Competitive implies that it is a result of competitive market forces. Roy (Citation1951), Rosen (Citation1986), Tokman (Citation1982) and later Maloney (Citation1999), (Maloney Citation2004) argue that workers potentially self-select into the sector they are most productive in, that the informal sector may be a desirable alternative to formal employment for the flexibility it allows in terms of working hours, location and tax savings. Thus, participants are happy to receive lower wages in contrast to their formal counterparts as a compensating differential to these advantages over the formal sector. La Porta and Shleifer (Citation2014); Fields (Citation1975) and Dickens and Lang (Citation1985) adopt the traditional dualistic view of the economy where workers participate in informal work to escape unemployment as they are rationed out of formality and that the economy is segmented along formal-informal lines due to excessive barriers to entry to the formal sector. A growing literature adopt the middle ground, that is: the informal sector is heterogenous, for some it is a last resort -mostly the lower tier – and for others, in the upper tier, it is a choice (cf Fields Citation1990; Cunningham and Maloney Citation2001 for Mexico, Günther and Launov Citation2012 for the case of Cote d’Ivoire).
According to the transition trends described above and consistent with Gerxhani’s (Citation2003) analysis in stressing the sector’s survival criterion as marking the level of development of a country, the Egyptian informal sector is a buffer. The sector is related to the needs of its participants to survive, an aspect that was explicitly excluded as a criterion in the definition of the informal sector in the majority of developed countries (see also Castells and Portes Citation1989; ILO Citation1972). Hence, its jobs are unstable, limit human capital accumulation opportunities and thus wage progression, an inertia known as the ‘informality trap’ (Hirschman Citation1958).
Being a survival sector, the informal sector is labour intensive and the productivity of its participants is too low to allow them to thrive in the formal sector (La Porta and Shleifer Citation2014). These characteristics imply that the relation between the sectors is counter-cyclical: contraction of the formal sector expands the informal as an alternative path to earning a living. Tansel and Ozdemir (Citation2019) confirm Fields (Citation1975) and Dickens and Lang (Citation1985) views for the Egyptian case. The Egyptian labour market is segmented along formal-informal lines, workers participate in informal work to escape unemployment as they are rationed out of formality in support of the traditional dualistic view of the economy (ibid.). This is in contrast to, for instance, Maloney’s (Citation1999, Citation2004) view of a competitive labour market where economic agents make a conscious choice to participate in informality based on their rational maximizing behaviour.
III. Some drivers of wage inequality
Inequality has been rising across the world. In 17 out of the 22 OECD countries inequality has steadily risen since the 1980s (OECD Citation2011). There has similarly been a rise in inequality in emerging markets (Tridico Citation2010; Chao, Hazari, and Yu Citation2006; Gourdon Citation2011; Balestra et al. Citation2018; Kijima Citation2006 (India); Han, Liu, and Zhang (Citation2012) (China); Lee and Wie (Citation2015) (Indonesia)). The single chief important driver has been greater inequality in wages and salaries (OECD Citation2011). Egypt has equally witnessed growth in inequality during the 15 years since 1998.Footnote3 During that period, the Gini coefficient for real wages has increased by 21 percentage points to 0.43 in 2012. Equally, the 90/10 ratio has increased by just under 13% to 5.3.
The literature identifies various sources for rising wage inequality. Typical sources include education with higher rewards to higher levels of education (cf. Wahba Citation1996; Lopez-Acevedo Citation2006; OECD Citation2011; Tansel and Bircan Citation2011) and so the smaller the share of individuals with relatively higher levels of education the higher the wage dispersion. In 2012, 20% of all male-waged workers have at least a university education. An equal number are illiterates.Footnote4 (). Median real monthly wages however, amount to LE780 for illiterates and to LE1200 for persons with university education (, see also Said Citation2015). Thus, it is expected that education is potentially an important explanatory variable. But it is important to take the economic sector into account. Under Egypt’s state-led development model, the public sector guarantee system provided an incentive for the more educated to concentrate into that sector (Assaad Citation1997; El Ghamrawy and Amer Citation2011), thus potentially diluting the share effect of education on wages in the private sector. In Egypt, despite an established wage premium for the more educated, educational wage premiums have been falling across all groups over time (Said Citation2002) a trend that persisted into 2012 as our analysis will show later. In line with the role of education in wage inequality is the explanation of the skill-biased technological change. If the latter increases, the demand for the more productive, high-skilled labour then the skill premium is likely to increase, thus creating inequality (cf. Krueger Citation1993; Berman, Bound, and Griliches Citation1994).Footnote5 Education, occupation as well as the sector of activity will, therefore, be used as proxies for skill.
Education is also often cited in the inequality of opportunity literature (Roemer Citation1998).Footnote6 The literature distinguishes between predetermined characteristics of an individual (e.g. race) and individual differences in effort.Footnote7 Recently, Assaad et al. (Citation2018) look favourably at the trends in wage inequality, as these trends are relatively attributable to effort rather than circumstances in the Egyptian case.
More recently a strand of literature explained wage inequality, especially the polarization of wages, with a more nuanced view of skill-biased technological change that puts occupations at the forefront of the inequality debate. The introduction of information technologies has not just depressed the relative demand for less-skilled workers as shown in (Berman, Bound, and Griliches Citation1994), instead, Autor, Katz, and Kearney (Citation2006) and Goos and Manning (Citation2007) among othersFootnote8 argue these have depressed the return to routine tasks which are now replaced by computer technologies, a fact that helps account for the polarization of wages since the 80s in the USA (Firpo, Fortin, and Lemieux Citation2011). Occupations requiring sophisticated analytical skills are not easily substituted by machines. Occupations are thus brought to the fore of the debate because the task content of work (routine nature of the job, cognitive skills required for the job … etc.) are typically measured at the occupational level (ibid.),Footnote9.Footnote10
For Egypt Helmy (Citation2015) shows that skill demand polarization has grown and wage disparity widened in Egypt when demand for middle-skilled workers declined in 2009 compared to 2000. Most of the polarization effect came from product demand shift across activities that increased the demand for low- and high-skilled but not for the medium-skilled labour. She decomposed the change in the shares of high-, middle-, and low-skilled worker occupations in 18 economic activities in the total wage bill across activity, within activity, and private employment components. Her analysis uses thus macro data and decomposes at the mean rather than along the entire distribution as we do here.
A closely related paper to ours is Tansel, Keskin, and Ozdemir (Citation2019). After carrying out a number of econometrical variations to take into account observable and non-observable characteristics, potential selection problems and the possibility of non-linearity of covariate effects they find that the informal sector wage penalty (compared to the formal) is robust, despite smaller the more accurate the technique. They also find that the gap is larger at the top than at the bottom of the conditional wage distribution. In terms of the temporal dimension, informal wage inequality has increased over time but is larger for the better educated and smaller for the more experienced. From their analysis, they were able to support the view of a segmented labour market in Egypt, one that is segmented across formal–informal lines as workers are rationed out of formality. This points to the limitation of the potential selection problem, which gives more power to the decomposition implemented here. We, on the other hand, decompose the change in inequality over the two periods to that attributed to the sector/formality status as well to other individual characteristics of labour market participants. Tansel, Keskin, and Ozdemir (Citation2019) have confirmed an informality wage penalty after controlling for a range of characteristics, here we quantify the contribution of informality to the observed change in wage inequality along the wage distribution. We also decompose this change in inequality into its two parts, the first is the composition effect which is a shared effect, i.e. how did both the net movements of workers between sectors and new worker entry change the distribution of workers between good (higher paying) and bad sectors, and where along their respective wage distributions did the change take place. The second, is an unexplained wage structure effect or a price effect that reflects inherent price-setting dynamics of the different sectors under investigation, be it informal private, formal private, formal public, or informal public. Thus, we also differ in that we additionally take the public sector into account.
IV. Methodology
In this paper we examine the contribution of each informality/sector combination on wages and on changes in wage inequality during two sample periods 1998–2006 and 2006–2012. The paper applies the recentered influence function (RIF) regression proposed by Firpo, Fortin, and Lemieux (Citation2009, Citation2011, Citation2018) to estimate the impact of the explanatory variables at different quantiles on the unconditional (marginal) distribution of log hourly wages. In addition, it utilizes inequality decomposition reweighting approach as developed by (DiNardo, Fortin, and Lemieux Citation1996) and Firpo, Fortin, and Lemieux (Citation2007a) (Firpo, Fortin, and Lemieux Citation2011, Citation2018).
Recentered influence function (RIF) regressionFootnote11
The influence function IF(Y; ν, FY) of a distributional statistic, ν(FY), represents the influence of an individual observation on that distributional statistic.
Let the RIF of the distributional statistic ν(FY) be:
The expectation of the RIF is thus equal to ν(FY). The statistic ν can take the form of quantiles or any inequality measure of interest such as the variance or the Gini coefficient (Essama-Nssah and Lambert Citation2011).Footnote12
The conditional expectation of the RIF (Y; ν, FY) can be modelled as a function of the explanatory variables X,
Using the law of iterated expectations ν(FY) can be expressed in terms of the conditional expectation as follows:
According to corollary 1 in Firpo, Fortin, and Lemieux (Citation2009) the vector of partial effects of small locations shifts in the distribution of a continuous covariate X on ν(FY) unconditional partial effect, will be defined as
Where is the k vector of partial derivatives
.
In the case of quantiles,Footnote13 the RIF can be viewed as an unconditional quantile regression (UCQ) as follows:
where is the marginal density function of Y and I(.) is an indicator function.
The conditional expectation of can be implemented as an ordinary least square, assuming the RIF is linear in X; where the dependent variable is Equationequation (5)
(5)
(5) (Firpo, Fortin, and Lemieux Citation2009).
The RIF-OLS approach estimates the unconditional quantile partial effect (UQPE) or the average marginal effect in case of quantiles as follows:
EquationEquation (6)(6)
(6) provides consistent estimates if Pr [Y > qτ|X = x] is linear in x, and it corresponds to the marginal effect on the unconditional quantile of a small location shift in the distribution of covariates, holding everything else constant.Footnote14
Inequality decomposition
According to Oaxaca (Citation1973) and Blinder (Citation1973), mean-wages equations can be decomposed to attribute differences in mean-wages to (1) the composition effect, and (2) the wage structure effect.
The OB technique is performed only at the mean of the outcome (Jenkins and Van Kerm Citation2008), and it assumes linearity of the conditional expectation in order to provide consistent estimates of the aforementioned effects (Firpo, Fortin, and Lemieux Citation2007a).
Firpo, Fortin, and Lemieux (Citation2007a, henceforth FFL) developed a distributional approach based on generalizing OB decomposition on any distributional measure using the RIF. The approach’s advantage is that it provides a linear approximation of highly non-linear functionals, such as the quantiles or the Gini coefficient (cf. Firpo, Fortin, and Lemieux Citation2007a; Wai Citation2009; Ramadan, Hlasny, and Intini Citation2018).Footnote15
The FFL approachFootnote16
Let (for time t = 1, 0) be the estimated coefficients from a regression of
on the covariates in the wage equations (X). Using the estimated coefficients, the equivalent expression for the OB decomposition for any unconditional quantile is:
Where () represents the wage structure effect and (
) (the estimation of the second term) represents composition effect.
If reweighting is not used, the composition effect can be written using the sampling weights provided in the survey data, for each year t.
Since reweighting does not produce a biased decomposition (ibid.), FFL proposed to use DiNardo, Fortin, and Lemieux (Citation1996) approach in reweighting. Suppose is a quantile of wage distribution Y, the difference between the quantiles of year 1 and 0 can be decomposed as follows:
Where is the counterfactual distributional statistics of log hourly wage for workers in year 1, assuming identical characteristics as of those in year 0. The counterfactual wage can be obtained using DiNardo, Fortin, and Lemieux (Citation1996) reweighting function:
Where is the predicted probability of belonging to period t, for t = 0,1.
is the sample proportions in period t. For the conditional probability
, a logit model is used (cf. Firpo, Fortin, and Lemieux Citation2007a; Chi, Li, and Yu Citation2007; Wai Citation2009). The counterfactual weights can be found by multiplying a reweighing function (Ψ) by the sampling weights (
). The counterfactual coefficients
can then be estimated from a RIF regression. The standard Oaxaca-Blinder decompositions will be applied twice on the estimated recentered influence functions. Once to compare time 0 with the reweighted time 0 similar to time 1 distribution. EquationEquation (8)
(8)
(8) provides the pure composition effect
.
is the specification error.
The second Oaxaca-Blinder decomposition compares time 1 and reweighted time 0. EquationEquation (12)(12)
(12) thus provides the pure wage structure effect
as well as the reweighting error
. This error tends to zero as
(Firpo, Fortin, and Lemieux Citation2011).
V. Data, temporal inequality and transitions (1998–2012)
Data
Data is from the 1998 Egypt Labour Market Survey (ELMS) and the 2006 and 2012 Egypt Labour Market Panel Surveys (ELMPS). They are nationally representative Household Sample Surveys carried out by Egypt’s statistical office (CAPMAS) in 1998 and later by the Economic Research Forum in cooperation with CAPMAS.Footnote17
The data excludes all unreported and unrecorded activities. These include legal, illegal or quasi-legal activity covering black market, grey market operations and any domestic economic activities of military conscriptions. The implication is that wage inequality in informal private jobs will be potentially underestimated.Footnote18 However, this exclusion does relief us from a potential selection problem. Participants in illegal black market activities (e.g. smuggling, drugs, weapons) have likely rationally selected to participate in informality and thus support Maloney’s (Citation1999, Citation2004) view of a competitive labour market.
We limit ourselves to log hourly wagesFootnote19 as opposed to income or total earnings because of their central contribution to overall earnings inequality. Variations in hourly wage rates explain the largest part of the level of gross earnings inequality among all workers in most countries (55–63% on average, OECD Citation2011). This means that the self-employed and employers are excluded and that capital, land and entrepreneurial income are not covered in this analysis. We also limit our sample to male-waged workers in the age group 15–64 because of relatively low female labour market participation. This results in a sample of 3617, 5911 and 8266 for the years 1998, 2006 and 2012, respectively. Here we divide the Egyptian labour market into four distinct segments: the informal private sector, the formal public sector, the formal private and the informal public sectors. The first two absorb the majority of the labour force, nearly 90% of all male workers in 2012.
In the literature most frequently informal jobs are associated with unregistered workers, jobs with no contract, non-payment of taxes, not being subject to labour market regulations (e.g. the minimum wage), protection, unemployment insurance, health and safety regulations and retirement benefits (Tansel, Keskin, and Ozdemir Citation2019), all of which normally move together. A waged worker has worked for monetary or in-kind in compensation for at least 1 hour in the reference week of the survey.Footnote20 Assaad and Kraft (Citation2013) consider a worker to be informal if s/he has neither a contract nor social security insurance. We use a stricter definition for informality to reflect the importance of job security and protection. A worker is considered formal if s/he has both a contract and social insurance. If s/he does not have either or both s/he will be considered informal. Indeed, some who have contracts in the private (public) sector are not covered by social security insurance (about 7% (5%) in 2012).Footnote21
The state of temporal inequality (1998-2012)
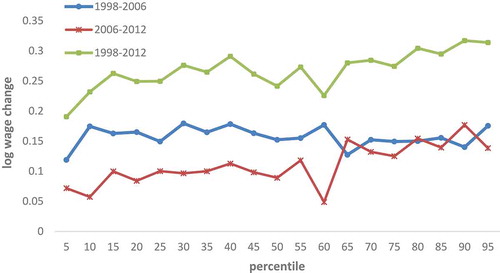
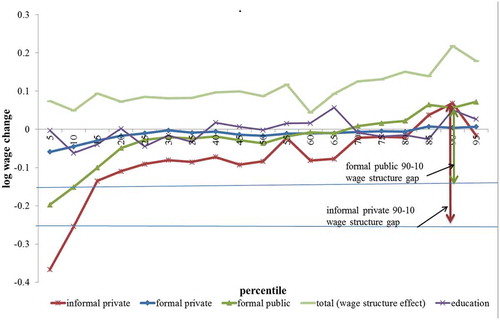
Equality in Egypt has steadily worsened through 1998–2012, where the richer percentiles have persistently enjoyed disproportionately larger positive changes in real hourly wages (). Everybody is better off but growth is pro-rich wage earners, notably for the top half of the distribution (top 50 percentiles). During that period the Gini coefficient has increased by 21 percentage points to 0.43 in 2012. Equally the 90/10 ratio has increased by just under 13% to 5.3. But aggregation blurs the temporal picture. A closer look at our rounds shows that the later period 2006–2012 is responsible for the increase in wage inequality of the entire period. It is during this period that inequality increased steadily along with the wage distribution, unlike in the preceding period 1998–2006 where wage increases have been stable across the distribution and inequality therefore more or less stagnant. For the later period, wage inequality has been rising at a much higher rate at the top of the distribution compared to the bottom. This requires further investigation as to the main contributors of this trend. Is it on account of experience, location, productive sector or profession, or is it a skillFootnote22 biased technical progress? Does the mere relegation to informality induce wage inequality? Is this inequality explained or is it unexplained?
Figure 1. Changes in real hourly wages by percentile, men
VI. RIF results
The covariates included in the RIF regressions () reflect the different potential explanations for the changes in the wage distribution over each sample period. The estimates of the RIFs below give us the partial effects of the explanatory variables on any specific conditional quantile of the dependent variable (log hourly wage). The key set of covariates which we focus on are formality and sector (4 groups). We use other controls such as economic activity, years of experience, education and occupation. Education, economic activity and occupation can be used as a skill proxy. We will refer to the other controls for any particular interesting insights or anomalies. Sample descriptives are in in the Annexe. The base group used in the regressions consists of informal public, rural, illiterate,Footnote23 10–24 years of experience, manager, and agriculture and mining. Results were robust to altering the reference group for all variables.Footnote24
Table 1. RIF regressions
Before getting to the decomposition, we discuss some traits of the estimated RIF-coefficients. The first two points discuss the effect of the different covariates on log hourly wages and the last point presents the change in that effect over time.
First, the effect of many covariates across the different wage quantiles is monotonic. Both being in the formal public sector or in the informal private sector reduce inequality across the distribution (; ). The effect of being in either of these sectors on wages is declining as you move along the wage distribution in any 1 year compared to the reference category of informal public. The opposite is true for university and higher education, working in the services, electricity and finance sector as well as working in urban areas. The effect of those categories across the different wage quantiles is increasing,Footnote25 meaning the wage effect of the highly educated, for example, is higher at the higher wage percentiles (). This is in support of the traditional skills biased technical progress hypothesis ().
Second, the effect of being formally employed in the private sector is non-monotonic, meaning that its impact on wage declines in the lower end of the distribution but increases after approximately the 80th percentile. Therefore, the effect of being formally privately employed follows a U-shaped curve ().
Third, in terms of temporality: for most covariates with the exception of experience and being at the top end of the distribution of being formally employed in the public sectorFootnote26 the effect on the real wage is temporally declining, a reflection of a potential lack of wage indexation or fierce competition in the market place forcing wages down over time or a bit of both. The effect of university and higher education on the real hourly wage compared to illiterates for instance has declined by 77% at the 10th quantile from 0.578 to just 0.134 points from the year 1998 to 2012 ().
Figure 2. Unconditional quantile regression coefficients 1998–2012
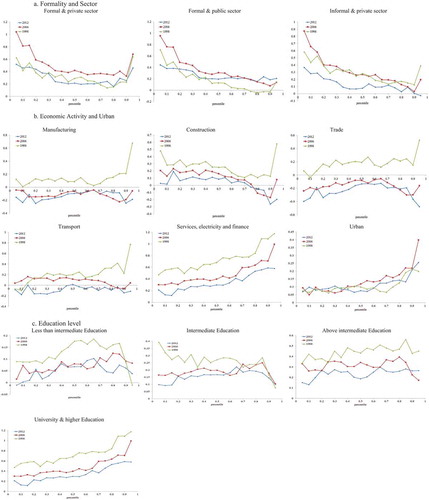
Figure 2. (Countinued)
VII. Decomposition results
Aggregate decomposition
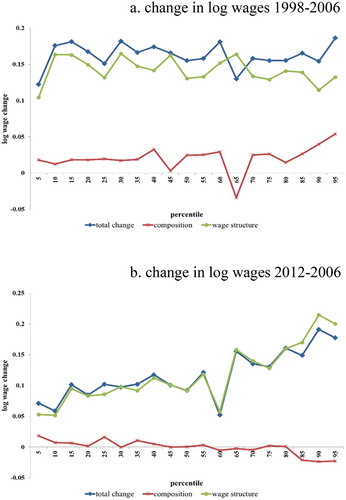
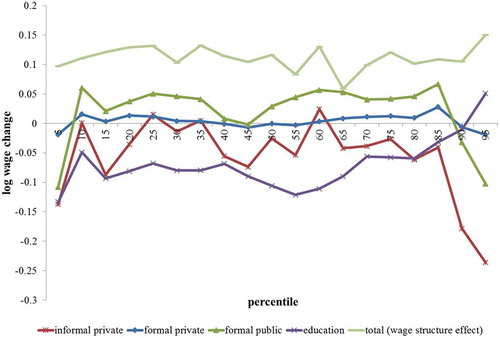
shows the overall change in real log hourly wages between any two periods at each percentile and decomposes this overall change into a composition and a wage structure effect. shows that the wage structure effect has contributed substantially to the stable variations along with the wage distribution during 1998–2006 as well as to the increased wage dispersion that took place for all points of the distribution during 2006–2012 ().Footnote27 The composition effect is nearly negligible for the later period and quite small for 1998–2006. We will focus predominately on the changes in the second more dynamic period which is almost solely responsible for the observed trend throughout the entire extended period 1998–2012.
Figure 3. Decomposition of total change into composition and wage structure effects
The detailed decomposition resultsFootnote28 are presented in . aggregate and detail these results for the standard measures of wage inequality: the top-end 90–50 gap; the low-end 50–10 gap, the 90–10 gap, or the tails gap, the 90/10 ratio and the Gini coefficient which captures wage changes over the entire distribution.
Table 2. Aggregate decomposition results
Table 3. Detailed decomposition results
Inequality increases in all three gaps during 2006–2012 indicating increased inequality along with the entire distribution. But inequality increased mostly in the 90–10 gap (0.132 compared to 0.033 and 0.099 () indicating increased inequality between the very poor and the ultra-rich wage earners between 2006 and 2012.Footnote29 The 90/10 ratio also increased during the same period.Footnote30 Gini as well by 3.1% during the same period confirming the observed trends of rising gaps. In contrast, during 1998–2006 inequality remained stagnant or at best very slightly declined for all three gaps especially the 90–10 gap (−0.0022 largest decline compared to the other gaps).
During 2006–2012 the unexplained wage structure effect accounted for more than the entire growth in all wage gaps ().Footnote31 The composition effect very slightly corrected this result where labour is moved into better paying categories within groups or out of less paying categories or both.
VIII. Detailed decomposition
Wage structure effect
The wage structure effect (, ) for each sector/formality measure interaction can be interpreted as the change over time in the wage impact of a very small change in the measure holding the other covariates constant.Footnote32 Sector and formality status alone are solely responsible for the entire return to characteristics or the unexplained wage structure effect of the three wage gaps for the period 2006–2012.Footnote33 For example, the informal private sector accounts for around 170% (0.226) of the total 90–10 wage gap effect, the formal public accounts for around the same of the gap. The formal private for 26% (, ). All sectors have an inflating effect on inequality over time with the informal private being the largest of the three compared to the reference category followed by the formal public.Footnote34
Figure 4. Detailed decomposition of wage structure effect into formality/sector status (2006–2012)
Formal private sector wage gaps are much smaller and are all insignificant. This is consistent with the results in where the RIF coefficient gap for the informal private sector between the 2 years (2006 red and 2012 blue) is largest for the lower percentiles, declining as we move across the wage distribution.Footnote35 The same is true for the public formal sector. The returns to most other variables have a favourable effect on our inequality measures (negative signs or near zero in ) and are all insignificant.Footnote36 The unexplained wage structure effect, also known as the price effect, provides insights as to differing returns to characteristics. Here referring to a different hourly wage for a worker with exactly the same characteristics except to which sector s/he is relegated to.
The next three sections explore the reasons for the emergence of this large wage structure or price effect for each market segment as well as the reasons for its differing magnitude for each segment. The first two of these sections present the job placements of new labour market entrants and the transition of incumbent-waged workers between the differing labour market segments.Footnote37 This presentation provides evidence as to where along the distribution liberalization induced competitive pressures. The wage-setting dynamics section that follows shows how each market segment responded to these pressures based on its inherent wage-setting behaviour.
New entrants and transitionsFootnote38 between labour market segments
This section illustrates first the huge trend of informalization of the labour market whether through transitions between sectors or through the new entry. Second, although this analysis is limited to waged work this part also shows the deterioration of the nature of these temporal transitions not just to informality but to irregular informality and non-wage jobs as well as to unemployment.
During the first period 1998–2006 there was considerable stability in male labour market states. 81% of those in both public and regular private employment remained in their respective sector (Assaad and Kraft Citation2013).
During the second period however, informality expanded and work statuses deteriorated as irregularity of employment increased. Only 44.8% remained in their regular private sector jobsFootnote39 as 34% moved to the informal sector, 15.5% of those to regular jobs, 9.2% to irregular ones, 8.3% to non-wage non-agricultural and 1% to non-wage agriculture. Eight percent became unemployed (ibid.). There have even been deterioration of male informal jobs where around 40% of informal private regular jobs moved to either irregular jobs (21.4) or to non-wage non-agriculture jobs (14.3) and to non-wage agriculture jobs (4.1). Nine percent moved into unemployment (ibid.). Stability in public sector jobs declined to 77% with just under 8% moving to informality (2.1 to regular informal, 1.1 to irregular informal, 2.4 to non-wage non-agriculture and 2.1 to non-wage agriculture). 11% moved from the public sector job into unemployment. Irregular informal jobs are mainly concentrated in agriculture, construction and transportation and storage.
shows the remarkable shift in the destination of new labour market entrants. As a new entry into public employment steadily declined from the 80s on, tapering by 2003, new entrants shifted predominantly to the informal private sector. As of 2005 (2011), new entrants had over a 50% (60%) chance of having a first job in that sector and an equal chance of just 10% of entering in either of the formal sectors. Pointing thus to the limited absorption capacity of the formal private sector. The informal public sector exists despite being small. Since the mid-90s males have a 5% chance of obtaining a first job there. The informal public is the smallest sector with limited variation. Its workers mostly represent those who do have government contracts but are not yet covered by social security insurance. Indeed, in 2012 around 5% of those who have a government contract don’t have social security insurance.
Figure 5. First job, 3 period moving average 1980–2012, males (15–64 years)

Where along the wage distribution?
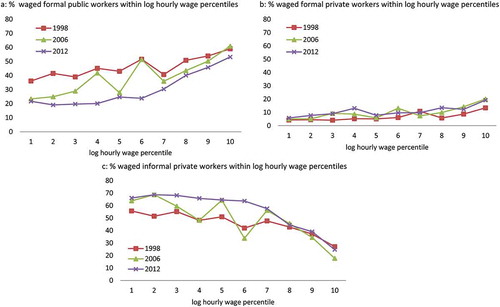
Given these sectoral transitions, it is important to take a closer look to identify where along the distribution did these movements between 1998 and 2012 mostly take place. clearly indicates that by 2012 the net movement of workers resulted in significantly reduced presence of public sector workers in the lower to upper mid of the wage distribution, i.e. up to the 70th percentile (). represents almost the mirror image of 6a, it is clearly evident that net worker transitions to the informal sector are also concentrated in the same percentiles of the sector’s distribution, representing thus a clear movement of the middle classes from the formal public into the informal private sector. Thus, we can expect competitive pressures to form in the lower part of the informal sector’s wage distribution. The movements depicted in ) are consistent with Tansel et al. (Citation2014) that formal to informal transitions during this period are more frequent at the bottom and informal to formal transitions are more frequent at the top of the wage distribution. More workers transitioned into the upper wage quantiles (as of the 80th percentile) of the small formal private sector in 2012 compared to 2006.
Figure 6. Percentage of workers by sector within log hourly wage percentiles
IX. Wage setting dynamics
The informal sector wage setting dynamics
The formal public and the informal private capture together more than 87% (92%) of all waged labour in 2012 (1998) (, ). The informal private sector has a life of its own. Its wage-setting dynamics adheres to free market principles which are inherently inequality-enhancing despite significantly lower wages compared to its formal counterpart.
Table 4. Employment evolution by labour market segment
The freeze in public sector hiring reduced the share of the public sector in male-waged employment between 1998 and 2006 by nearly 7%Footnote40 ( in the Annexe, ). At the beginning of the ERSAP, this didn’t place significant pressure on informal private sector wages, which also explains why the wage structure effect for 1998–2006 is negligible (,Footnote41 ). But another 9% were shed by the formal public sector between 2006 and 2012.Footnote42 New labour market entrants along with the former middle-classes departing the public sector became mainly concentrated in the informal private sector.Footnote43Footnote44Footnote45 This concentration placed as a result significant competitive pressure on the latter, suppressing mid and low-end wages and effecting the increase in inequality represented by the sharp wage structure effect we observe for that sector during the second period (). The increased entrants to the informal sector pushed down its wages particularly for those with limited skillsFootnote46 who are likely occupying the lower and middle-end of the informal private wage distribution. In addition to that, since the minimum wage is not enforced within the informal private, this sector has significantly larger tails gap (90–10) compared to the formal public and even in contrast to the formal private ().
The following details the trends explained just above with the help of earlier results. Earlier it was established that movements between 2006 and 2012 – whether from transitions from both public and private sectors or from new entry – were concentrated into the bottom-end of the informal private sector’s wage distribution. Thus, we can expect competitive pressures to form in that part of the informal sector’s wage distribution.
Indeed indicates first that during 1998–2006 the reductions in the share of the formal public sector were negatively related to wage percentiles. Thus, the larger reductions are at the lower-end followed by the middle percentiles and very limited reductions at the top-end of the wage distribution resulting in an over-representation of the formal public sector at this higher end of the wage distribution () .Footnote47 Second, the reductions at the lower-end of the formal public were nearlyFootnote48 entirely absorbed by the informal private sector. At the 1st to the 6th deciles of the informal private distribution for instance an increase of about 20% took place (), exactly matching the decline of the formal public ().Footnote49 On the other hand, the formal private shared its informal counterpart in hosting the middle-classes rejected by the formal public sector as well as the new entrants to the labour market.Footnote50 However, the formal private absorbed these mainly in the top 20 wage percentiles ().
Formal private sector wage setting dynamics
With respect to the wage structure of the formal private as indicated earlier, it is also inequality enhancing though at a less pronounced rate (, ). All unexplained wage structure gaps despite positive are insignificant for that sector. This is so because its slim entrants were mostly concentrated in the mid to upper distribution segmentsFootnote51 (), thus relatively limiting the increases to their wages, accordingly limiting the wage structure effect for that sector. Additionally, in contrast to the informal private the minimum wage is implemented in this sector thus limiting the dispersion of its distribution. The minimum wage was set before 2010 at LE35 but was raised to LE700 starting 2010.
In principle, liberalization introduces additional competition in the market. In a healthy economy, these changes allow more low-paid people to enter the (private) labour market and the highly skilled to reap more benefits from a greater dynamic economy, thus widening wage disparities (OECD Citation2011). Returns to characteristics do show a slightly increasing trend for education and more so as of the 75th percentile (), though insignificant. For the earlier period, 1998–2006, one can clearly recognize the skill or education premium after the 60th percentile. But then again the value is quite modest ().
Figure 7. Detailed wage structure decomposition 1998–2006
Public sector wage setting dynamics
The explanation for the increasing wage gap between the 2 years in the public formal sector is simple: wage raises are normally in percentage terms. For example, there have been 10% yearly wage increases through 2007–2009, a 20% increase in 2010, and a 15% yearly increase in both 2011 and 2012 (Abdelhamid and El Baradei Citation2010). There has also been other haphazard wage raises in the wake of the upheavals in response to the loud voices of public sector employees. Since a percentage increase produces a larger absolute increase at the higher ends of the distribution,Footnote52 these percentage increases explain the large wage structure effect that causes the wage inequality we see at the lower-end (50–10) and the tails (90–10) gaps.
However, in the public sector these raises had a minimum cap to the increase at 30 Egyptian pounds for the 2010 raise and 36 pounds in the 2011 raise (ibid.) which explains the limited and insignificant low-end gap (90–50). Nevertheless, these caps are still unable to counteract the whole effect, especially the large gaps between the bottom and top of the distribution.
X. Composition or share effect
The very small composition or share effect is very slightly decreasing inequality along with the wage distribution of 2006–2012 () and along the top-end of the 1998–2006 distribution (the 90–50 gap of that period is −0.0064). In contrast, it very slightly increases inequality at the lower end ().
Figure 8. Detailed decomposition of composition effect selected covariates
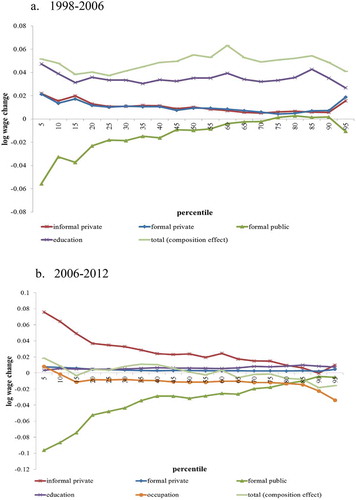
Composition effects are linked to changes in the shares of our covariates over time holding the returns to the covariates constant. As described above there have been reasonably large movements in the labour market triggered by liberalization. With nearly 60% of the male labour force, the informal private sector becomes the largest employer followed by the formal public sector. Again, together they capture more than 87% (92%) of male-waged employment in 2012 (1998).
The effect of the decline of the share of the public sector increases inequality at all ends of the distribution but more at the tails (90–10 gap, ). This is consistent with our earlier results, the RIF coefficients indicated that compared to the reference category the formal public sector reduces inequality along with the distribution at any 1 yearFootnote53 (). Since the lower and middle classes were the ones that predominantly moved out of the sector () they lost this equality enhancing trait. The same is true of the informal private sector whose coefficient is also negatively sloped. But because labour moved to it, particularly to the lower ends of its wage distribution, this movement resulted in a slight improvement of inequality (note the negative slope in ). Accordingly, the composition effect of the informal private goes in the other direction to the composition effect of the public sector. As a result, the informal private and formal public composition effects more or less cancel each other out in nearly all three gaps for both samples (). Since the composition effect of the informal private is weak, it is unable to counteract its strong positive wage structure effect on inequality.Footnote54
XI. Conclusion
Wage changes between 1998–2012 were mainly in the direction of increasing inequality. The richer percentiles have persistently enjoyed disproportionately larger positive changes in real hourly wages. The increase in inequality mostly occurred between 2006 and 2012 which saw the greatest period of increasing wage dispersion. This increasing inequality is primarily driven by the unexplained wage structure effect. The FFL inequality decomposition shows that the formality/sector interaction covariate is first and foremost responsible for the increased inequality trend accruing in this second period.
The unexplained wage structure effect – or the price effect – points to the fact that the direction of intertemporal changes in wages is affected by two broad factors: (1) emerging competitive pressures, and (2) wage-setting dynamics within the different labour market segments. The latter not only determines the nature of temporal wage changes but also determines the degree to which each of these segments is able to respond to competitive pressures. These factors have made the informal private sector the largest contributor to the increase in inequality brought about by the wage structure effect. Employees of the informal private sector are penalized twice over. First, the sector does not apply the minimum wage. And second, new entrants including the low- and middle-classes exiting the public sector placed severe competitive pressure on the sector. Because this sector is the least regulated, these trends allowed the suppression of the growth of mid and low-end informal private sector wages.
Formality has a nuanced effect depending on the sector. The formal public sector is a source of wage inequalities partly on account of its more regulated and political nature.Footnote55 Workers in this sector enjoy largerFootnote56 annual pay raises in percentage terms. Additionally, since liberalization there has been a bias in this sector towards the top segments of its wage distribution as well as a concentration of the formal private’s net entrants in the mid to upper distribution segments. The large size of the public formal sector meant that these features and movements resulted in greater public sector wage dispersion compared to the small formal private sector, thus limiting the strength of the latter’s wage structure effect compared to that of the public formal through 2006–2012.
Can policy play a role? There is mixed evidence on the effectiveness of public works programmes in terms of long-run employment creation and implementation efficiency (cf Beegle, Galasso, and Goldberg Citation2017). However, there is evidence pertaining to wages. Specifically, raising the effective ‘informal sector minimum wage’ can be effected by implementing self-targeted public works programs similar to those supported by the National Rural Employment Guarantee Act (NREGA) in India. This law guaranteed at least 100 days of waged work to every rural household whose adult members volunteer to do unskilled manual work with a guaranteed minimum wage to both men and women.Footnote57 This program had many benefitsFootnote58 but most relevant to this paper is the effect on the informal sector’s minimum wage. Now that this scheme became law the informal private had to compete with this program for low-skill labour thus forcing the unregulated informal private sector to increase its own wage rate (cf. Berg et al. Citation2018; Gaiha Citation2007).
In the longer term, programs like NREGA reduce wage inequality, eliminate part of the instability feature of informal jobs and reduce their wage penalty. They may also lead to the ability of informal labour to accumulate human capital. This in turn will enable wage progression thereby breaking the current low skill-low wage trap inertia or informality trap.
Formalization of the sector to bring it within minimum wage legislation cannot be superimposed. Businesses will only take this step if is persuaded that the benefits outweigh costs. Aleman-Castila (Citation2006) found some supporting evidence in Mexico to the fact that trade liberalization contracts the informal sector. By introducing firm heterogeneity, the most productive firms are able to reap the benefits of trade liberalization through formalizing. Selwaness and Zaki (Citation2015) provide similar evidence for Egypt, showing that the flexibility introduced in the new labour law combined with cuts in tariffs have reduced informality in Egypt. Trade liberalization may thus be an opportunity. La Porta and Shleifer (Citation2014) argue that the informal sector will eventually shrink only through growth and development, so that in time the formal sector will come to dominate the economy. Indeed, in the past a degree of trade liberalization has brought development to countries such as South Korea and Singapore leading to the eventual elimination of informality.
Generally, a minimum wage policy won’t reduce wage inequality as the policy protects the wages of the minority in the formal sector, notably in the public sector. Okamoto (Citation2011) has shown similar predictions for Cambodia and Paraguay, where raising the minimum wage is associated with earnings inequality. Other policies – such as employment guarantee programmes should be explored to directly increase the incomes of the poor and put upward pressure on informal wages. Chances for further research.
Acknowledgments
This research obtained financial support from the Economic Research Forum (ERF). The contents of this paper are the sole responsibility of the authors and do not reflect the position of the ERF. We are thankful to Paul Makdissi for insightful comments to an earlier version of this paper and for continuous support. Our gratitude extends to participants of the Jour Fix research workshop at the Transformation of Economic and Social Systems Programme of the German Development Institute (DIE). Thanks are also due to Marian Adel for superb research assistance and diligence. Our thanks also goes to Howard White for constant support and encouragement and to three anonymous reviewers for constructive comments and insightful suggestions.
Disclosure statement
No potential conflict of interest was reported by the authors.
Statement on data Set Availability
Data used for the paper titled: The contribution of informality to wage inequality in Egypt is openly available in a public repository that does not issue DOIs.
The data that support the findings of this study are openly available in ERF data portal at https://erf.org.eg/erf-data-portal/. To gain access to the data one needs to follow the application process indicated on the website.
Notes
1 This is similar to other developing countries where the informal sector produces about 35% of GDP and employs 70% of the labour force (Loayza Citation2016).
2 See Tansel, Keskin, and Ozdemir (Citation2018) which compares the private to the public sector, it however excludes the informal sector.
3 It is expected that the most recent ELMPS which the authors have no access to reveals a persistence of this trend.
4 Having dropped from over 32% in 1998 ().
5 This channel has been debated, some authors challenge the idea that skill-biased technical change is a major driver of wage inequality (cf. Feenstra and Hanson Citation2001; Singh and Dhumale Citation2004). Some believe education counteracts the skill bias of technical change (cf. Tinbergen Citation1975) whilst others believe it doesn’t (cf. Goldin and Katz Citation2008; Alejo, Gabrielli, and Sosa-Escudero Citation2014). Technological change could also affect inequality through increasing the returns to capital relative to labour. But this research only focuses on returns to labour so this strand of literature has no direct bearing to our analysis.
6 It is further developed by Roemer (Citation2006), Bourguignon, Ferreira, and Menéndez (Citation2003; Citation2007).
7 Children from remote or rural areas or those from disadvantaged backgrounds may be deprived of an equal opportunity in access to education; a strong determinant of improved employment prospects and higher lifetime earnings (cf. Checchi and Peragine Citation2005; Cogneau and Mesplé-Somps Citation2008; Lefranc, Pistolesi, and Trannoy Citation2008).
8 See also (Berman, Bound, and Machin Citation1998; Dustmann, Ludsteck, and Schönberg Citation2009; Goldin and Katz Citation2008; Goos, Manning, and Salomons Citation2011; Hur, Seo, and Lee Citation2005; Jung and Mercenier Citation2010; Michaels, Natraj, and Van Reenen Citation2010).
9 Likewise, occupations that require the physical presence of a worker such as plumbing cannot be automated.
10 Offshoring also plays a role and is closely linked to occupations. Offshoring allows countries to hire (offshore) computer programmers (middle-skilled) in India to update and maintain software products. This reduces the relative demand for domestic computer programmers, thus depressing their wages. But offshore work increases the productivity of software engineers and developers at home and contributes to wage increases at the other end of the skill spectrum. Thus offshorability of occupations can be viewed as a main contributor to wage polarization and changes in the wage structure (Blinder Citation2007; Jensen and Kletzer Citation2006 see also Autor, Katz, and Kearney Citation2006; Acemoglu and Autor Citation2011). More recently, Firpo, Fortin, and Lemieux (Citation2018) have systematically analysed how the polarization of US male wages between the 80s and mid 2010s was affected by education, occupations, industry changes and de-unionization.
11 This part draws heavily on Firpo, Fortin, and Lemieux (Citation2009).
12 See Firpo, Fortin, and Lemieux (Citation2007b) for such regressions on the variance and Gini.
13 For the derivation of the RIF for the Gini coefficient and interquartile ratio see Annexe a and b.
14 The paper applies the STATA commands rifreg-ado proposed by Firpo, Lemieux, and Fortin (Citation2010), and rifhdreg_ado proposed by Rios-Avila (Citation2019).
15 Rothe (Citation2015) pointed that RIF-regressions maybe poorly approximating the impact of changes in the distribution of covariates on some non-linear functionals.
16 For details see: Chi, Li, and Yu (Citation2007), Wai (Citation2009), Firpo, Fortin, and Lemieux (Citation2011) and Kim (Citation2014).
17 All three questionnaires have three major modules: (i) a household questionnaire administered to the household head or spouse; (ii) an individual questionnaire administered to every individual in the household age six and above; and (iii) a household enterprise and income module (Assaad Citation2009).
18 Alvaredo and Piketty (Citation2014) show the extent to which data limitations in the Middle East underestimate top incomes and income inequality where they use Egypt as a case study.
19 Of the main job.
20 Real log hourly wages are computed using the Egyptian national CPI with 2012 as base year.
21 Further, some businessmen in the private sector force employees to sign Form 6 in advance of issuing their contract (Youm7 Citation2016). This form should be presented by the employer to the social security insurance agency as proof of the employees’ termination of his/her contract, in effect a resignation letter. There is no question in the survey whether a worker was forced to sign this form prior to signing her contract. With the available data, an important aspect of job security is still missing. This insecurity of the formal sector represents another barrier to formal employment, thus further fuelling the growth in informal employment.
22 Proxied here partially by education, partly by occupation and partially by activity.
23 or at best read and write.
24 Regressions available upon request.
25 That is the coefficient increases as you move from Q10 to Q90 in any one year compared to the reference category.
26 Which is discussed later at great length.
27 As the curve is positively sloped for all quantiles.
28 and variants.
29 Note that wage data are censored at the top end with the implication that tail inequality is underestimated here.
30 Though it is insignificant.
31 The reweighting error is negligible and insignificant for all indicators.
32 Equivalent to partial effects.
33 It is unexplained because it reflects the changes in the return to the same characteristics.
34 Note the bigger 90–10 wage structure gap of informal private compared to formal public ().
35 Note that the coefficients are declining between 2006 and 2012 throughout the entire distribution. That decline between the coefficients is largest at the lower end of the wage distribution.
36 With the exception of region where the urban sector causes a significant decrease in the Gini.
37 That is between the four distinct sector/formality combinations.
38 The transition part draws heavily on panel analysis in Assaad and Kraft (Citation2013).
39 Half that of the previous period.
40 from under half (46%) to ~39%.
41 Wage structure effect is −0.055, 0.034 and −0.021 for the tails, lower-end and top-end gaps respectively. The 90/10 explained ratio is even negative.
42 From 39% to 30%.
43 As discussed in the transition section above.
44 the formal private sector was only able to absorb 4% of those and the majority of created and new employment landed in the informal private sector.
45 Will be discussed further below.
46 Skills are partially and potentially controlled for by the education and occupation variables. However, these are very inaccurate proxies for skills. Proxies as those used in Firpo, Fortin, and Lemieux (Citation2011) are unavailable for Egypt.
47 Reductions were about 20% from the 1st to the 6th deciles (from 40–20%) to just about 8% for the 10th decile.
48 Note however that these movements reflect the net outcome from transitions from other sectors plus new entry.
49 To be specific cf. at the 2nd decile, the percentage of waged informal private workers increased from about 50 to 70%.
50 With the larger load of course falling onto the informal private.
51 Compared to 1998 starting from the 7th decile ().
52 since the base wage is already larger than at the bottom of the distribution.
53 as it was negatively sloped.
54 Note that in the Oaxaca-Blinder decomposition, the effects on the 90–50 gap can be obtained directly by multiplying the 8.9% decline in the formal public sector share between 2006 and 2012 (Annexe ) by the RIF regression estimates of the formal public sector effect for 2006 (), which is the value at the 50th percentile in for the formal public sector for example.
55 All Egyptian governments have feared the social unrest of the public sector. In addition, because unlike the private sector it is entirely under the purview of government it has always been favoured in terms of wage raises.
56 We have not found concrete information on actual pay raise systems in the private sector. This statement is induced by the trends we observe in our data.
57 If work was not provided within 15 days of application, applicants are entitled to unemployment allowance. Thus employment under the scheme is a legal entitlement.
58 It enhanced livelihood security in rural areas, built rural infrastructure (e.g. roads, canals, ponds and wells), protected the environment, reduced rural-urban migration (by creating rural employment), empowered women and closed the gender pay gap in rural areas (Dreze and Khera Citation2009).
References
- Abdelhamid, D., and L. El Baradei. 2010. “Reforming the Pay System for Government Employees in Egypt.” International Public Management Review 11 (3): 59–87.
- Acemoglu, D., and D. Autor. 2011. “Skills, Tasks and Technologies: Implications for Employment and Earnings.” In Handbook of Labor Economics, edited by O. Ashenfelter and D. Card, Vol. 4, 1043–1171. Amsterdam: Elsevier.
- Alejo, J., M. F. Gabrielli, and W. Sosa-Escudero. 2014. “The Distributive Effects of Education: An Unconditional Quantile Regression Approach.” Revista De Analisis Economico - Economic Analysis Review 29 (1): 53–76.
- Alvaredo, F., and T. Piketty 2014. “Measuring Top Incomes and Inequality in the Middle East: Data Limitations and Illustration with the Case of Egypt.” ERF Working Paper #832. Egypt: Economic Research Forum.
- Assaad, R. 1997. “The Effects of Public Sector Hiring and Compensation Policies on the Egyptian Labor Market.” The World Bank Economic Review 11 (1): 85–118. doi:10.1093/wber/11.1.85.
- Assaad, R. 2009. The Egyptian Labor Market Revisited. Cairo: American University in Cairo Press.
- Assaad, R., C. Krafft, J. Roemer, and D. Salehi-Isfahani. 2018. “Inequality of Opportunity in Wages and Consumption in Egypt.” Review of Income and Wealth 64 (S1): S26–S54. doi:10.1111/roiw.12289.
- Assaad, R., and C. Kraft 2013. “The Structure and Evolution of Employment in Egypt: 1998-2012.” ERF Working Paper #805. Cairo, Egypt: Economic Research Forum (ERF).
- Autor, D. H., L. F. Katz, and M. S. Kearney. 2006. “The Polarization of the U.S. Labor Market.” American Economic Review 96 (2): 189–194. doi:10.1257/000282806777212620.
- Balestra, C., A. Llena-Nozal, F. Murtin, E. Tosetto, and B. Arnoud 2018. “Inequalities in Emerging Economies: Informing the Policy Dialogue on Inclusive Growth.” OECD Statistics Working Papers # 2018/13. Paris: OECD Publishing.
- Beegle, K., E. Galasso, and J. Goldberg. 2017. “Direct and Indirect Effects of Malawi’s Public Works Program on Food Security.” Journal of Development Economics 128 (C): 1–23. doi:10.1016/j.jdeveco.2017.04.004.
- Benjamin Aleman-Castilla. 2006. “The Effect of Trade Liberalization on Informality and Wages: Evidence from Mexico.” CEP Discussion Papers dp0763. Centre for Economic Performance, LSE.
- Berg, E., S. Bhattacharyya, D. Rajasekhar, and R. Manjula. 2018. “Can Public Works Increase Equilibrium Wages? Evidence from India’s National Rural Employment Guarantee.” World Development 103: 239–54, 301–14. doi:10.1016/j.worlddev.2017.10.027.
- Berman, E., J. Bound, and S. Machin. 1998. “Implications of Skill-biased Technological Change: International Evidence.” Quarterly Journal of Economics 113 (4): 1245–1279. doi:10.1162/003355398555892.
- Berman, E., J. Bound, and Z. Griliches. 1994. “Changes in the Demand for Skilled Labor within U.S. Manufacturing: Evidence from the Annual Survey of Manufactures.” Quarterly Journal of Economics 109 (2): 367–397. doi:10.2307/2118467.
- Binelli, C. 2016. “Wage Inequality and Informality: Evidence from Mexico.” IZA Journal of Labor & Development 5 (1): 1–18. doi:10.1186/s40175-016-0050-1.
- Blinder, A. S. 1973. “Wage Discrimination: Reduced Form and Structural Estimates.” Journal of Human Resources 8 (4): 436–455. doi:10.2307/144855.
- Blinder, A. S. (2007). “How Many U.S. Jobs Might Be Offshorable?” CEPS Working Paper #142. Princeton, NJ: Princeton University Center for Economic Policy Studies.
- Bourguignon, F., F. H. G. Ferreira, and M. Menéndez 2003. “Inequality of Outcomes and Inequality of Opportunities in Brazil.” World Bank Policy Research Working Paper #3174. Washington DC: World Bank.
- Bourguignon, F., F. H. G. Ferreira, and M. Menéndez. 2007. “Inequality of Opportunity in Brazil.” Review of Income and Wealth 53 (4): 585–618. doi:10.1111/j.1475-4991.2007.00247.x.
- Castells, M., and A. Portes. 1989. “World Underneath: The Origins, Dynamics, and Effects of the Informal Economy.” In The Informal Economy: Studies in Advanced and Less Developed Countries, edited by A. Portes, M. Castells, and L. A. Benton, 11–41. Baltimore and London: Johns Hopkins University Press.
- Chao, C. C., B. Hazari, and E. H. S. Yu. 2006. “Rising Wage Inequality in Developing Economies: Privatization and Competition.” Journal of International Trade & Economic Development 15 (3): 375–385. doi:10.1080/09638190600871719.
- Checchi, D., and V. Peragine 2005. “Regional Disparities and Inequality of Opportunity: The Case of Italy.” IZA Discussion Paper # 1874/2005. Bonn, Germany: Institute for the Study of Labor (IZA).
- Chi, W., B. Li, and Q. M. Yu 2007. “Decomposition of Changes in Earnings Inequality in China: A Distributional Approach.” MPRA Paper # 3807. Munich, Germany: University Library of Munich.
- Chung, C., and P. Van Kerm. 2018. “Foreign Workers and the Wage Distribution: What Does the Influence Function Reveal.” Econometrics 6 (2): 28.
- Cogneau, D., and S. Mesplé-Somps. 2008. “Inequality of Opportunity for Income in Five Countries of Africa.” In Inequality and Opportunity: Papers from the Second Ecineq Society Meeting, edited by J. Bishop and B. Zheng, Vol. 16, 99–128. Bingley (Reino Unido): Emerald Group Publishing Limited.
- Cunningham, W., and W. F. Maloney. 2001. “Heterogeneity among Mexico’s Microenterprises: An Application of Factor and Cluster Analysis.” Economic Development and Cultural Change 50 (1): 131–156. doi:10.1086/340012.
- Dickens, W., and K. Lang. 1985. “A Test of the Dual Labor Market Theory.” American Economic Review 75 (4): 792–805.
- DiNardo, J., N. M. Fortin, and T. Lemieux. 1996. “Labor Market Institutions and the Distribution of Wages, 1973–1992: A Semiparametric Approach.” Econometrica 64 (5): 1001–1044. doi:10.2307/2171954.
- Drèze, J., and R. Khera. (2009). “The battle for employment guarantee.” Frontline 26 (1).
- Dustmann, C., J. Ludsteck, and U. Schönberg. 2009. “Revisiting the German Wage Structure.” The Quarterly Journal of Economics 124 (2): 843–881. doi:10.1162/qjec.2009.124.2.843.
- El Ghamrawy, T., and Z. Amer 2011. “The Public Wage Premium in Egypt: Mirage or Reality?” ECES Working Paper # 164. Cairo: Egyptian Centre for Economic Studies.
- Elbadawi, I., and N. Loayza. 2008. “Informality, Employment and Economic Development in the Arab World.” Journal of Development and Economic Policies 10 (2): 27–75.
- El-Haddad, A. (2009). “Labor Market Gender Discrimination under Structural Adjustment: The Case of Egypt.” Working Paper Series #003. Cairo: American University in Cairo, Social Research Center.
- El-Haddad, A. 2012. “Effects of the Global Crisis on the Egyptian Textiles and Clothing Sector: A Blessing in Disguise?” ISRN Economics.
- El-Haddad, A. 2015a. “Breaking the Shackles: The Structural Challenge of Growth and Transformation for Egypt’s Industrial Sector.” In Structural Transformation and Industrial Policy: A Comparative Analysis of Egypt, Morocco, Tunisia and Turkey and Case Studies, edited by I. Atiyas, A. Galal, and H. Selim, 69–109. Luxembourg: European Investment Bank.
- El-Haddad, A. 2015b. “The Causal Chain of Market Based Reform in Egyptian Voice Telecommunication.” Journal of Development Effectiveness 7 (4): 499–518.
- El-Haddad, A. 2017. “Welfare Gains from Utility Reforms in Egyptian Telecommunications.” Utilities Policy 45: 1–26. doi:10.1016/j.jup.2016.10.003.
- El-Haddad, A. 2020a. “Redefining the Social Contract in the Wake of the Arab Spring: The Experiences of Egypt, Morocco and Tunisia.” World Development 127: 104774. doi:10.1016/j.worlddev.2019.104774.
- El-Haddad, A. forthcoming 2020b. “Picking Winners: Identifying Leading Sectors for Egypt and Tunisia Using the Product Space Methodology.” Review of Middle East Economics and Finance (RMEEF).
- ELMPS (Egypt Labor Market Survey). 1998. “Version 1.0 Of Licensed Data Files.” Cairo, Egypt: Economic Research Forum (ERF). www.erfdataportal.com
- ELMPS (Egypt Labor Market Survey). 2006. “Version 4.1 Of Licensed Data Files.” Cairo, Egypt: Economic Research Forum (ERF). www.erfdataportal.com
- ELMPS (Egypt Labor Market Survey). 2012. “Version 2.1 Of Licensed Data Files.” Cairo, Egypt: Economic Research Forum (ERF). www.erfdataportal.com
- Elsayed, A., and J. Wahba. 2019. “Political Change and Informality: Evidence from the Arab Spring.” Economics of Transition and Institutional Change 27 (1): 31–66. doi:10.1111/ecot.12198.
- Essama-Nssah, B., and P. J. Lambert 2011. “Influence Functions for Distributional Statistics.” Working Paper #236. Rome: Society for the Study of Economic Inequality (ECINEQ). https://pdfs.semanticscholar.org/60b6/d108dd1f76d4d3ba429f9e96df5a196e28b1.pdf?_ga=2.219278233.188791671.1575726046-1119865963.1565005918
- Feenstra R., and G. Hanson. 2001. “Global Production Sharing and Rising Inequality: A Survey of Trade and Wages.” NBER Working Paper No. 8372.
- Fields, G. 1975. “Rural-urban Migration, Urban Unemployment and Underemployment and Job Search Activity in LDCs.” Journal of Development Economics 2 (2): 165–187. doi:10.1016/0304-3878(75)90014-0.
- Fields, G. 1990. “Labour Market Modelling and the Urban Informal Sector: Theory and Evidence.” In The Informal Sector Revisited, edited by D. Turnham, B. Salomé, and A. Schwarz, 49–69. Paris: Organisation for Economic Co-operation and Development.
- Firpo, S., N. M. Fortin, and T. Lemieux 2007a. “Decomposing Wage Distributions Using Recentered Influence Function Regressions.” University of British Columbia, unpublished manuscript.
- Firpo, S., N. M. Fortin, and T. Lemieux 2007b. “Unconditional Quantile Regressions.” NBER Technical Working Paper # 339. Cambridge, Massachusetts: National Bureau of Economic Research.
- Firpo, S., N. M. Fortin, and T. Lemieux. 2009. “Unconditional Quantile Regressions.” Econometrica 77 (3): 953–973.
- Firpo, S., N. M. Fortin, and T. Lemieux 2011. “Occupational Tasks and Changes in the Wage Structure.” IZA Discussion Paper # 5542. Bonn, Germany: Institute for the Study of Labor (IZA).
- Firpo, S., N. M. Fortin, and T. Lemieux. 2018. “Decomposing Wage Distributions Using Recentered Influence Function Regressions.” Econometrics 6 (2): 1–40. doi:10.3390/econometrics6020028.
- Firpo, S., T. Lemieux, and N. Fortin 2010. “Decomposition Methods in Economics.” NBER Working Paper #16045. Cambridge, Massachusetts: National Bureau of Economic Research.
- Gaiha, R. 2007. “Do Rural Public Works Influence Agricultural Wages? The Case of the Employment Guarantee Scheme in India.” Oxford Development Studies 25 (3): 301–314. doi:10.1080/13600819708424137.
- Gerxhani, K. 2003. “The Informal Sector in Developed and Less-developed Countries: A Literature Survey.” Public Choice 114 (3/4): 295–318. doi:10.1023/A:1022624619203.
- Goldin, C., and L. F. Katz. 2008. The Race between Education and Technology. Cambridge: Harvard University Press.
- Goos, M., and A. Manning. 2007. “Lousy and Lovely Jobs: The Rising Polarization of Work in Britain.” Review of Economics and Statistics 89 (1): 118–133. doi:10.1162/rest.89.1.118.
- Goos, M., A. Manning, and A. Salomons 2011. “Explaining Job Polarization: The Roles of Technology, Offshoring and Institutions.” Discussions Paper Series (DPS) 11.34. Leuven, Belgium: Department of Economics, University of Leuven.
- Gourdon, J. 2011. “Wage Inequality in Developing Countries: South-South Trade Matters.” International Review of Economics 58 (4): 359–383. doi:10.1007/s12232-011-0134-9.
- Günther, I., and A. Launov. 2012. “Informal Employment in Developing Countries.” Journal of Development Economics 97 (1): 88–98. doi:10.1016/j.jdeveco.2011.01.001.
- Han, J., R. Liu, and J. Zhang. 2012. “Globalization and Wage Inequality: Evidence from Urban China.” Journal of International Economics 87 (2): 288–297. doi:10.1016/j.jinteco.2011.12.006.
- Helmy, O. 2015. “Skill Demand Polarization in Egypt.” Middle East Development Journal 7 (1): 26–48. doi:10.1080/17938120.2015.1019291.
- Hirschman, A. O. 1958. The Strategy of Economic Development. New Haven: Yale University Press.
- Hur, J., H. Seo, and Y. Lee. 2005. “Information and Communication Technology Diffusion and Skill Upgrading in Korean Industries.” Economics of Innovation and New Technology 14 (7): 553–571. doi:10.1080/1043859042000304061.
- International Labor Office. 1972. Employment, Income and Equality: A Strategy for Increasing Productivity in Kenya. Geneva: ILO.
- Jenkins, S. P., and P. Van Kerm. 2008. “The Measurement of Economic Inequality.” In The Oxford Handbook of Economic Inequality, edited by W. Salverda, B. Nolan, and T. M. Smeeding, 40–70. Oxford: Oxford University Press.
- Jensen, J. B., and L. G. Kletzer. 2006. “Tradable Services: Understanding the Scope and Impact of Services Offshoring.” In Brookings Trade Forum 2005, Offshoring White-collar Work, edited by S. M. Collins and L. Brainard, 75–134. Washington, D.C.: Brookings Institution.
- Jung, J., and J. Mercenier 2010. “Routinization-biased Technical Change, Globalization and Labor Market Polarization: Does Theory Fit the Facts?” Working Papers #13/2010. Verona, Italy: University of Verona, Department of Economics.
- Kijima, Y. 2006. “Why Did Wage Inequality Increase? Evidence from Urban India 1983–99.” Journal of Development Economics 81 (1): 97–117. doi:10.1016/j.jdeveco.2005.04.008.
- Kim, H. 2014. “Temporary Employment and Earnings Inequality in South Korea.” Unpublished mimeo.
- Krueger, A. B. 1993. “How Computers Have Changed the Wage Structure: Evidence from Microdata, 1984-1989.” Quarterly Journal of Economics 108 (1): 33–60. doi:10.2307/2118494.
- La Porta, R., and A. Shleifer 2014. “Informality and Development.” NBER Working Paper #20205. Cambridge, MA: National Bureau of Economic Research (NBER).
- Lee, J. W., and D. Wie. 2015. “Technological Change, Skill Demand, and Wage Inequality: Evidence from Indonesia.” World Development 67: 238–250. doi:10.1016/j.worlddev.2014.10.020.
- Lefranc, A., N. Pistolesi, and A. Trannoy. 2008. “Inequality of Opportunities Vs. Inequality of Outcomes: Are Western Societies All Alike?” Review of Income and Wealth 54 (4): 513–546. doi:10.1111/j.1475-4991.2008.00289.x.
- Loayza, N. V. 2016. “Informality in the Process of Development and Growth.” Policy Research Working Paper #7858. Washington, D.C.: World Bank.
- Lopez-Acevedo, G. 2006. “Mexico: Two Decades of the Evolution of Education and Inequality.” World Bank Policy Research Working Paper # 3919. Washington, DC: World Bank.
- Maloney, W. F. 1999. “Does Informality Imply Segmentation in Urban Labor Markets? Evidence from Sectoral Transitions in Mexico.” World Bank Economic Review 13 (2): pages 275–302. doi:10.1093/wber/13.2.275.
- Maloney, W. F. 2004. “Informality Revisited.” World Development 32 (7): 1159–1178. doi:10.1016/j.worlddev.2004.01.008.
- Michaels, G., A. Natraj, and J. Van Reenen 2010. “Has ICT Polarized Skill Demand? Evidence from Eleven Countries over 25 Years.” CEP Discussion Paper #987. London, UK: Centre for Economic Performance, London School of Economics and Political Science.
- Moktar, M., and J. Wahba. 2002. “Informalisation of Labor in Egypt.” In The Labor Market in a Reforming Economy: Egypt in the 1990s, edited by R. Assaad, 131–157. Cairo: American University in Cairo Press.
- Oaxaca, R. L. 1973. “Male-female Wage Differentials in Urban Labor Markets.” International Economic Review 14 (3): 693–709. doi:10.2307/2525981.
- Okamoto, M. 2011. Source Decomposition of changes in income inequality: the integral-based approach and its approximation by the chained Shapley-value approach. The Journal of Economic Inequality 9: 145–181.
- Organisation for Economic Co-Operation and Development (OECD). 2011. Divided We Stand: Why Inequality Keeps Rising. Paris: Organisation for Economic Co-Operation and Development.
- Wahba, J., and R. Assaad. 2017. “Flexible Labour Regulations and Informality in Egypt.” Review of Development Economics 21 (4): 962–984.
- Ramadan, R., V. Hlasny, and V. Intini. 2018. “Inter-group Expenditure Gaps in the Arab Region and Their Determinants: Application to Egypt, Jordan, Palestines, and Tunisia.” Review of Income and Wealth 64 (S1): S145–S188. doi:10.1111/roiw.12396.
- Rios-Avila, F. 2019. “Recentered Influence Functions in Stata: Methods for Analyzing the Determinants of Poverty and Inequality.” Working paper #927. New York: Levy Economic Institute of Bard College. https://ideas.repec.org/p/boc/scon19/22.html
- Roemer, J. 1998. Equality of Opportunity. Cambridge, MA: Harvard University Press.
- Roemer, J. 2006. “Economic Development as Opportunity Equalization.” Cowles Foundation Discussion Paper # 1583. New Haven: Yale University.
- Rosen, S. 1986. “The Theory of Equalizing Differences.” In Handbook of Labor Economics, edited by O. Ashenfelter and R. Layard, Vol. 1, 641–692. Amsterdam: Elsevier.
- Rothe, C. 2015. “Decomposing the Composition Effect.” Journal of Business Economics and Statistics 33 (3): 323–337. doi:10.1080/07350015.2014.948959.
- Roy, A. D. 1951. “Some Thoughts on the Distribution of Earnings.” Oxford Economic Papers 3 (2): 135–146. doi:10.1093/oxfordjournals.oep.a041827.
- Said, M. 2002. “A Decade of Rising Wage Inequality? Gender, Occupation, and Public-private Issues in the Egyptian Wage Structure.” In The Egyptian Labor Market in an Era of Reform, edited by R. Assaad, 65–95. Cairo: American University in Cairo Press.
- Said, M. 2015. “Wages and Inequality in the Egyptian Labor Market in an Era of Financial Crisis and Revolution.” ERF Working Paper # 912. Cairo, Egypt: Economic Research Forum (ERF).
- Selwaness, I., and C. Zaki. 2015. “Assessing the Impact of Trade Reforms on Informal Employment in Egypt.” The Journal of North African Studies 20 (3): 391–414. doi:10.1080/13629387.2014.997717.
- Singh, A., and R. Dhumale. 2004. “Globalization, Technology, and Income Inequality: A Critical Analysis.” In Inequality, Growth, and Poverty in an Era of Liberalization and Globalization, edited by G. A. Cornia, 149–152. Oxford: Oxford University Press.
- Tansel, A., and F. Bircan 2011. “Wage Inequality and Returns to Education in Turkey: A Quantile Regression Analysis.” ERF Working Paper #1102. Cairo, Egypt: Economic Research Forum (ERF).
- Tansel, A., H. I. Keskin, and Z. A. Ozdemir 2018. “Public versus Private Sector Wage Gap in Egypt: Evidence from Quantile Regression on Panel Data.” IZA Discussion Paper # 11895. Bonn, Germany: Institute for the Study of Labor (IZA).
- Tansel, A., H. I. Keskin, and Z. A. Ozdemir. 2019. “Is There an Informal Employment Wage Penalty in Egypt? Evidence from Quantile Regression on Panel Data.” Empirical Economics. published online. doi:10.1007/s00181-019-01651-2.
- Tansel. A., and Z. Ozdemir. 2014. “Determinant of Transitions Across Formal/Informal Sectors in Egypt.” ERF Working Paper No.899.
- Tansel, A., and Z. A. Ozdemir. 2019. “Transitions across Labor Market States Including Formal/informal Division in Egypt.” Review of Development Economics 23 (4): 1674–1695. doi:10.1111/rode.12620.
- Tinbergen, J. 1975. Income distribution: Analysis and policies. Amsterdam: North-Holland Publishing Co.
- Tokman, V. 1982. “Unequal Development and the Absorption of Labour: Latin America 1950–1980.” CEPAL Review 1982 (17): 121–133. doi:10.18356/6ed029d6-en.
- Tridico, P. 2010. “Growth, Inequality and Poverty in Emerging and Transition Economies.” Transition Studies Review 16 (4): 979–1001. doi:10.1007/s11300-009-0116-8.
- Wahba, J. 1996. “Earnings and Regional Inequality in Egypt.” The Economic Research Forum (ERF) Working Paper # 9613. Cairo, Egypt: Economic Research Forum (ERF).
- Wahba, J. 2009 “Informality in Egypt: A Stepping Stone or A Dead End?” The Economic Research Forum (ERF) Working Paper # 456. Cairo, Egypt: Economic Research Forum (ERF).
- Wai, H. K. 2009. “Decomposition of Changes in Hong Kong Wage Dispersion since 1980s: A Distributional Approach.” Master’s thesis. http://commons.ln.edu.hk/econ_etd/9/
- Youm7 2016. “Information You Should Know about “Form 6” and New Controls for Acceptance (Arabic Reference).” Youm7, October 5. https://bit.ly/2kv6ewd
ANNEXE
The Gini coefficient RIF function:
According to Firpo, Fortin, and Lemieux (Citation2007a):
The Gini coefficient is defined as
Where
With
and is the generalized Lorenz ordinate of
The influence function will be
Where
The RIF will be:
(b) The interquartile ratio (iqratio =
) RIF function
According to Chung and Van Kerm (Citation2018) and Rios-Avila (Citation2019)
(c) Descriptives
Table A1. Descriptive statistics
Table A2. Trends in real monthly median wages 1998–2012 (males 15–64 years old)