
 ?Mathematical formulae have been encoded as MathML and are displayed in this HTML version using MathJax in order to improve their display. Uncheck the box to turn MathJax off. This feature requires Javascript. Click on a formula to zoom.
ABSTRACT
This study aims to investigate the determinants of short- and long-run private investment behavior in Saudi Arabia for eight non-oil sectors. Saudi Arabia is currently proceeding with its Vision 2030 reform plan, which aims to significantly increase the private sector’s contribution to the country’s gross domestic product. Thus, analyzing private investments at the sectoral level is important for Saudi Arabia. Such an analysis can provide policymakers with a deeper understanding of potential opportunities for boosting private sector growth. This study therefore uses a cointegration and equilibrium correction approach to empirically analyze investments by sector over the period from 1989–2017. We identify a long-run relationship among investments, output and the real interest rate for all sectors except agriculture. Additionally, the real exchange rate has long-run relationships with investments in the agriculture, non-oil manufacturing and other services sectors. This finding implies that sector-specific tailored investment policies are preferable to a one-size-fits-all investment policy.
I. Introduction
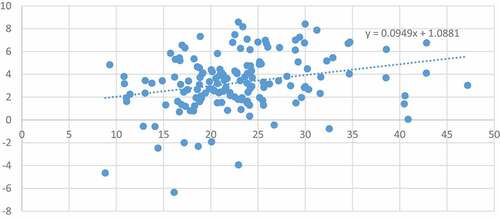
Investment is crucial for the economy and economic policy. By increasing an economy’s productive capacity, it not only contributes to economic performance over the business cycle but also improves the economy’s long-run growth prospects. According to Dornbusch, Fischer, and Startz (Citation2014), countries with high growth rates devote a substantial fraction of their output to investment. For example, looking at the relation between the GDP growth rate and the percentage of gross fixed capital formation of GDP for 158 countries in 2018, as reported by the World Bank Developments indicators (), it emerges clearly that rapidly growing countries managed high investment rates, such as China and a group of South Asean countries. In contrast, a group of Sub-saharian countries have had low investment rates and remain less developed, such as, for example, Sudan, Angola, Namibia. It is therefore important for countries to utilize capital investments to drive their growth prospects. This motivation is particularly relevant for fast-growing, young and emerging economies.
It is crucial for policymakers to have a coherent and comprehensive understanding of the determinants of investment and their quantitative impacts. Such an understanding is necessary to design an appropriate set of policies to trigger investment and spur economic growth. This study therefore aims to provide policymakers with a state-of-the-art analysis of investment in Saudi Arabia.
Figure 1. GDP growth – invetment relation.
Before the COVID-19 pandemic crisis, studying investment in mature, industrialized economies lost interest from an applied macroeconomics and econometric perspective, due to the stagnant demographic growth and to the characteristic of investment, mainly used to replace existing capital stock. Replacement is theoretically straightforward and therefore, the volatility of investment over the business cycle has become less important, with the respect to the past (Aizenman and Marion Citation1999).
On the other hand, the COVID-19 shock has brought the attention again to investment even in the advanced economies. For instance, the European Union (European Union Citation2020) has recently addressed the attention to new investment needs, including additional investment needs to contrast the excessive reliance on third countries for strategic supply chains and new technology investment to achieve the Green transition (e.g. Caetano et al. Citation2022) and Digital transformation goals (e.g. information technology, the Internet of Things and artificial intelligence. Ahmed and Farah Citation2022).
In this framework, Saudi Arabia features fast demographic expansion, rapid gross domestic product (GDP) growth and vast economic diversification programs. Saudi Arabia is currently proceeding with its Vision 2030 reform plan. This program’s strategic macroeconomic pillars aim to increase the private sector’s contribution to GDP from 40% to 65%. The plan also targets raising the share of foreign direct investment in GDP from 3.8% to 5.7%, the share of non-oil exports in non-oil GDP from 16% to 50% and reducing unemployment from 12% to 7%. Achieving these targets require massive investments (Saudi Vision 2030). Thus, analyzing drivers of investment is crucial in evaluating its role in promoting long-run production capacity expansion and sustaining robust and healthy long-term growth. Such analyses may be particularly important to policymakers.
Despite the importance of studying investment in Saudi Arabia, there has been only limited attention in the literature, mainly focusing on aggregate investment, such as Mensi et al. (Citation2018), Soummane, Ghersi, and Lefèvre (Citation2019), Blazquez et al. (Citation2021) and the effect of foreign direct investment (Alfalih and Hadj Citation2020). In this context, this paper makes four contributions to the literature. First, we econometrically analyze the determinants of Saudi Arabia’s private investments. Specifically, we investigate the impacts of output, real interest rates and real exchange rates on investment in the short and long terms.
Second, we analyze investments at the sectoral level. To the best of our knowledge, this study is the first to investigate investment in Saudi Arabia by sector. We estimate different intensities and sectoral speeds of adjustment (SoA) of investment. The latter measures the speed at which investment returns to its long-run equilibrium after a short-run perturbation and is a relevant instrument for policy recommendations. This study focuses on non-oil sectors, which are the main focus of the government’s diversification strategy. This sectoral analysis is particularly important for Saudi Arabia because it can provide policymakers, businesses and academics with a deeper understanding of potential growth opportunities. Sector-level growth and investment trends have important implications for development strategies. Understanding differences by sector is necessary to choose the most effective policy allocation in the presence of resource constraints.
Third, we utilize data from recent years. Our data cover a period in which a low oil price regime emerged and the Saudi government implemented major domestic energy price and fiscal reforms. Fourth, we provide a new empirical framework that incorporates non-stationarity and cointegration. Previous studies on investment have not taken into account for these issues.
The rest of this paper is organized as follows. We review the literature in Section II. Section III illustrates the empirical framework and the econometric methodology. Section IV describes the data and the variables used in the investigation, and Section V presents the empirical results. Section VI provides a discussion of the results. Section VII concludes the study.
II. Literature review
The modern study of investment began in the 1930s, when the Great Depression inflicted widespread economic suffering on Europe and America. At this time, a theory of the business cycle was greatly needed to understand the drivers of the downturn. John Maynard Keynes responded to that need with ‘The General Theory of Employment, Interest and Money,’ which he wrote in 1936 (Keynes Citation1936). Investment is the component of aggregate demand that falls the most in business cycle downturns. Thus, it was a natural candidate for Keynes to consider in searching for the causes of declines in demand.
To this day, the underlying principles of Keynes’ theory of investment remain the basis for the study of investment behavior. His theory states that investment is the result of firms balancing the expected return on new capital with the cost of capital. This cost depends primarily on the real interest rate. This study focuses on fixed investment. Economists usually reserve the term ‘fixed investment’ for transactions that increase real aggregate wealth in an economy. These transactions typically involve the purchase (or production) of new real durable assets, such as factories and machines. The fixed investment category that receives the most attention is business fixed investment, which refers to businesses’ purchases of new structures and equipment for production.
Appendix A presents developments in investment theory and updates to the main specifications of the investment function developed in subsequent research since Keynes. In this section, we describe the most recent results that are most relevant for Saudi Arabia. Our literature review shows that analyses of investment behavior in developing countries, particularly those in Arab countries, are scarce. The main reason for this lack of studies on emerging countries is the limited availability of suitable data for econometric analysis.
In a macroeconomic framework, investment is a crucial component of aggregate demand. Thus, it is both a determinant of GDP and a variable driven by aggregate demand. The few studies that have been conducted focus on both directions of analysis. Mann and Sephton (Citation2015) estimate several vector error correction models (VECMs) to determine the impacts of various types of spending on Saudi Arabia’s real non-oil GDP. They use aggregate annual data from 1971 to 2012 for their analysis and consider private investment, defense, education, health care and housing expenditures. Mensi et al. (Citation2018) estimate nonlinear autoregressive distributed lag models of quarterly data from 1992 to 2014. They analyze the impacts of private investment, public investment, oil production and inflation on Saudi Arabia’s non-oil GDP.
Elheddad (Citation2019) investigates a dataset of greenfield foreign direct investment (FDI) inflows to the six Gulf Cooperation Council countries during the period 2003–2013. He finds that sectoral FDI positively affects public domestic investment and negatively affects private investment. Bolbol and Omran (Citation2005) provide an interesting investigation of the effects of stock returns, cash flow and sales as determinants of fixed investment. They use data for 83 firms in five Arab countries from 1996 to 2001. The study finds that cash flow has no effect on investment, possibly because of the dividend policy. Moreover, the growth rates of investment and sales are only weakly related.
Additionally, some related studies focus on other developing countries. Acosta and Loza (Citation2005) empirically estimate an error correction model of changes in investment as a function of changes in output for Argentina. The long-run solution implies that investment and output have a linear relationship. In the short term, the exchange rate, the change in public investment, and external debt and domestic financing conditions significantly determine investment.
Meyer, Manete, and Muzindutsi (Citation2017) examine the effects of government expenditure and sectoral investment on economic growth in South Africa. They consider the mining, manufacturing and financial sectors and use quarterly time series data from 1995 to 2016. The VECM results indicate that in South Africa, financial sector investment is the only significant driver of short-run economic growth. The long-run results, in contrast, show that only manufacturing sector investment has a positive impact on economic growth. Government spending is found to have a minimal effect on economic growth.
III. Empirical specification and econometric methodology
The specification of the investment equation to be estimated must account for the nature and availability of the data for empirical analysis. Our main goal is to estimate separate investment equations for different sectors of the Saudi economy. Thus, we need to analyze sectoral data. The set of available variables that can be included in the econometric specification is somewhat limited as a result.
More importantly, because we use time series data, we must consider the non-stationarity of the variables before performing the analysis. According to cointegration theory, typically the non-stationary variables in an empirical model have a long-run relationship, not a spurious, if a linear combination of them is stationary. The final specification of the investment equation therefore depends on the results of the stationarity analysis.
Appendix B thoroughly reviews the various empirical specifications for investment equations that have been advanced in the literature. Here, we summarize the main features of the proposed specification for this study. This specification is the best option because it balances coherence with the theory and data availability.
The investment function is based on a general linear relation between investment and its main long-run determinants. We also develop an error/equilibrium correction mechanism (ECM) to account for short-run dynamics. In the general linear relationship, we use a log-linear representation for all variables except the real interest rate. Thus, the long-run relationship between investment and its determinants is as follows:
Here, inv, gva and rer are the natural logarithms of real fixed investment, real value added and the real exchange rate, respectively. RI is the real interest rate. We choose these regressors based on the literature review and theoretical considerations.
In practice, actual investment may deviate from the right-hand side of (1) in the short run. To account for such deviations, we assume that discrepancies are corrected on a period-by-period basis. We model this dynamic process using an ECM, which we estimate via a two-step process. First, we construct the equilibrium correction term (ECT) using the estimated long-run relationship:
Here, the terms with hats are the estimated values of the parameters in (1). In the second step, we use the ECT with one lag to estimate the ECM. This model embeds the long-run relationship into the short-run dynamics by means of ECT alongside changes in the independent and dependent variables, as follows
Note that deterministic regressors, such as time trends and dummy variables, can be included in both the long-run (1) and short-run (3) equations. These terms can capture technological changes, structural developments, shocks and other unusual factors that may be relevant (e.g. Hendry and Juselius Citation2000; Juselius Citation2006; Pesaran, Shin, and Smith Citation2001).
To estimate (3), we follow the general-to-specific modeling (GTSM) approach and use automatic model selection (AMS) (Doornik Citation2009; Doornik and Hendry Citation2009, Citation2018; Santos, David, and Johansen Citation2008). AMS combines GTSM, impulse indicator saturation (IIS) and step indicator saturation (SIS), making it more powerful than conventional modeling devices. IIS and SSI automatically capture all one-time, temporary or permanent breaks in a modeled variable’s time path. Thus, the modeler does not have to model this manually and saves time that can be used to interpret the results obtained to.
With this approach, we first include all potentially relevant variables and their lags based on the theoretical framework. The result of this step is referred to as a general unrestricted model. This approach then selects a specific model, the final ECM, by excluding statistically insignificant variables and comparing the standard errors of the regressions while performing tests for autocorrelation, serial correlation, normality, heteroscedasticity, misspecification and encompassing at each step of exclusion.
IV. Data, variable construction and descriptive statistics
We estimate investment equations for eight sectors of the Saudi Arabian economy. For the sectors below, investment and value added data are available with codes in parentheses.
Agriculture and forestry (AGR)
Construction (CON)
Distribution: Retail, wholesale, hotels and catering (DIS)
Finance, insurance, real estate and business services (FIBU)
Manufacturing (MANNO)
Other services: Community, social and personal services (OTHS)
Transport and communication (TRACOM), excluding pipeline transportation of hydrocarbons
Utilities (U)
We obtain annual time series data for these sectors for the period 1989–2017, as shown in .
Table 1. Descriptions and sources of the variables
We denote investments and gross value added in sector X as ‘INVX’ and ‘GVAX’. Here, X indicates the sectors listed above (i.e. AGR, CON, DIS, FIBU, MANNO, OTHS, TRACOM and U). For example, INVAGR and GVAAGR indicate investment and value added, respectively, in the agriculture sector.
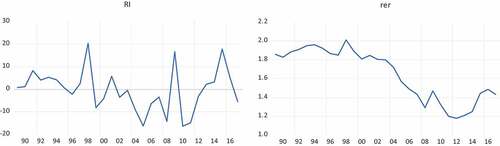
show the natural logarithms of investments and value added in each of the eight sectors. plots the interest rate and the natural logarithm of the real exchange rate over time. Lowercase letters indicate the natural logarithmic expression of a given variable.
Figure 2. Time profile of the natural logarithm of investment by sector.
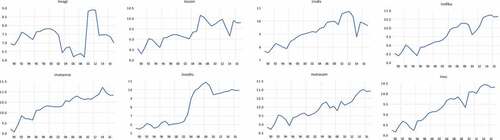
Figure 3. Time profile of the natural logarithm of value added by sector.
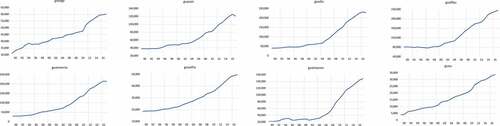
Figure 4. Time profiles of the real interest rate and the logarithm of the real exchange rate.
presents descriptive statistics of the variables used in the econometric estimations and tests.
Table 2. Descriptive statistics of the variables
The gross value added plots indicate a generalized acceleration of the economy around 2005 for several sectors, excluding the agriculture, utilities and other services sectors. This trend is in line with the developmental stages of the Saudi economy. The non-oil economy grew rapidly from 2004 to 2014, mainly owing to government spending fueled by high oil prices in international energy markets. Similarly, sectoral trend lines, particularly for agriculture, construction, distribution and non-oil manufacturing, have either flattened considerably or even declined since 2015. The decline in oil prices after 2015 has reduced government expenditures (e.g. Al Moneef and Hasanov Citation2020; Hasanov et al. Citation2020a; Hemrit and Benlagha Citation2018).
V. Empirical results
The first step of the econometric investigation is to check for the presence of a unit root. Appendix C1 and C2 present the outcomes of augmented Dickey Fuller (ADF) and Phillips-Perron (PP) unit root tests, respectively. However, the ADF and PP tests results both strongly reject the null hypothesis for first differences, suggesting that all of the variables follow unit root processes. In contrast, the real interest rate follows a I(0) process according to both tests’ results.
We next assess whether the variables under scrutiny have a long-term relationship. To that end, we use the autoregressive distributed lagged bounds testing (ARDL-BT) approach. Thus, we initially estimate the ARDL EquationEquation (1)(1)
(1) for each sector except transport and communication. Given the short time span of our sample, we choose a maximum lag order of two. . reports the cointegration test results and the estimated long-run elasticities or coefficients.
Table 3. Long-run estimation and cointegration test results
The last row of shows the cointegration test results for the eight sectors. For all but the agriculture and transport and communication sectors, the numerical values in this row are the sample F-statistics from ARDL bounds testing. These F-statistics indicate that the null hypothesis of no cointegration can be rejected in favor of the alternative hypothesis of cointegration for these six sectors.
The F-statistics for agriculture and transport and communication are instead estimated using CCR and VAR, respectively. For the agriculture sector, the bounds testing results suggest the existence of cointegration between investment, value added and the real exchange rate. However, the ARDL estimation does not provide meaningful results, whereas a CCR-based estimation and cointegration test does. Thus, we report the CCR estimation and test results in . The value of 2.87 shown in the table is the chi-square sample statistic of the added variables cointegration test with the probability of 0.24. The null hypothesis of this test is that cointegration among the tested variables exists. The probability value obtained from the test indicates that the null hypothesis of cointegration cannot be rejected. In other words, the test indicates that investment, value added and the real exchange rate have a long-run relationship in the agriculture sector. The results for the transport and communications sector are also reported in . The Johansen cointegration test for the transport and communications sector indictaes rejection of the null hypothesis of no cointegration at the 5% significance level.
The cointegration test results indicate that sectoral investment establishes a long-run relationship with value added in all sectors. The real interest rate enters the long-run relationship among the variables in all sectors except the agriculture sector. The real exchange rate is also part of the long-run relationships in the agriculture, non-oil manufacturing and other services sectors. shows that the estimated long-run relationships for all sectors are theoretically interpretable and statistically significant.
As both investment and value added are expressed in logarithms, the estimated coefficients in correspond to long-run elasticities. Thus, in the financial and other services sectors, a 1% increase in value added leads to long-run increases in gross investment of 1.7% and 2.8%, respectively. For distribution and utilities, the corresponding elasticities are slightly greater than one. In the remaining sectors, investment is inelastic relative to value added. All of the coefficients of the real interest rate are negative, as expected, and these semi-elasticities are very small in the long run. Finally, the real exchange rate has a small positive impact in the non-oil manufacturing sector and a large negative effect in the other services sector.
Saudi Arabia is an oil-based economy, and its economic indicators are largely influenced by fluctuations in the oil market. Such fluctuations occur for a variety of reasons, including economic crises, political instability in oil-producing countries and changes in policies, among others. Thus, Saudi Arabia’s macroeconomic data may be subject to outliers over time caused by external oil market conditions and domestic policy changes (see ). If such outliers are present in the data generation process but are not captured in the econometric analysis, the estimations may be less accurate. We therefore use dummy variables for different years in the short-run analysis.
presents the final ECM specifications estimated using the GTSM strategy. The table shows that all of the SoA coefficients are negative, less than one in absolute value, as expected, and statistically significant. These results confirm the validity of the ECM specification, as the long-run relationships among the variables are not stable otherwise. Additionally, the Engle-Granger theorem shows that if the variables are cointegrated, then an equilibrium correction representation of the long-run relationship should exist.
Table 4. Final ECM specifications by sector
shows that all of the ECT coefficients are negative, as expected. The coefficients range from −0.15 to −0.66. The SoA to equilibrium after a shock is low in the distribution, other services and transport and communication sectors. In the construction, finance and non-oil manufacturing sectors, the SOA is higher. For instance, the non-oil manufacturing sector adjusts approximately 66% of the way back to the long-run equilibrium one year after a shock. The table also shows the short-run coefficients that are statistically significant, most notably for the real interest rate. The model also passes all of the diagnostic tests for serial correlation(LM test), heteroscedasticity (White heteroskedasticity test), the normality of the errors (Jarque-Bera test) and misspecification (Ramsey regression equation specification error test).
VI. Discussion
To keep the discussion of these results brief and informative, we organize it by explanatory variable rather than by sector, as we consider eight sectors. In all sectors, value added has a statistically significant and theoretically expected long-run impact on investment. The magnitudes of the estimated elasticities of value added with respect to investment are around unity in the construction, distribution, non-oil manufacturing, transport and communications, and utilities sectors. The corresponding elasticities for the agriculture, financial and other services sectors are around two. The positive impact of value added on investment is intuitive to understand. An expansion in economic activity and the resulting increases in income and profits allow investors to increase their investments. We note that an income increase leads to more investment in the agriculture, other services and financial sectors than in other sectors in Saudi Arabia.
We find that the real interest rate has a negative and statistically significant impact on investment in all sectors except the agriculture sector. As discussed in the theoretical framework section, economic agents reduce their investments when the cost of capital is high. Conversely, they are encouraged to invest more if the cost of capital is low. Investments’ reactions to changes in the aggregate real interest rate have different magnitudes in different sectors. The coefficient of the real interest rate ranges from −0.01 to −0.04 for the financial, utilities, construction, non-oil manufacturing, and transport and communication sectors. This coefficient is relatively higher for the distribution sector. Investments in the other services sector are the most sensitive to changes in the real interest rate.
We find no impact of the real interest rate on investment in the agriculture sector. We believe this result is because the government heavily subsidizes and incentivizes this sector. Hence, market drivers, such as interest rates, have little influence over private investment decisions in the sector. The government has some valid reasons for providing these incentives, such as food security, rural development and economic diversification. Studies conclude that the government incentive programs play positive roles in the agriculture sector (Al-Shayaa, Baig, and Gary Citation2012; Alyousef and Stevens Citation2011; Grindle, Siddiqi, and Anadon Citation2015; Mousa Citation2018; Tuncalp and Yavas Citation1983). Regardless of the cost of capital (i.e. the interest rate), the agriculture sector requires a certain amount of investment determined by its nature.
Similar explanations can apply to the small effect of the real interest rate on investment in the utilities sector. This sector is mostly under government control in Saudi Arabia and is capital-intensive by nature. Hasanov et al. (Citation2020a) estimate the capital elasticity of output in this sector to be 0.66 for 1996–2016. Indeed, the necessary investments to expand this sector to meet the growing demand for utilities are very likely to be made even if the cost of capital is high. Utilities is a strategic sector, as it provides electricity, water and gas to the country. Thus, the government intervenes when needed by providing either soft loans or other measures of support.
The real interest rate likely has a small impact on investment in the financial sector because this sector is more labor-intensive than capital-intensive. For example, Hasanov et al. (Citation2020b) estimate the labor elasticity of output in this sector to be 0.78. Hence, the financial sector is not considerably influenced by changes in the cost of capital.
The real interest rate also has a small impact on investment (−0.02) in the construction sector. This sector’s activity is largely driven by government bids and contracts, as a significant portion of government spending is directed to this sector. The average share of government spending in total spending for nonresidential building and other construction was 68% during 2013–2017 according to General Authority for Statistics (GAStat) (Citation2017). Consequently, the government has a stake in achieving a certain development level in this sector, including private investments, to successfully complete its projects. Additionally, government support may cause the relatively moderate impacts of interest rates on investment in the non-oil manufacturing and transport and communication sectors.
Conversely, the other services (community, social and personal services) and distribution (retail, wholesale, hotels and catering) sectors are mostly privately owned. These sectors receive less government support. Thus, their investments are more responsive to changes in the real interest rate compared to those in the other sectors discussed above.
Next, we find that the real exchange rate’s long-run impact on investment is statistically significant and theoretically interpretable in the agriculture, non-oil manufacturing and other services sectors. The effect is positive for the former two sectors and negative for the latter sector. Numerically, a 1% rise in the real exchange rate causes 2.99% and 0.85% increases in investments in the agriculture and non-oil manufacturing sectors. In the other services sector, investment declines by 2.38% if the real exchange rate rises by 1%. Theoretical aspects of the impact of exchange rate changes on aggregate and sectoral investments are well-documented in the literature. Goldberg (Citation1993), Campa and Goldberg (Citation1995) and Harchaoui, Tarkhani, and Yuen (Citation2005), among others, provide relevant discussions. Additionally, Goldberg (Citation1993) discusses differences in the effects of exchange rate movements on tradable and non-tradable sectors from a theoretical perspective.
The exchange rate used in this study is riyals per U.S. dollar in real terms. Thus, an increase in the exchange rate indicates a depreciation of the riyal. We find that a depreciation of the riyal increases investments in the agriculture and non-oil manufacturing sectors. This result is consistent with the theoretical discussions of the impact of exchange rate movements on tradable sectors in the above-mentioned studies. The reasoning is that when the riyal depreciates in real terms, Saudi Arabia’s agriculture and non-oil manufacturing products become more attractive to foreign purchasers. Increased exports of these tradable goods lead profits and income to rise, enabling these sectors to expand investment to meet the increased demand for their products. The opposite relation holds when the riyal appreciates in real terms (i.e. export revenues decline). Thus, investment opportunities in the agriculture and non-oil manufacturing sectors fall.
Our finding that a real exchange rate depreciation decreases investment in other services fits with the theoretical explanations documented in the above-mentioned studies. In Saudi Arabia, a depreciation in the riyal in real terms can negatively affect the other services sector through two main channels. The first is that a depreciation in the riyal expands tradable sectors, such as agriculture and manufacturing. High returns on capital and high wage rates in tradable sectors may shift investment and labor resources from the services sector to these sectors. Such a shift occurs if the substitution effect between these sectors holds. Additionally, according to the Balassa-Samuelson hypothesis, increased productivity in tradable sectors increases the price levels in non-tradable sectors (Balassa Citation1964; Samuelson Citation1964). Such price increases can further harm the services sector. The second channel is related to imports. Specifically, when the riyal depreciates in real terms, intermediate services and goods, including investments imported from abroad for the services sector, become more costly. These increased costs may force producers to reduce production and, thus, investment in the services sector.
We now turn to the short-run estimation results. documents the final ECM specifications based on the GTSM approach. We discuss the SoA coefficients in more detail, as they provide useful information for decision-making processes. Specifically, they describe the speed of the correction process in each sector. All eight SoA coefficients have the expected negative signs and are statistically significant at conventional levels. A given investment series may deviate from its established long-run relationship that provides the desired level of capital owing to a policy or socioeconomic shock. In that case, the estimated SoA coefficients imply that the disequilibrium is corrected toward the long-run equilibrium path.
The SoA coefficients vary across sectors, mainly owing to the nature of the sectoral investments and the established long-run relationships. However, all of the correction processes take less than one year. The sector with the fastest correction speed is the non-oil manufacturing sector. Investment in this sector reverts 66% of the way to the equilibrium level in the year following a shock. The other services sector has the slowest adjustment speed. Investment reverts 15% of the way to the equilibrium following a shock, and a full correction takes seven years.
More generally, we observe that investments in the sectors with considerable government support usually have higher SoA coefficients relative to the other sectors. For example, the non-oil manufacturing, construction and utilities sectors have greater SoA coefficients relative to the other services and distribution sectors. This observation may imply that government support or intervention help sectors’ investments revert to their equilibrium relationships more quickly.
As mentioned above, the utilities sector provides the country with electricity, gas and water. Hence, it is important for investments in this sector to return to their optimal level quickly following a shock. However, this interpretation does not hold for the agriculture sector. The difference may be due to the distinguishing features of this sector in Saudi Arabia. It may also be a result of a data accuracy issue.Footnote1
The SoA coefficients in the financial sector are relatively larger than those in other sectors with little or no government support or intervention (i.e. the other services and distribution sectors). This result may be related to the nature of the financial sector. This sector provides Saudi Arabia with financial, insurance, real estate and business services. The country would have difficulties if these services were disrupted for a long time, particularly in the case of banking services.
also shows the explanatory variables that survive in the final ECM specifications for the growth rate of investment. The contemporaneous and lagged growth rates of value added survive only in the final specification for the agriculture sector. The growth rates of the real exchange rate survive only in the final ECMs for the agriculture and non-oil manufacturing sectors. The contemporaneous values of the real interest rate growth rates are statistically significant in the construction, distribution, non-oil manufacturing, other services and utilities sectors. The two-year lagged value of the real interest rate is significant only in the distribution sector. The one-year lagged value of the interest rate has no explanatory power for short-run investments in any sector.
We provide some interpretations of these coefficients. The short-run cumulative impact of value added on investment is 2.3 in the agriculture sector. We think that the short-run negative impact of a real exchange rate depreciation on investment can be explained by the imported intermediate goods and services used in agriculture production. An exchange rate depreciation increases the costs of these goods, discouraging farmers from investing and producing more. Although the negative effect of a depreciation appears to outweigh the positive effect in the short run, the effects flip over time.
A one percentage point increase in changes in the real interest rate leads to one percentage point declines in the investment growth rates in several sectors. These sectors are the construction, non-oil manufacturing and utilities sectors. In the distribution and other services sectors, such an increase causes the investment growth rate to decline by two percentage points. Again, the real interest rate has a smaller impact in the short run than in the long run.
Lastly, we observe that investments show persistency in the distribution, financial, non-oil manufacturing and other services sectors. Unfortunately, we are unable to compare the numerical values obtained in this research (long- and short-run) with those from other studies. We did not find any previous econometric studies on sectoral investments in Saudi Arabia.
VII. Conclusions and policy insights
Saudi Arabia has adopted several policies to stimulate non-oil economic growth and reduce dependence on oil over the course of several decades. Since the 1970s, various national development plans have been designed and implemented. These plans aim to boost human capital and develop new industry and service sectors in Saudi Arabia. The share of non-hydrocarbon output in GDP has increased steadily, but it remains highly correlated with oil prices and there is a large room for economic diversification, a key component of sustainable growth (Callen et al. Citation2014).
Given this background, investment can be considered a key factor in promoting the efficient allocation of capital. Capital should move away from hydrocarbons and energy-intensive industries to sectors that promote sustainable growth and job creation. This need has been emphasized in the literature (International Monetary Fund (IMF) Citation2016b). Non-oil sector investments in Saudi Arabia can contribute to the country’s economic performance through a variety of channels. Thus, empirical investigations of investment relationships are important to help decision-makers take effective measures.
Sometimes, investigating a given process at the aggregate level does not provide appropriate consideration or understanding of sectoral implications. Thus, this study explored the relationship between private investment and its determinants at the sectoral level. All of the high-level government initiatives and targets for non-oil economic diversification require sectoral considerations and sector-specific policies. This study aims to support these needs.
One result that decision-makers may wish to consider is that investments in different non-oil sectors in Saudi Arabia react differently to the determinants of investment. This finding implies that instead of one-size-fits-all investment policy, tailored, sector-specific policy measures should be considered.
Decision-makers may also consider that in all sectors, increases in economic activity lead to similar or greater increases in investments in the long run. This study considered private investment and, thus, our policy recommendations are primarily relevant for private decision-makers. Nevertheless, the government can still play a role to achieve the desired investment level in each sector by influencing sectoral output. For example, the government can create additional demand for a sector’s goods and services. One option for doing so is to reduce the share of imports in government purchasing and prioritize locally produced goods and services. Such a policy can also support the local content strategy, which is a major consideration for the Kingdom’s economic diversification. The government can purchase goods and services, where it is possible and relevant to do so, even if such purchases have limited direct effects. However, the positive impacts will spill over to other sectors, as sectors are interconnected in their activities. The magnitudes of the estimated investment elasticities with respect to output show that all sectors can benefit from such a policy measure.
Decision-makers may also note that the real interest rate may be a useful tool for influencing sectoral investment decisions in the long run. It may be particularly useful for such sectors as other services, distribution, and transport and communication. This tool is also useful in the short run for these sectors and for the construction, non-oil manufacturing and utility sectors. It should be also, considered that, however, there is not much room for maneuver in interest rates, as Saudi monetary policy follows the United States Fed policy due to the fixed exchange rate between the riyal and the dollar since 1987.
Our findings show that a deprecition of the riyal in real terms benefits non-oil tradable sectors, such as agriculture and non-oil manufacturing. However, a depreciation policy is not straightforward to implement because of the fixed exchange rate regime mentioned above. This regime has supported the development of the economy remarkably (Alkhareif, Barnett, and Qualls Citation2017). The real exchange rate can also be influenced by the domestic prices. However, the ability of this channel is limited in the short run given that some recently implemented reforms in Saudi Arabia may increase production costs. Therefore, the government rightly introduced industry and agriculture support packages to protect these sectors and maintain their international competitiveness. The Fiscal Balance Program describes different aspects of these packages (Fiscal Balance Program (FBP) Citation2017). The collected revenues from these reforms can be reinvested in the economy. Together with the efficiency gains from the reforms, this can increase the competitiveness of Saudi economy and make it attractive to foreign and local investors in the medium to long term.
Availability of data
The data that support the findings of this study are available from the corresponding author, upon request.
Supplemental Material
Download MS Word (38.4 KB)Disclosure statement
No potential conflict of interest was reported by the author(s).
Funding
This research was not sponsored by any institution or agency in any way.
Supplementary material
Supplemental data for this article can be accessed here.
Notes
1 We check the ratio of private investment in agriculture used in this study to the gross fixed capital formation of agriculture, forestry and fishing from FAOSTAT (http://www.fao.org/faostat/en/#data/CS). We measure both values in millions of 2010 riyals. The ratio is around 47% during 1996–2000 but declines significantly to 8% during 2006–2009. It then jumps tremendously from 7% in 2009 to 98% in 2010. More surprisingly, this ratio equals 106% and 103% in 2011 and 2012, respectively, which is nonsensical. These results cast some doubt on the accuracy of the data on private investment in agriculture.
References
- Acosta, P., and A. Loza. 2005. “Short and Long Run Determinants of Private Investment in Argentina.” Journal of Applied Economics 8 (2): 389–406. doi:10.1080/15140326.2005.12040634.
- Ahmed, M. I., and Q. F. Farah. 2022. “On the Macroeconomic Effects of News About Innovations of Information Technology.” Journal of Macroeconomics 71:103389.
- Aizenman, J., and N. Marion. 1999. “Volatility and Investment: Interpreting Evidence from Developing Countries.” Economica 66 (262): 157–169. doi:10.1111/1468-0335.00163.
- Al Moneef, H. E., and F. Hasanov. 2020. “Fiscal Multipliers for Saudi Arabia Revisited.” KAPSARC Discussion Paper. No. ks–2020-dp21.
- Al-Shayaa, M. S., M. B. Baig, and S. S. Gary. 2012. “Agricultural Extension in the Kingdom of Saudi Arabia: Difficult Present and Demanding Future.” Journal of Animal and Plant Sciences 22 (1): 239–246.
- Alfalih, A. A., and T. B. Hadj. 2020. “Foreign Direct Investment Determinants in an Oil Abundant Host Country: Short and Long-Run Approach for Saudi Arabia.” Resources Policy 66: 101616. doi:10.1016/j.resourpol.2020.101616.
- Alkhareif, R. M., W. A. Barnett, and J. H. Qualls. 2017. “Has the Dollar Peg Served the Saudi Economy Well?” International Finance and Banking 4 (1): 145. doi:10.5296/ifb.v4i1.11189.
- Alyousef, Y., and P. Stevens. 2011. “The Cost of Domestic Energy Prices to Saudi Arabia.” Energy Policy 39 (11): 6900–6905. doi:10.1016/j.enpol.2011.08.025.
- Balassa, B. 1964. “The Purchasing-Power Parity Doctrine: A Reappraisal.” The Journal of Political Economy 72 (6): 584–596. doi:10.1086/258965.
- Blazquez, J., M. Galeotti, B. Manzano, A. Pierru, and S. Pradhan. 2021. “Effects of Saudi Arabia’s Economic Reforms: Insights from a DSGE Model.” Economic Modelling 95: 145–169. doi:https://doi.org/10.1016/j.econmod.2020.12.004.
- Bolbol, A. A., and M. M. Omran. 2005. “Investment and the Stock Market: Evidence from Arab Firm-Level Panel Data.” Emerging Markets Review 6 (1): 85–106. doi:10.1016/j.ememar.2004.09.005.
- Caetano, R. V., A. C. Marques, T. L. Afonso, and I. Vieira. 2022. “A Sectoral Analysis of the Role of Foreign Direct Investment in Pollution and Energy Transition in OECD Countries.” Journal of Environmental Management 302: 114018.
- Callen, T., R. Cherif, F. Hasanov, A. Hegazy, and P. Khandelwal. 2014. Economic Diversification in the GCC: Past, Present, and Future. Washington DC. USA: International Monetary Fund.
- Campa, J., and L. S. Goldberg. 1995. “Investment in Manufacturing, Exchange Rates and External Exposure.” Journal of International Economics 38 (3–4): 297–320. doi:10.1016/0022-1996(94)01348-V.
- Campa, J., and L. S. Goldberg. 1999. “Investment, Pass-Through, and Exchange Rates: A Cross-Country Comparison.” International Economic Review 40 (2): 287–314. doi:10.1111/1468-2354.00016.
- Doornik, J. A. 2009. “Autometrics.” In The Methodology and Practice of Econometrics: A Festschrift in Honour of David F. Hendry, edited by J. L. Castle and N. Shephard, 88–121. Oxford: Oxford University Press.
- Doornik, J. A., and D. F. Hendry. 2009. Modelling Dynamic Systems: PcGive 13. London: Timberlake Consultants Press.
- Doornik, J. A., and D. F. Hendry. 2018. Empirical Econometric Modelling, PcGive 15. London: Timberlake Consultants Ltd.
- Dornbusch, R., S. Fischer, and R. Startz. 2014. Macroeconomics. New York, N.Y.: McGraw-Hill Education.
- Elheddad, M. 2019. “Foreign Direct Investment and Domestic Investment: Do Oil Sectors Matter? Evidence from Oil-Exporting Gulf Cooperation Council Economies.” Journal of Economics and Business 103: 1–12. doi:10.1016/j.jeconbus.2018.11.001.
- European Union. 2020. Identifying Europe’s Recovery Needs, Brussels, 27.5.2020, COMMISSION STAFF WORKING DOCUMENT, Accompanying the Document COMMUNICATION from the COMMISSION to the EUROPEAN PARLIAMENT, the EUROPEAN COUNCIL, the COUNCIL, the EUROPEAN ECONOMIC and SOCIAL COMMITTEE and the COMMITTEE of the REGIONS, Europe’s moment: Repair and Prepare for the Next Generation, {COM(2020) 456 final}
- Fiscal Balance Program (FBP). 2017. “Fiscal Balance Program, Kingdom of Saudi Arabia Vision 2030.” 2019 update. Accessed 15 May 2019. http://vision2030.gov.sa/en/bb2020
- General Authority for Statistics (GAStat). 2017. “National Accounts.” The Kingdom of Saudi Arabia.
- Goldberg, L. S. 1993. “Exchange Rates and Investment in United States Industry.” The Review of Economics and Statistics 75 (4): 575–588.
- Government of Saudi Arabia. 2016. “Saudi Vision 2030.” Accessed 15 May 2019. https://vision2030.gov.sa/en.
- Grindle, A. K., A. Siddiqi, and L. D. Anadon. 2015. “Food Security Amidst Water Scarcity: Insights on Sustainable Food Production from Saudi Arabia.” Sustainable Production and Consumption 2: 67–78.
- Harchaoui, T. M., F. Tarkhani, and T. Yuen. 2005. “The Effects of the Exchange Rate on Investment: Evidence from Canadian Manufacturing Industries.” Bank of Canada Working Paper No. 2005-22.
- Hasanov, F. J., N. AlKathiri, S. Alshahrani, and R. Alyamani. 2020a. “The Impact of Fiscal Policy on Non-Oil GDP in Saudi Arabia.” KAPSARC Discussion Paper. Doi: 10.30573/KS–2020-DP014.
- Hasanov, F., F. L. Joutz, J. I. Mikayilov, and M. Javid. 2020b. “KGEMM: A Macroeconometric Model for Saudi Arabia.” KAPSARC Discussion Paper. No. KS–2020-dp04.
- Hemrit, W., and N. Benlagha. 2018. “The Impact of Government Spending on Non-Oil-GDP in Saudi Arabia (Multiplier Analysis).” International Journal of Economics and Business Research 15 (3): 350–372.
- Hendry, D. F., and K. Juselius. 2000. “Explaining Cointegration Analysis: Part 1.” The Energy Journal 21 (1): 1–42.
- International Monetary Fund (IMF). 2016a. “Economic Diversification in Oil-Exporting Arab Countries.” Prepared for the Annual Meeting of Arab Ministers of Finance, April.
- International Monetary Fund (IMF). 2016b. “Investment and Growth in the Arab World: A Scoping Note.” Prepared for the Annual Meeting of Arab Finance Ministers, April.
- Johansen, S. 1991. “Estimation and Hypothesis Testing of Cointegration Vectors in Gaussian Vector Autoregressive Models.” Econometrica 59 (6): 1551–1580.
- Juselius, K. 2006. The Cointegrated VAR Model: Methodology and Applications. Oxford: Oxford University Press.
- Keynes, J. M. 1936. The General Theory of Employment, Interest and Money. London: Harcourt Brace Jovanovich.
- Mann, J., and P. Sephton. 2015. “Revising Fiscal Policy and Growth in Saudi Arabia.” Journal of Reviews on Global Economics 4: 139–146.
- Mensi, W., S. H. Shahzad, S. Hammoudeh, and K. H. Al-Yahyaee. 2018. “Asymmetric Impacts of Public and Private Investments on the Non-Oil GDP of Saudi Arabia.” International Economics 15: 15–30.
- Meyer, D. F., T. Manete, and P.-F. Muzindutsi. 2017. “The Impact of Government Expenditure and Sectoral Investment on Economic Growth in South Africa.” Journal of Advanced Research in Law and Economics 6 (28): 1843–1855.
- Mousa, H. 2018. “Grain and Feed Annual.” GAIN Report No. SA1802. U.S. Embassy Riyadh: USDA Foreign Agricultural Service.
- National Transformation Program (NTP). 2017. “National Transformation Program 2020.” Kingdom of Saudi Arabia Vision 2030. Accessed 15 May 2019. https://vision2030.gov.sa/en/programs/NTP
- Park, J. Y. 1990. “Testing for Unit Roots and Cointegration by Variable Addition.” Advances in Econometrics 8 (2): 107–133.
- Pesaran, M. H., and Y. Shin. 1999. “An Autoregressive Distributed Lag Modeling Approach to Cointegration Analysis.” In Econometrics and Economic Theory in the 20th Century: The Ragnar Frisch Centennial Symposium, edited by S. Strom, 371–413. Cambridge, U.K.: Cambridge University Press.
- Pesaran, M. H., Y. Shin, and R. J. Smith. 2001. “Bounds Testing Approaches to the Analysis of Level Relationships.” Journal of Applied Economics 16 (3): 289–326.
- Samuelson, P. A. 1964. “Theoretical Notes on Trade Problems.” The Review of Economics and Statistics 46 (2): 145–154.
- Santos, C., F. H. David, and S. Johansen. 2008. “Automatic Selection of Indicators in a Fully Saturated Regression.” Computational Statistics 23 (2): 317–335.
- Saudi Arabian Monetary Agency (SAMA). 2020. “Yearly Statistics.” Accessed 15 May 2019. http://www.sama.gov.sa/en-US/EconomicReports/Pages/YearlyStatistics.aspx
- Soummane, S., F. Ghersi, and J. Lefèvre. 2019. “Macroeconomic Pathways of the Saudi Economy: The Challenge of Global Mitigation Action versus the Opportunity of National Energy Reforms.” Energy Policy 130: 263–282. doi:10.1016/j.enpol.2019.03.062.
- Tuncalp, S., and U. Yavas. 1983. “Agricultural Development in Saudi Arabia: Present Status and Prospects.” Third World Planning Review 5 (4): 333.
- World Bank. 2019. “World Development Indkcators.” https://databank.worldbank.org/home.aspx